The Use of Rainfall Variability in Flood Countermeasure Planning
Iis Catur Wulan Dhari
Public Works Agency, Pasuruan Regency, East Java, INDONESIA [email protected]
ABSTRACT
One of the impacts of climate change is the unpredictable shifting of seasons and rainfall patterns which caused flooding. Rejoso Watershed in Pasuruan Regency is one of the watersheds that suffer from flooding almost every year due to watershed degradation characterized by land conversion and changes in the hydrological behavior including the extreme rainfall pattern. This research was aimed to investigate the effect of rainfall variability on runoff and floodwater level profile along the river channel to provide technical and non-technical recommendation for handling flood problems. The hydrological analysis was performed using HEC-HMS version 4.0 software and the hydraulic analysis was conducted using HEC-RAS version 5.0.3 software. Several variations of extreme rainfall pattern were applied in the rainfall-runoff calculation to determine the representative flood discharges that will be used as input to the hydraulic simulation for evaluating the characteristics of flood water level. The result of the research shows that rainfall with the same depth yet varies in duration and starting time generate different flood hydrographs. Rejoso River could not store flood discharge with return period of 2 years with peak discharge of 201.46 m3/s that causing overflow along the stream. The recommendation to handle flood problems is by normalization, which could reduce the overtopping at several river reaches of 4,927 m, while the combination of normalization and embankment could reduce 7,843 m from the existing river length of 12,396 m.
Keywords: Rejoso River, rainfall variability, runoff, normalization, embankment 1 INTRODUCTION
Rain is one of the main variables in the earth’s water cycle, it also has important role in monitoring the management of water resources and natural disasters. Presently, there have been a lot of researchers on global climate that predicted that the climate change would change the spatial pattern of rainfall and show changes in the time duration and amount of the rainfall (Cai, et al., 2015). One of the climate change impacts is unpredictable shifting in seasons and rainfall pattern change which caused flooding in one place, yet drought in another area (Setiawan, 2014). Part of rainwater that falls on the soil surface will seep into the soil, and the rest will flow and turn into surface runoff. This surface flow is influenced by rainfall factor and the catchment area factor. The change of land characteristic from natural land to urban with dense settlement would reduce the hydrologic function in catchment area and increase the surface flow.
The Rejoso Watershed located in Pasuruan Regency is one of watersheds that suffer from flooding each year due to the rainfall pattern change. In the upstream part of the watershed, more than 60% of the protected forest area is converted into agricultural area; while the middle and downstream parts of the watershed, there has been landing conversion into settlements and factories (Konsulindo, PT. Innako Internasional, 2012).
2 CATCHMENT CHARACTERISTICS AND FLOOD MANAGEMENT
2.1 Rainfall Characteristics
The high rainfall in tropical area is generally generated from convection process and warm rain cloud. Basically, the precipitation is generated from upward movement of the damp water mass because the atmosphere is in unstable condition. The unstable condition occurs if the rising air is humid and the environmental lapse rate is between dry adiabatic lapse rate and saturated adiabatic lapse rate. This caused varied rainfall depths, intensity, duration, frequency and its time and space distribution (Juaeni, 2006). Rainfall variability is generally divided into areas (spatial) variability and temporal variability. Size of the varied rainfall is due to the orographic influence (Asdak, 1995). Rainfall variability by time is shown by the beginning and the ending time of a rain. The duration, initial time, and ending time of rainfall in a particular area may not necessarily the same with other areas. Maximum rainfall in a day that occurs in an area is also different with other areas. Also, the total rain day in a location is different with other locations. This shows the spatial variability of daily rainfall phenomenon (Indarto, 2013).
2.2 Watershed Characteristics
its downstream is marked as control point which could be a hydrometric station (Sri Harto, 2000).
2.3 Flood Management
Flood control could be conducted with two approaches, which is the structural approach and non-structural approach (Kodoatie & Sjarief, 2010). The structural approach is usually conducted by introducing infrastructures (e.g. diversion works, dams, floodway, etc) to protect the flood-prone area from damage due to overflowing. The non-structural method is conducted by introducing various activities such as watershed management, land use regulation, flood early warning system, law enforcement and capacity building.
3 THEORETICAL BASIS
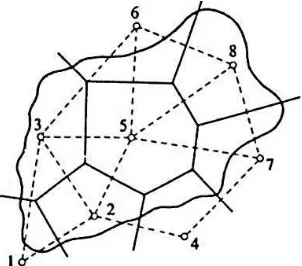
3.1 Thiessen Polygon Method of Watershed Rainfall
The Thiessen Polygon method is conducted by estimating a coefficient as the weight factor of each rainfall station which is assumed to be representing each surrounding area (Figure 1).
Figure 1. Example of a watershed Polygon Thiessen
depth of each station, α is the Thiessen coefficient, Li is the area size of each polygon, and L is the total area size of the watershed.3.2 Rainfall Distribution Pattern
Rainfall distribution pattern could be determined by using analysis of automatic rainfall event based on the graphs of relation between time and rainfall depth (precipitation profile) and the hypothetic rainfall distribution model. The hypothetic rainfall distribution model is developed for area that does not have automatic rainfall data and only have rainfall data (Chow, et al., 1988).
3.3 Gama I Synthetic Unit Hydrograph
In this research, the hydrograph calculation used the Gama I Synthetic Unit Hydrograph. This method was developed based on the hydrologic characteristics of 30 watersheds in Java (Sri Harto, 2000). Therefore, this method is appropriate to be applied in research area that is located in Java.
3.4 Land Use Impact
The change in land use may affect not only the surface runoff but also the base flow. The surface runoff is a function of runoff coefficient commonly described as Curved Number (CN). The composite CN is determined through Equation (3) as follows;
CNcomposite=
where the CNcomposite is the composite curved number,
CN1 is the curved number of land use type 1, A1 is area of land use type 1, Atotal is the total area of the entire watershed, and n is the number of land use type. The CN is determined based on the watershed characteristics, such as the soil hydrological type, land use and land management, cover crop condition, and the antecedent moisture condition (Ponce, 1989).
4 HYDROLOGY AND HYDRAULIC ANALYSIS
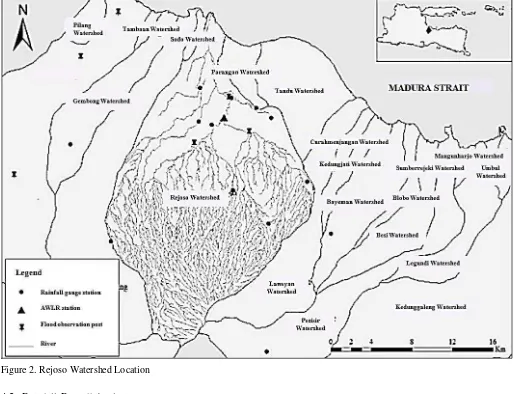
4.1 Rejoso Watershed Location
Rejoso River has the watershed with 360 km2 area and 13,553 km length. The river originates from Bromo Volcano, East Java Province, Indonesia (see
Figure 2. Rejoso Watershed Location 4.2 Rainfall-Runoff Analysis
The analysis of catchment rainfall was conducted using Thiessen Polygon Method based on daily rainfall data obtained from 14 manual rainfall stations. The Rejoso Watershed does not have hourly rainfall data, therefore the hourly rainfall distribution pattern was determined by using the rainfall distribution from automatic rainfall station of Dawuhan Sengon.
The Gama I Synthetic Unit Hydrograph method was used to determine the discharge hydrograph. At a certain rainfall distribution and watershed parameters, the hydrology simulation was then carried out and the resulted discharge hydrograph was examined and compared with the observed one.
4.3 Hydrology and Hydraulic Modelling
In order to obtain watershed parameters, hydrological modeling utilizing the HEC-HMS Version 4.1 was carried out. The hydraulic analysis was carried out utilizing the HEC-RAS 5.0.3 software. The sketch of the hydrology and the hydraulic modeling is shown in
Figure 3. Sketch of hydrological and hydraulic modelling 5 RESULTS AND DISCUSSION
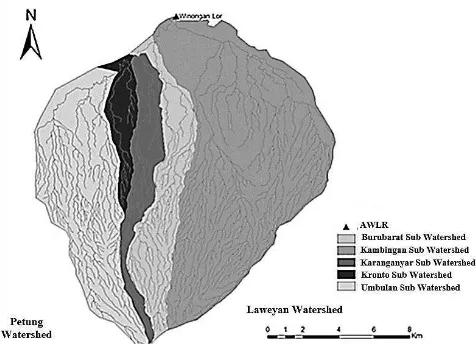
5.1 Sub-watershed Boundaries
Figure 4. Sub-watersheds of Rejoso Watershed
The maximum daily rainfall in each sub-watershed is presented in Table 1. Further analysis of the maximum daily rainfall in all sub-watersheds applying Polygon Thiessen Method yielded the design rainfall for various return periods (see Table 2).
Table1. Maximum daily rainfall of each sub-watershed
Year
Table 2. Maximum daily rainfall at each sub watershed Return
The rainfall distribution pattern was determined based on the hourly rainfall obtained from the automatic rainfall gauge of Dawuhan Sengon (Figure 5).
Figure 5. Rainfall distribution curve based on the event probability
5.2 CN and Gama I Synthetic Unit Hydrograph
The determination of the CN was conducted to obtain the hourly effective rainfall. The data used were the land use map and the soil type map which was overlaid with the Arc-GIS software. The CN, potential maximum retention (S), and Initial abstraction (Ia) value of each sub-watershed are presented in Table 3, while the Gama I Synthetic Unit Hydrograph of each watershed can be seen in Figure 6.
Table 3. CN value of each sub-watershed Sub
5.3 Flood Hydrograph
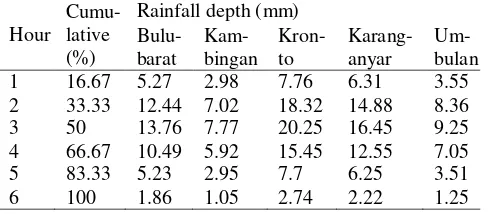
Flood hydrograph was analyzed by considering rainfall distribution pattern. There were six variations of rainfall distribution pattern used in further analysis of flood hydrograph (see Table 4). Rainfall duration and hourly rainfall distribution for each variation are presented in Table 5, Table 6, and Table 7.
Table 4.Variation of the rainfall-runoff simulation Variation Duration (hour) Hourly rainfall distribution
1 6 Uniform
Table 5. Rainfall distribution for variation 1 and 2 Hour Table 6. Rainfall distribution for variation 3 and 4 Hour Table 7. Rainfall distribution for variation 5 and 6 Hour
5.4 Hydrology Model Calibration
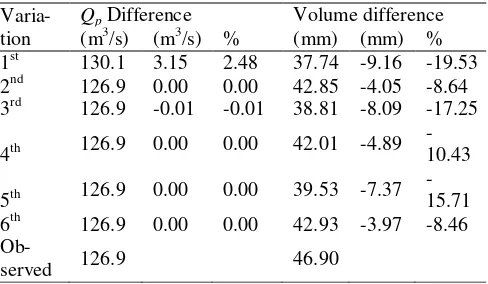
The calibration of hydrology model was conducted in order to obtain optimum watershed parameters in such the simulated hydrograph is close to the observed Table 8. It was found from the simulation results that the results the peak and volume hydrographs performed some discrepancies compared with those performed by the observed hydrograph (see Figure 7).
Figure 7. The simulated hydrograph of various cases Table 8. Peak discharge and runoff volume comparison
Figure 8. Discharge calibration result of various cases Table 9. Discharge calibration result of various cases
Varia-tion
Qp Difference Volume difference (m3/s) (m3/s) % (mm) (mm) % Table 10. Component of watershed parameter calibration
Element Parameter Unit Value
Sub Watershed Bulubarat CN 88.64
Sub Watershed Bulubarat Ia mm 6.51
Sub Watershed Kambingan CN 87.55
Sub Watershed Kambingan Ia mm 7.23
Sub Watershed Karanganyar CN 89.43
Sub Watershed Karanganyar Ia mm 6.01
Sub Watershed Kronto CN 89.55
Sub Watershed Kronto Ia mm 5.93
Sub Watershed Umbulan CN 90.67
Sub Watershed Umbulan Ia mm 5.23
Reach Bulubarat-Kambingan tg minute 52.50
Reach Karanganyar-Bulubarat tg minute 24.60
Reach Kronto-Karanganyar tg minute 9.50
Reach Umbulan-Kronto tg minute 29.50
5.5 Hydrology Model Verification
The model parameter calibration result of October 11th 2016 was then verified with another pair of rainfall and discharge data, which was the flood event on January 31st 2015. The Variation 4 results showed that the difference with the observed was generally 10%, and it was considered that the characteristic of Variation 4 is having considerably high similarity with the Rejoso Watershed. Therefore, the acceptable verification for October 11th 2016 flood calibration is Variation 4 (see Figure 9 and Table 11).
Figure 9. Discharge verification result for various cases Table11 Discharge simulation result for various cases
Varia-tion
Qp Difference Volume difference (m3/s) (m3/s) % (mm) (mm) % 5.6 Rainfall Variability and Flood Hydrograph
Results of the rainfall distribution analysis in the form of discharge hydrograph as seen in Figure 10 and Table 11 indicate that the most suitable rainfall distribution pattern was the Variation 4 with 8 hours duration pattern. This rainfall distribution pattern was then used for further analysis of flood hydrograph. The results of the aforesaid analysis in the form of flood hydrograph for various return periods are shown in Figure 10.
Figure 10. Design flood hydrograph for various return periods
5.7 Hydraulic Flood Routing
downstream boundary condition used the tidal data, and lateral inflows. The lateral inflows taken into account in the simulation were those produced by the several sub-watershed, i.e. Bandilan, Sumbermade, Pelembon and Kasuran Sub-watersheds (see Figure 4).
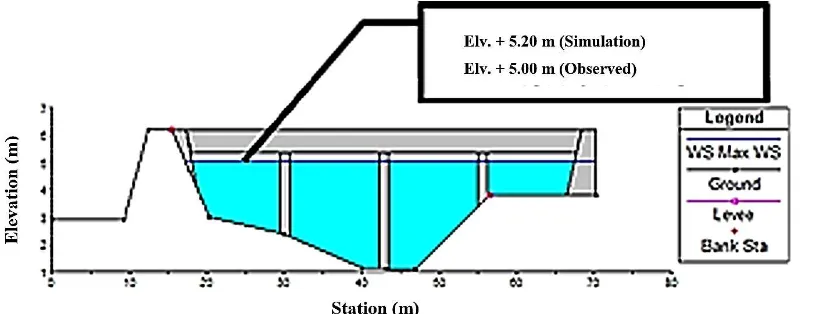
Hydraulic model simulation of flood event on October 11th 2016 was conducted to analyze whether or not the hydrograph that obtained from the simulation was having similarity with the observed hydrograph. It was found that the water level at flood event on October 11th 2016 was on +5.00 m of elevation on
Nasional Bridge (Figure 13) and +6.43 m on Magersari Bridge (Figure 14). The hydraulic model simulation result of flood event on October 11th 2016 is shown in Figure 12 and Table 12. Further simulation with various n-Manning values showed that the n-Manning of 0.025-0.030 was found to be justifiable. Figure 12 shows that almost the entire length of Rejoso River flow experienced overflowing due to insufficient river flow capacity (see Figure 11, 12 and 13).
Figure 11. Water Surface Elevation at Nasional Bridge
Figure 12. Water Surface Elevation at Magersari Bridge
5.8 Flood Countermeasures
Based on previous discussion results, the dominant factor that causes flood on Rejoso River is the inability of the river to convey the flow with 2 years return period with peak discharge of 201,46 m3/s. The flood countermeasure efforts could be structurally or non-structurally conducted. The structural countermeasures may be performed as the follows (Dhari, 2017):
a) Increasing the river flow capacity by means of normalization,
b) Protecting the prone area by means of raising the river embankments or dikes,
c) Building the retarding basin as a water storage area during the flood period.
For the sake of the economic or financial affordability, structural (short term) countermeasure
of Rejoso River is then addressed at mitigating the impacts due to 2 years return period of flood.
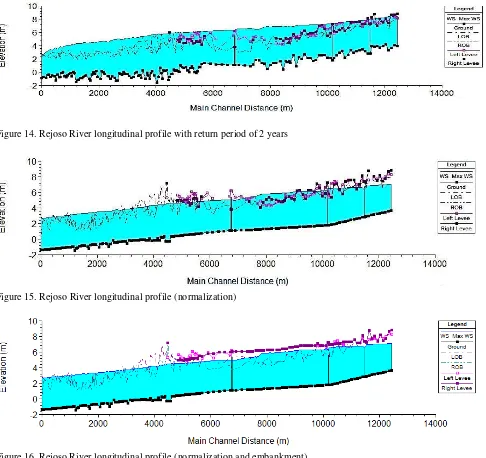
Several scenarios of hydraulic simulation were then carried out based on several schemes those were made based on the two different flow hydrographs and three different Rejoso River conditions. The two different flow hydrographs were the flood occurrence in October 11th 2016 and flood with 2 years return period. The river conditions were the existing condition, the condition with normalization, and the condition where normalization and embankment were applied. The results of the simulation in the form of longitudinal profile of maximum water level for the 2 years return period of flood hydrograph and three different conditions are shown in Table 12 and in Figure 14, 15 and 16 for the existing, the normalization and normalization plus embankment respectively.
Figure 14. Rejoso River longitudinal profile with return period of 2 years
Figure 15. Rejoso River longitudinal profile (normalization)
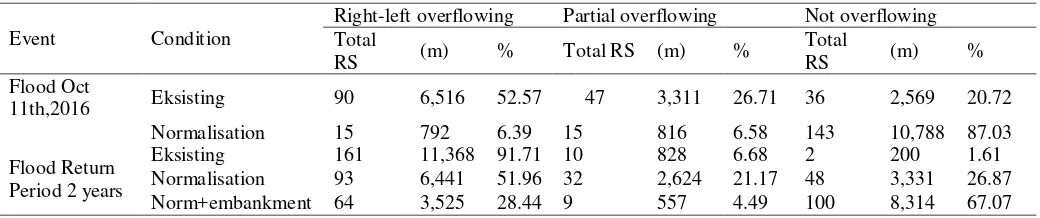
Table 12. Overflowing along Rejoso River at various conditions at 2 years return period of flood Event Condition
Right-left overflowing Partial overflowing Not overflowing Total
Some conclusions and recommendations are forwarded as follows;
1) The rainfall distribution at the Rejoso Watershed varied considerably and was found obvious to affect considerably to the performance of the discharge hydrograph at the downstream control points.
2) The peak discharge at Winongan Lor AWLR with shorter rain duration was higher, compared to the peak discharge with longer rain duration.
3) The hydraulic routing of the 2 years of return period of flood hydrograph (with 201.46 m3/s peak) showed that overflowing’s take place at several locations along the river from Winongan Lor AWLR to the estuary.
4) Flood control through normalization could reduce length of the river reach from overflowing up to 4,927 m; while the combination of normalization and embankment could reduce the above overflowing up to 7,843 m.
5) Reliability on hydrology and hydraulic modeling are highly dependent on the quality of calibration and verification of the model. The presence of reliable rainfall and runoff data are therefore considered essential. The only automatic rainfall observation (ARR) at Dawuhan Sengon Station and runoff observation (ARR) at Winongan Lor are considered insufficient. Some additional installation of the ARR and AWLR monitoring Accuracy of Tropical Multisatelillite Precipitation
Analysis 3B42 Precipitation Data in Mid-High Latitudes of China. Plos One, Volume DOI:10.1371/journal.pone.0120026, pp. 1-22.
Chow, V. T., Maidment, D. R. & Mays, L. W., 1988.
Applied Hydrology. USA: McGraw-Hill, Inc.
Dhari, ICW., 2017.
Analisa Pengaruh Variabilitas
Hujan Terhadap Limpasan Permukaan Pada
Daerah Aliran Sungai Rejoso Kabupaten
Pasuruan [Analysis of Rainfall Variability Effect
on SUrface Runoff in Rejoso Watershed,
Pasuruan Regency]
, Yogyakarta: Master Theis, Department of Civil and Environmental Engineering, Faculty of Engineering, Universitas Gadjah Mada.Indarto, 2013. Variabilitas Spasial Hujan Harian di Jawa Timur. Jurnal Teknik Sipil, 20(2), pp. 107-120.
Juaeni, I., 2006. Analisis Variabilitas Curah Hujan Wilayah Indonesia Berdasarkan Pengamatan Tahun 1975-2004. Jurnal Matematika, Vol. 9(2), pp. 171-180.
Kodoatie, R. J. & Sjarief, R., 2010. Tata Ruang Air.
Yogyakarta: Andi Offset.
Konsulindo, PT. Innako Internasional, 2012. Survey Investigasi Dan Desain Pengendalian Banjir Kali Rejoso. Surabaya: Balai Besar Wilayah Sungai Brantas.
Ponce, V. M., 1989. Engineering Hydrology Principles And Practices. New Jersey: Prentice-Hall.
Setiawan, H., 2014. ilmuhutan.com. [Online] Available at: http://ilmuhutan.com/efekglobal-warmingkhususnyaterhadapperubahaniklim/
[Accessed 21 Juni 2017].