Multi-Disaster Risk Analysis of Klaten Regency, Central Java, Indonesia
Candra Dian Lukita Tauhid
Agency of Public Works of Cirebon Regency, INDONESIA [email protected]
Teuku Faisal Fathani
Center for Disaster Mitigation and Technological Innovation (GAMA-InaTEK), Department of Civil and Environmental Engineering, Faculty of Engineering, Universitas Gadjah Mada, Yogyakarta, INDONESIA
Djoko Legono
Department of Civil and Environmental Engineering, Faculty of Engineering, Universitas Gadjah Mada, Yogyakarta, INDONESIA
ABSTRACT
Klaten Regency is located in Central Java Province, Indonesia, ranked as 19th most susceptible area in Indonesia. Among of
many disasters those take place in Klaten are floods, landslides, and earthquake, which cause damages and loss of lives. Unfortunately, some areas in Klaten Regency are also very vulnerable to the disasters that often contribute severe damage and loss. This paper presents result of risk analysis due to floods, landslides and earthquake disaster at Klaten Regency. Several parameters or criteria are utilized to describe the level of the disaster intensities. The flood susceptibility parameters are the Topographic Wet Index (TWI), Normalized Difference Vegetation Index (NDVI), permeability and roughness, as proposed by Kafira, et al. (2015). The landslide susceptibility are the geology, slope, elevation, distance from fault, distance from rivers, rainfall and land use, as suggested by Thearith (2009) whereas the earthquake susceptibility was referred to FEMA P-154 by using the Ss and S1. The vulnerability and risk analysis are carried out by referring to the parameters as stipulated by the Chief
Regulation of the National Board of Disaster Management No.2 Year 2012 (PerkaBadan Nasional Penanggulangan Bencana- BNPB), concerning the parameters being used for the vulnerability analysis, i.e. population density, poverty ratio, land use, and level of Gross Regional Domestic Product. Further spatial analysis of the risk performs the multi-disaster risk map as a combination between the floods, landslides and earthquake disaster risk in Klaten Regency. The established multi-disaster risk map shows the risk level in the Klaten Regency, i.e., 16.31% at very low risk, 33.01% at low risk, 34.49% at medium risk, at 14.22% high risk and 1.97% at very high risk.
Keyword: Susceptibility, vulnerability, multi-disaster risk, national regulations
1 GENERAL DESCRIPTION
1.1 Background
Klaten Regency is located in the southern area of Java Island and considered very vulnerable to disasters such as floods, landslides, earthquake, volcanic eruption and draughts. Based on the Indonesian Disaster Risk Index, Klaten Regency is ranked as 19th of most susceptible area in the country with risk index of 106 or high category (National Board for Disaster Management, 2011). The 5.9 magnitude of tectonic earthquake on 27 May 2006 has caused 29,989 houses collapsed and 69,984 houses were heavily damage. The loss as caused by flood occurrence in 2014 was approximately IDR 262,000,000, whereas from landslide occurrence in the same year was approximately IDR 424,000,000 (National Board for Disaster Management, 2015). The high intensity of disaster susceptibility and
vulnerability of some area in the Klaten Regency has made the authority to realize the necessity of providing disaster risk information system for the whole regency. Among of many types of disasters those may take place in Klaten Regency, the floods, landslides and earthquake disasters are considered in the multi-disaster risk analysis.
1.2 Susceptibility, Vulnerability, and Risk
susceptibility sub-class parameter at�.The vulnerability is a characteristic of a group or individual situation that affect their capacity to anticipate, cope with, resist, and recover from the impact of natural disaster hazard (Blaikie, et al., 1994). The equation that is used to analyse vulnerability level of disaster is explained in Equation (2) as follows.
vulnerability sub-class parameter at �.Based on the National Board for Disaster Management
(Badan Nasional Penanggulangan Bencana, BNPB)
Chief Regulations No.4 Year 2008 (National Board for Disaster Management, 2008), disaster risk is loss potency that induced by disaster on an area and time period in the form of death, injury, illness, threatened lives, the loss of sense of security, evacuation, wealth damage or loss, and disruption of community activity. In determining the hazard risk level zone, the susceptibility map and vulnerability map were established utilizing Equation (3) as suggested by Sopheap (2007).
2.1 Flood Susceptibility Parameters
Flood is a phenomenon of increasing water discharge that occur in the river, if the water discharge increases but the river capacity could not convey the discharge, the river water would overflow out from the river (Juandi, 2007). The new technology availability in measuring the surface height (such as the Global Positioning Systems/GPS, Synthetic Aperture Radar/SAR, and radar) has helped in providing the topographical data in high resolution (Manfreda, et al., 2011). By the increasing Digital Elevation Model (DEM) data availability, there has been strong suggestion to develop hydro geomorphology model that based on DEM (Nardi, et al., 2006; Samela, et al., 2016). The Topographic Wet Index (TWI), Normalized
Difference Vegetation Index (NDVI), permeability and
roughness are parameters for describing the flood susceptibility (see Table 1). The TWI was the derived data from DEM in the steady condition, and used the accumulation function of flow and slope (Moore, et al., 1993 in Yang, et al., 2005). Topography is an important factor in determining the spatial pattern of saturated areas, as the key to understand soil diversity and the hydrology process the watershed has went through. The
TWI has been widely used in determining the wetness in the watershed, by assuming that the surface water level height comply its surface gradient (Grabs, et al., 2009).
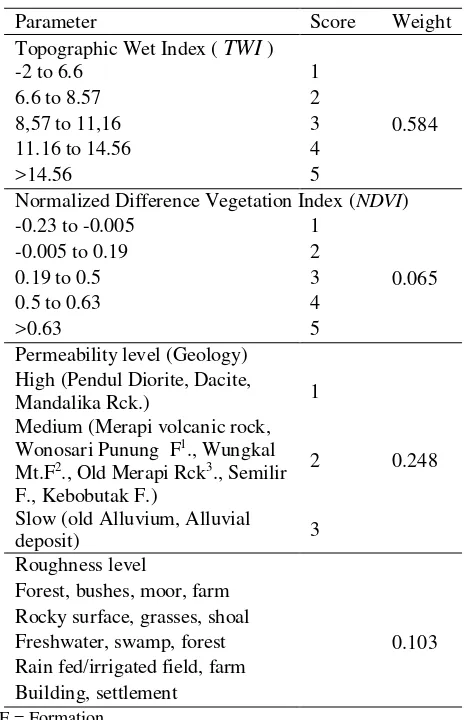
Table 1. Score and weight of flood susceptibility
1F = Formation
2Mt. F = Mountain Formation 3Rck = Rocks
The TWI equation was developed by Beven and Kirkby (1979) on Equation (4).
where is slope, and is the flow accumulation on the upslope.
Parameter Score Weight
Topographic Wet Index ( TWI )
Normalized Difference Vegetation Index (NDVI)
-0.23 to -0.005 1 High (Pendul Diorite, Dacite,
Mandalika Rck.) 1
0.248 Medium (Merapi volcanic rock,
Wonosari Punung F1., Wungkal
Mt.F2., Old Merapi Rck3., Semilir
F., Kebobutak F.)
2 Slow (old Alluvium, Alluvial
deposit) 3
Roughness level
Forest, bushes, moor, farm
0.103 Rocky surface, grasses, shoal
The vegetation density condition, surface moisture, and the object brightness recorded in the image could be identified from the digital interpretation of the remote sensing image data of Landsat 8 (Jamil, 2013). The
NDVI is image calculation used to find the best
greenness level of vegetation area. The NDVI is a mathematical combination of red band and NIR
(Near-Infrared Radiation) band which has been long used as
the indicator of vegetation condition and existence (Lillesand & Kiefer, 1993) on the Equation (5).Image used in this study was the Landsat 8 image on June 22, 2016 that was downloaded from USGS.
d
Another important factor other than topography that affects the flood susceptibility is permeability of soil/rock arrangement of the area based on its composition (Kafira , et al., 2015). The permeability is a measure of ease of the water to move, depend on the pores size of the rock/soil density and types (Widiyatmoko, et al., 2015).
2.2 Landslides Susceptibility
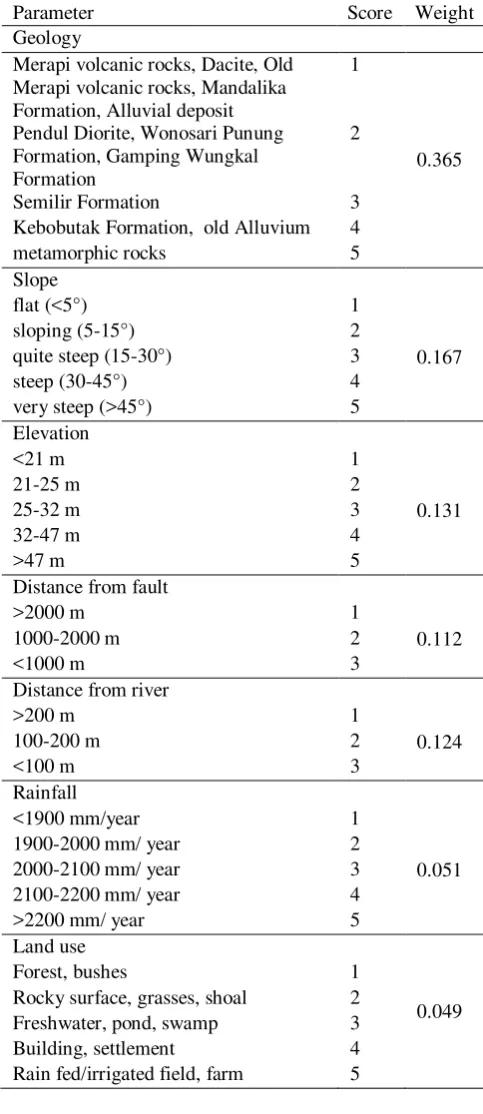
Landslide susceptibility is a function of slope, geology, elevation, distance from fault, distance from river, rainfall, and land use as shown in Table 2 (Kafira , et al., 2015). According to Foumelis, et al (2015), one of the most influential factors in determining landslide susceptibility is slopes, which gives direct effect to the shear stress in an unconsolidated soil, and indirectly influence the surface water velocity or the saturation degree. Slope parameter is often used in preparation of landslide susceptibility map because it is directly related to the slope stability (Pratiwi, et al., 2016; Khodadad & Dong-Ho, 2015; Mouchel, 2013; Pourghasemi, et al., 2012; Gemitzi, et al., 2011, Thearith, 2009; Sopheap, 2007; Foumelis, et al., 2004; Koukis & Ziourkas, 1994). The land elevation influences landslide occurrence, in which the land with high elevation usually consists of cohesive formation such as limestone, where high rainfall may trigger the landslide occurrence (Kouli, et al., 2010). Land elevation is an inducing factor of landslide, for it may control some geological and geomorphological processes (Gritzner, 2001).
Table 2. Score and weight of landslide susceptibility
It is mentioned that the probability of landslide occurrence increases with distance proximity from fault, which affects not only the rock material structure, but also the permeability of the land and furthermore contributes slope instability (Kanungo, 2006). The distance proximity from river or drainage channel is an important factor in controlling the landslide (Gokceoglu and Aksoy in Foumelis, et al., 2004). This is because the change in soil formation which is caused by the erosion may lead to landslide, similarly that of
Parameter Score Weight
Geology
Merapi volcanic rocks, Dacite, Old Merapi volcanic rocks, Mandalika Formation, Alluvial deposit
1
0.365 Pendul Diorite, Wonosari Punung
Formation, Gamping Wungkal Formation
2
Semilir Formation 3
Kebobutak Formation, old Alluvium 4
metamorphic rocks 5
Slope Rocky surface, grasses, shoal 2
Freshwater, pond, swamp 3
Building, settlement 4
the high infiltration level in the slope adjacent to the river. Rainfall become a consideration in determining the landslide susceptibility because rain makes the rock/soil condition to be more saturated, which potentially lead to landslide (Khodadad & Dong-Ho, 2015). The land utilization is a human activity-related factor that influences the landslide occurrence (Gemitzi, et al., 2011). The land utilization may also be a triggering factor for the landslide occurrence (Montgomery, et al., 2000), particularly the woody vegetation where strong and big root may influence the slope stability.
2.3 Earthquake Susceptibility
Earthquake is vibrations that detected from the earth surface which is a result from seismic waves caused by sudden release of the energy that sourced from inside the earth (Hunt, 2007). The susceptibility level of earthquake is assumed to be uniform, in case of Klaten Regency is on the moderate level of Peak Ground Acceleration (PGA) at 0.25 to 0.70g (National Board for Disaster Management, 2012). This study referred to the FEMA P-154 (FEMA, 2015) with parameter SS and
S1 as shown in Table 3.
Table 3. Score and weight of earthquake susceptibility
Earthquake-There are two important parameters in earthquake consideration, i.e. the SS and S1 parameters that are
determined based on response spectrum velocity of 0.2 second and 1 second in the seismic ground motion with 2% probability of exceedance (Badan Standardisasi Nasional, 2012). Values of SS and S1 are calculated
based on the attenuation function or ground motion prediction equations which are considered appropriate in describing the seismicity zone. The SS and S1
response spectrum velocity values are obtained by entering the coordinate point to the Research and Settlement Development Centre of Ministry of the Public Works (Ministry of Public Works and Housing, 2011)
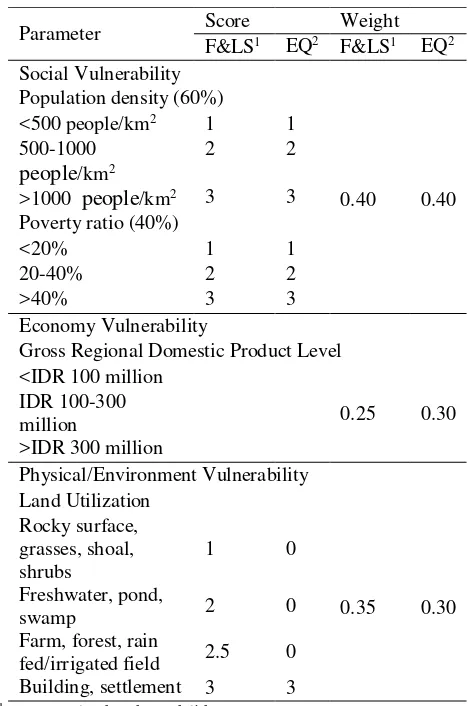
2.4 Multi-disaster Vulnerability
The vulnerability is divided into two categories, i.e. the earthquake, and flood and landslide. Rainfall is the important triggering factor affecting the flood and
landslide occurrence (Tauhid, 2017). Therefore, the vulnerability weights for flood and landslide are assumed to be similar (see Table 4).
Table 4. Score and weight of multi-disaster vulnerability.
1F&LS = Flood and Landslide 2EQ = Earthquake
2.5 Multi-disaster Risk
The multi-disaster risk determines all risks from several hazards by considering the interaction between hazard probability and vulnerability which involve multi-hazard and multi-vulnerability (Carpignano, et al., 2009 in Gallina, et al., 2015). The development of multi-disaster risk map should be derived from the calculation of risk indexes of all threats as shown in Table 5 (National Board for Disaster Management, 2012). It is seen from Table 5 that the flood, landslide, and earthquake have the same weight, of 0.1064.
The weights of flood, landslide, and earthquake used simple mathematical calculation as shown in Equation (6). The weights were 0.35 for flood and landslide, and 0.30 for earthquake.
Table 5. Multi-threat Weight (National Board for Disaster
4 Building and Settlement Fires 0.0638
5 Draught 0.0638
6 Extreme weather 0.0638
7 Landslide 0.1064
8 Volcano eruption 0.1064
9 Abrasion and extreme waves 0.0638
10 Land and forest fire 0.0638
11 Technology failure 0.0638
12 Social conflict 0.0638
13 Epidemic and disease outbreaks 0.0638
3 RESULTS AND DISCUSSION
3.1 Flood Disaster Susceptibility
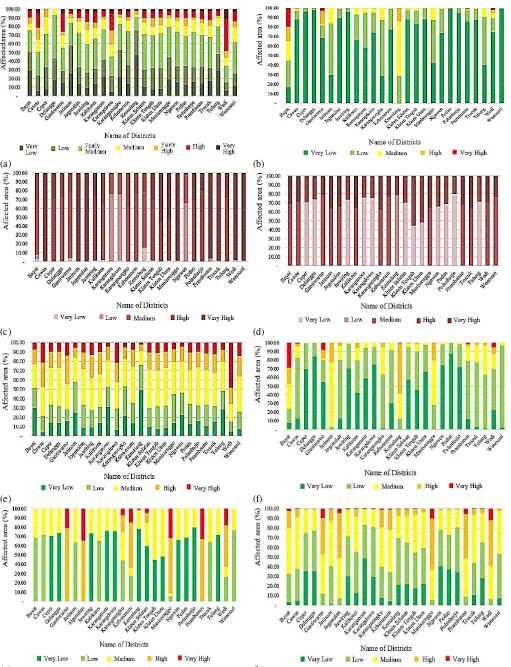
The combination result of each flood susceptibility parameter with Equation (1) and its classification seven categories according to Natural Breaks (Jenks) method is shown in Appendix 1. At least 5% of the area within each district is affected by high susceptibility on flood disaster (see Figure 1(a)). It can be seen from Figure 1(a) that several districts, i.e. Wedi, Cawas, Trucuk, Gantiwarno, and Karangdowo, are laid on the high and very high susceptibility. This is considered common since these districts are located along the river branch where the slope is very mild.
3.2 Landslide Disaster Susceptibility
Classification that resulted from the combination between the landslide susceptibility parameters five parameters of Natural Breaks (Thearith, 2009) method and Equation (1) shown in Figure 1(b) Appendix 2 performed a sensible classification. Chalkias , et al. (2014) has evaluated the landslide susceptibility classification method, and stated that among the methods, the Natural Breaks (Jenks) is the most effective method. Based on the event data from National Board for Disaster Managemen (2015), most of the location of the event were in medium, high, and very high susceptibility, mostly found in districts of Bayat, Kemalang, Wedi, and Gantiwarno, with weak geological condition and slope condition of >15. A comparison between Thearith (2009) and Indonesian regulation is presented in Table 6.
The method as proposed by National Board for Disaster Management did not explain the mapping
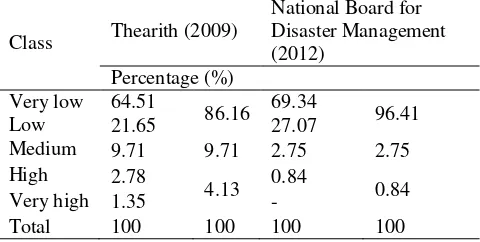
techniques since it utilized the seismic ground hazard map from the National Geology Agency of Ministry of Energy and Mineral Resources. The landslide susceptibility map according to National Board for Disaster Management (2012) is shown in Appendix 3. Table 7 shows a comparison between the method from Thearith (2009) and National Board for Disaster Management (2012). There are significant differences between each class of the two methods. This may be caused by the condition that the data was very limited (only 2014 and 2015).
Table 6. Comparison on landslide susceptibility classification based on National Board for Disaster Management (2012) and Thearith (2009)
Chief Regulation of National Board for Disaster Management No. 2 Year 2012
Seismic
Landslide class classification (3 classes)
Low Medium High
Landslide class classification (5 classes) Very
Low Low Medium High
Very high Susceptibility Index Classification with Natural Breaks (Jenks)
<1.4
1.4-1.6 1.6-1.9 1.9-2.2 >2.2
Table 7. Comparison on classification of landslide affected area from Thearith (2009) and National Board for Disaster Management (2012)
Class Thearith (2009)
(a) (b)
(c) (d)
(e) (f)
(g) (h)
3.3 Earthquake Disaster Susceptibility
The points with highest SS and S1 were located in the
Cucukan Village, Prambanan District; with each consecutively were 1.426 and 0.524. Meanwhile the points with lowest SS and S1 which were 0.772 and
0.321, took place in the Sidoharjo Village, Polanharjo District. The mapping result that was based on the SS
and S1 (FEMA P-154) are shown in Appendix 4. It can
be seen from Figure 1(d) that the most severe damage due to the earthquake in May 27th, 2006 took place at
the districts of Prambanan, Gantiwarno, Jogonalan, and Wedi; which was included in the high susceptibility class. The highest number of collapsed house which was 7,292 houses was in the Gantiwarno District, due to its soil condition which was in the soft soil category, where as it caused the amplification of earthquake energy.
3.4 Multi-disaster Vulnerability
The result from combining the parameters of vulnerability map was divided into 5 classes with Natural Breaks referred to National Board for Disaster Management Chief Regulations No. 2 Year 2012. Appendix 5 and 6, and also Figure 1(c) show the affected area (in %) of each district for the flood and landslide vulnerability and for the earthquake vulnerability respectively.
3.5 Flood Risk
The flood risk map in Klaten Regency as shown in Appendix 7 was established from the combination of flood susceptibility (Appendix 1) and multi-disaster vulnerability (Appendix 5) by applying Equation (3). According to Natural Breaks (Jenks) method, the results were classified into five categories, and then the flood risk level in each district is presented in Figure 1(e).
3.6 Landslide Risk
The landslide risk map in Klaten Regency as shown in Appendix 8 was resulted from the combination of landslide susceptibility (Appendix 3) and multi-disaster vulnerability (Appendix 6), applying Equation (3). Same method of Natural Breaks (Jenks) was also utilized, and the risk level of each district is presented in Figure 1(f).
3.7 Earthquake Risk
The earthquake risk map in Klaten Regency as shown in Appendix 9 was resulted from the combination of earthquake susceptibility (Appendix 4) and multi-disaster vulnerability (Appendix 6), applying Equation (3). Figure 1(g) presents the earthquake risk level at each district. It is seen from Figure 1(g) that the riskiest
area took place in Bayat district, which is confirmed with 27 March 2006 earthquake occurrence.
3.8 Multi-disaster Risk
The risk maps of flood, landslide, and earthquake were then combined by utilizing Equation (6), and the multi-disaster risk map was obtained (see Appendix 10). Figure 1(h) shows the affected area (in %) of the multi-disaster risk.
4 CONCLUSIONS AND RECOMMENDATIONS
4.1 Conclusions
The combination of flood risk, landslide risk, and earthquake risk generated a multi-disaster risk map, in which the result was 16.31% has very low risk, 33.01% low risk, 34.49% medium risk, 14.22% high risk, and 1.97% has very high risk. Whereas the very high risk of multi-disaster is found in the districts of Jogonalan, Gantiwarno, Manisrenggo, and Wedi.
4.2 Recommendations
The more detailed descriptions on both susceptibility and vulnerability parameters taking into account the local community perception are still subjects of interests. This is due to the fact that in real practice, the livelihood of the local community may affect the weighting of each parameter and similarly the developed equation. However, such consideration must be initially introduced through some lesson learns those have been took place in the past history.
The susceptibility, vulnerability, multi-disaster risk maps may be dynamics that the frequent update by taking into account the disaster occurrences is advisable.
REFERENCES
Badan Standardisasi Nasional, 2012. SNI 1726-2012 Tata Cara Perencanaan Ketahanan Gempa Untuk Struktur Bangunan Gedung & Non Gedung.
Beven & Kirkby, 1979. A Physically Based Variable Contributing Area Model of Basin Hydrology.
Hydrol.Sci.Bull, Volume 24, pp. 43-69.
Blaikie, P., Cannon, T., Davis, I. & Wisner, B., 1994.
At Risk: Natural Hazards, People’s Vulnerability, and
Disasters. New York: Routledge.
FEMA, 2015. FEMA P-154 Rapid Visual Screening of Buildings for Potential Seismic Hazards : A Handbook.
3rd ed. Washington: FEMA.
Foumelis, M., Lekkas, E. & Parcharidis, I., 2015. Landslide Suscepbility Mapping by GIS-Based Qualitative Weighting Procedure in Corinth Area.
Buletin of the Geological of Greece, Volume XXXVI.
Gallina, V., Torresan, S., Critto, A. & Sperotto, A., 2015. A Review of Multi-Risk Methodologies for Natural Hazards : Consequences and Challenges for a Climate Change Impact Assesment. Journal of
Enviroment Management, pp. 123-132.
Gemitzi, A., Falalakis, G., Eskioglou, P. & Petalas, C., 2011. Evaluating Landslide Suscepbility Using Environmental Factors, Fuzzy Membership Functions and GIS. Global Nest, 13(1), pp. 28-40.
Grabs, T., Seibert, J., Bishop , K. & Laudon, H., 2009. Modeling Spatial Patterns of Saturated Areas: A Comparison of the Topographic. Journal of Hydrology 373 , pp. 15-23.
Hunt, R. E., 2007. Geologic Hazards A Field Guide for
Geotechnical Engineers. New York: McGraw-Hill.
Jamil, D. H., 2013. Deteksi Potensi Kekeringan Berbasis Penginderaan Jauh Dan Sistem Informasi
Geografis Di Kabupaten Klaten, Semarang:
Universitas Semarang.
Juandi, A., 2007. Analisis Perubahan Luas Daerah Genangan Tahun 2001 dan Tahun 2004 Berdasarkan
pada Perubahan Tutupan Lahan dengan
Menggunakan Metoda Rational, Bandung: ITB.
Kafira , V., Albanakis , K. & Oikonomidis , D., 2015. Flood Susceptibility Assessment using G.I.S. An example from Kassandra Peninsula, Halkidiki, Greece.
Geology.
Khodadad, S. & Dong-Ho, . J., 2015. A comparative study of Analytical Hierarchy Process and Ordinary Least Square methods for landslide susceptibility mapping using GIS technology. The Online Journal of
Science and Technology , 5(2).
Koukis, G. & Ziourkas, C., 1994. Slope Movements in
The Greek Teritory : A Statistical Approach. pp.
4621-4628.
Lillesand, T. M. & Kiefer, F. W., 1993. Penginderaan Jauh dan Interpretasi Citra. Alih bahasa : R. Dubahri.
Yogyakarta: UGM Press.
Manfreda, S., Sole, A. & Di Leo, M., 2011. Detection of Flood-Prone Areas Using Digital Elevation Models.
Journal of Hydrologic Engineering, pp. 781-790.
Ministry of Public Works and Housing, 2011. Desain
Spektra Indonesia. [Online]
Available at:
http://puskim.pu.go.id/Aplikasi/desain_spektra_indon esia_2011/
[Accessed 21 Februari 2017].
Montgomery, D. R., Schmidt, K. M., Dictrich, W. E. & Greenberg, H. M., 2000. Forest Clearing and Regional Land Sliding in the Pacific Northwest. Geology,
Volume 28, pp. 311-314.
Mouchel, 2013. Landslide Susceptibility Mapping :
GIS Data Processing Steps Guide, Dublin: Department
of Communication, Energy and Natural Resources.
Nardi, F., Vivoni, E. R. & Grimaldi, S., 2006. Investigating a Floodplain Scaling Relation Using a Hydrogeomorphic Delineation Method. Water Resources Research. Water Resources Research,
42(9). doi: 10.1029/2005WR004155
National Board for Disaster Management, 2008.
Peraturan Kepala Badan Nasional Penanggulangan Bencana Nomor 4 Tahun 2008 Tentang Pedoman
Penyusunan Rencana Penanggulangan Bencana.
National Board for Disaster Management, 2011. Indeks
Risiko Bencana Indonesia (IRBI), Jakarta: BNPB.
National Board for Disaster Management, 2012.
Peraturan Kepala Badan Nasional Penanggulangan Bencana (PERKA BNPB) No. 2 Tahun 2012 Tentang
Pedoman Umum Pengkajian Risiko Bencana.
National Board for Disaster Management, 2015.
http://geospasial.bnpb.go.id. [Online].
Pourghasemi, H. R., Pradhan, B. & Gokceoglu, C., 2012. Landslide Susceptibility Mapping Using a Spatial Multi Criteria Evaluation Model at Haraz Watershed, Iran. In: Terrigenous Mass Movements.
Springer.
Pratiwi, R. D., Nugraha, A. L. & Hani'ah, 2016. Pemetaan Multi Bencana Kota Semarang. Jurnal
Geodesi Undip (5) 4, pp. 122-131.
Regional Board for Disaster Management, 2015.
Historical Data of Hazard in Klaten 2009-2014,
Klaten: Regional Board for Disaster Management.
Flood-Prone Areas at Large Scale. Convegno Nazionale di
Idraulica e Costruzioni Idrauliche, Volume 35.
Sopheap, L., 2007. Landslide Risk Assesment at Piyungan - Patuk Area, Yogyakarta special Province,
Indonesia, Yogyakarta: Universitas Gadjah Mada.
Tauhid, C. D., 2017. Multi Disaster Risk Mapping of
Klaten Regency, Yogyakarta: Master Thesis, Faculty of
Engineering, Universitas Gadjah Mada.
Thearith, Y., 2009. Landslide Risk Mapping using GIS-based Weighted Linear Combination in Kulonprogo Regency, Yogyakarta special Province, Indonesia,
Yogyakarta: Universitas Gadjah Mada.
Westen, V. C., 2005. Landslide Hazard and Risk Assesment. International Institute for Geo-Information Science and Earth Observation (ITC).
Widiyatmoko, W. et al., 2015. Penentuan Zona Kerawanan Banjir Bandang dengan Metode Flash Flood Potential Index (FFPI) di Perbukitan Menoreh Kabupaten Kulonprogo Daerah Istimewa Yogyakarta.
Ikatan Ahli Kebencanaan Indonesia.
Yang, X., Chapman, G. A., Young, M. A. & Gray, J. M., 2005. Using Compound Topographic Index to Delineate Soil Landscape Facets from Digital Elevation Models for Comprehensive Coastal Assessment. New South Wales Department of Natural
Appendix 1. Flood susceptibility map
Appendix 2. Landslide susceptibility map (Thearith, 2009) LEGEND
Jombor Swamp
River
YEAR OF OCCURENCE
REMARKS
Very Low Low Medium High Very High
LEGEND
Jombor Swamp
YEAR OF OCCURENCE
REMARKS
Very Low Medium Moderately High High
Appendix 3. Landslide susceptibility map (BNPB, 2012)
Appendix 4. Earthquake susceptibility map LEGEND
Jombor Swamp
River
REMARKS
Low Medium
High
Sufficiently High
High
Appendix 5. Flood and landslide vulnerability map
Appendix 6. Flood and landslide vulnerability map LEGEND
Jombor Swamp
REMARKS
Very Low Low Medium High Very High
LEGEND
Jombor Swamp
Very Low Low
Medium High Very High
Appendix 7. Flood risk map
Appendix 8. Landslide risk map LEGEND
Jombor Swamp
River
REMARKS
Very Low Low Medium High Very High
Very Low Low Medium High Very High
REMARKS
Jombor Swamp
Appendix 9. Earthquake risk map
Appendix 10. Multi-disaster risk map
Very Low Low Medium High Very High
REMARKS
Jombor Swamp
LEGEND
Very Low Low Medium
High Very High
REMARKS
Jombor Swamp