The impact of central bank transparency
on inflation expectations
Carin van der Cruijsen
a,b,⁎
, Maria Demertzis
a,ba
De Nederlandsche Bank, PO Box 98, 1000 AB, Amsterdam, The Netherlands
b
University of Amsterdam, Amsterdam, The Netherlands
Received 2 August 2005; received in revised form 17 June 2006; accepted 18 August 2006 Available online 17 November 2006
Abstract
We investigate how the link between inflation and inflation expectations alters with increasing transparency. Our motivation stems from the belief that changes in the institutional features or operations of the central bank affect, first and foremost, the way that private agents form their expectations about the future behavior of the central bank and only through them, inflation. To examine the link between inflation and inflation expectations, we apply the framework used by Levin et al. [Levin, A.T., Natalucci, F.M., Piger, J.M., 2004. The macroeconomic effects of inflation targeting. Federal Reserve Bank of St. Louis Review 86, 51–80.] and make use of the recent development of quantitative measures for transparency. We find evidence that transparency helps fixing private sector inflation expectations.
© 2006 Elsevier B.V. All rights reserved.
JEL classification:E31; E52; E58
Keywords:Central bank transparency; Inflation expectations; Monetary policy
1. Introduction
In a study undertaken by Blinder (2000)in which a group of central banks and academic economists were asked to rank those features that help, in their view, build credibility in monetary policy, transparency ranked fourth. Although admittedly not very different in terms of scores, central bank transparency was preceded by,“history of honesty”,“central bank independence” and “history of fighting inflation”. Still, transparency has attracted a significant amount of attention in the past two decades, for the following reasons. First, the literature has been very
www.elsevier.com/locate/ejpe
⁎Corresponding author. Tel.: +31 20 524 1961; fax: +31 20 524 2506.
E-mail address:[email protected](C. van der Cruijsen).
concrete about the benefits of making central banks independent from the government. When central banks began to acquire greater autonomy in setting and pursuing their objectives, there was automatically a greater need for accountability. Reasons of democratic legitimacy thus provided a political economy justification for greater transparency. Second, and this time from the point of view of the central bank, the three features deemed more important than transparency in Blinder's survey do not constitute choice variables for the central bank to act upon; they are either the result of its actions or imposed. In that respect, therefore, to the extent that the central bank wishes to help improve its credibility, the level of transparency is the first of these features it can act upon directly. Finally, the establishment of the European System of Central Banks and the creation of the European Central Bank forced policymakers to reconsider the architecture that would help establish credibility.
Despite extensive discussions on the desirability of central bank transparency1, economic literature does not always arrive at a unique conclusion on this issue. By means of an example, regarding the publication of forecasts produced by central banks,Buiter (1999)andIssing (1999)
argue at opposite ends of the spectrum. Buiter argues in favour of their publication, on grounds of accountability, such that the public can evaluate the quality of monetary policy. Issing on the other hand, argues that to the extent that actual policy decisions are not entirely based on these predictions, their publication may be misleading. Similar‘disputes’arise with reference to the publication of the minutes of meetings (and indeed their timing), or on whether decisions should be accompanied by press conferences.
Although transparency is certainly desirable for reasons of accountability, it is not the sole means to enhancing central bank credibility. Inevitably the merits of transparency can only be justified through empirical validation, enabled by the recent development of explicit indices for central bank transparency.Eijffinger and Geraats (2006)(EG) construct an index for nine major central banks based on the five aspects of central bank transparency identified byGeraats (2000)
and allow for changes in the index for the period 1998–2002. Other attempts to capture various aspects of central bank transparency include those byBini-Smaghi and Gros (2001),Siklos (2002),
Chortareas et al. (2002)andDe Haan et al. (2004). The limited availability of data however, makes the empirical investigation still problematic.Demertzis and Hughes Hallett (in press)calculate correlations between the EG index and the mean and standard deviation of inflation and the output gap and discover that while greater transparency does not affect the averages, it does affect the variability of these magnitudes. While greater transparency is beneficial to inflation, it appears to be detrimental to the output gap (although weak).2Using the same index,Geraats et al. (2006)use a Taylor rule type of set-up and show that greater transparency reduces both the level of the short term interest rate (thus increasing flexibility in monetary policy), as well as the long term interest rate, thus enhancing the authorities' reputation.3
We will argue in this paper that any change in the institutional features or operations of the central bank affects the way private agents form their expectations about future inflation. We thus attempt to check the effect of greater transparency on the way that expectations are formed, directly. We base our analysis on the work byLevin et al. (2004)who examine the impact of inflation targeting on the way that expectations are formed. They argue that if expectations are
1
Inter aliaJensen (2002),Faust and Svensson (2002),Geraats (2002),Demertzis and Hughes Hallett (in press). See alsovan der Cruijsen (2004)for a comprehensive survey.
2 It is worth noting that the authors of the index appreciate themselves how sensitive these corrections are to changes in the measure of transparency (Eijffinger and Geraats, 2004). It is therefore, difficult to draw conclusions about the empirical relevance of transparency based on such indices.
better pinned down in an inflation targeting regime, then the relation between expectations (for difference horizons) and current inflation is weaker. While Levin et al. classify countries in inflation targeters and non-inflation targeters, we use the aforementioned indices to classify countries according to their degree of transparency. The measure for expectations we use is taken from the Consensus Forecasts. We examine whether attempts to increase transparency have accounted for the weaker link between inflation and inflation expectations. In that respect, we are therefore aiming to see how possible gains in central bank credibility are due to efforts undertaken for greater transparency. This does not, however, necessarily imply that transparency is the only way to increase credibility.
The paper is organized as follows. Section 2 describes how inflation, inflation expectations, and central bank transparency have evolved since 1989. Section 3 then examines whether the level of transparency has an impact on the degree of anchoring of inflation expectations to the current level of inflation. Section 4 summarizes our main findings and concludes.
2. Inflation, expectations and transparency
Our analysis is based on the methodology by Levin et al. (2004) in which inflation and inflation expectations are related as follows:
Dk̂q
t ¼aþbDkPtþet ð1Þ
The regressand Dk̂q
t represents the first difference of inflation expectations q years ahead, formed at periodt. The regressor, DkP
t is the first difference of the 3-year moving average of realized CPI inflation, ending at, and including, timet. The argument the authors put forward is that as monetary regime changes help agents form their expectations, the link between inflation and expectations is weakened and the value of β tends to zero, and the more so for longer horizons. This is tested for countries that adopt inflation targeting regimes, while we examine whether this is true for countries with more transparent central banks.
We describe the data for inflation and inflation expectations and how they have changed from 1989 till 2004. To identify the evolution of inflation and inflation expectations we look at both the average, as well as the variability of these variables. In addition, we look at how the degree of transparency of central banks increased since 1998. We plot the way the EG index has changed from 1998 to 2002 for nine (groups of) countries.
2.1. The data
We present data for inflation and its expectations for eight industrialized countries and the Euro area. The countries in question (and their respective central banks) are Australia (RBA), Canada (BoC), the Euro area (ECB), Japan (BoJ), New Zealand (RBNZ), Switzerland (SNB), Sweden (SRB), the UK (BoE) and the US (US Fed). Realized inflation is based on consumer price indices taken from the International Financial Statistics of the International Monetary Fund, (except for the ECB data which is from the OECD), presented in the form of a 3-year moving average. Inflation expectations are taken from the Consensus Economic Forecasts for one, three, five and six-to-ten years ahead, with the exception of the Euro area where the one, two (instead of three) and five years ahead horizons are the quarterly data provided by the ECB itself.4 Consensus
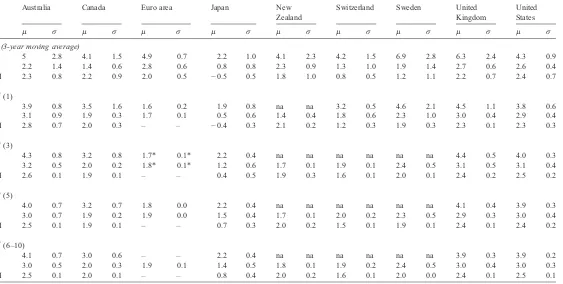
Table 1
The development of inflation and inflation expectations
Australia Canada Euro area Japan New
Zealand
Switzerland Sweden United Kingdom
United States
μ σ μ σ μ σ μ σ μ σ μ σ μ σ μ σ μ σ
π(3-year moving average)
I 5 2.8 4.1 1.5 4.9 0.7 2.2 1.0 4.1 2.3 4.2 1.5 6.9 2.8 6.3 2.4 4.3 0.9
II 2.2 1.4 1.4 0.6 2.8 0.6 0.8 0.8 2.3 0.9 1.3 1.0 1.9 1.4 2.7 0.6 2.6 0.4
III 2.3 0.8 2.2 0.9 2.0 0.5 −0.5 0.5 1.8 1.0 0.8 0.5 1.2 1.1 2.2 0.7 2.4 0.7
πe(1)
I 3.9 0.8 3.5 1.6 1.6 0.2 1.9 0.8 na na 3.2 0.5 4.6 2.1 4.5 1.1 3.8 0.6
II 3.1 0.9 1.9 0.3 1.7 0.1 0.5 0.6 1.4 0.4 1.8 0.6 2.3 1.0 3.0 0.4 2.9 0.4
III 2.8 0.7 2.0 0.3 – – −0.4 0.3 2.1 0.2 1.2 0.3 1.9 0.3 2.3 0.1 2.3 0.3
πe(3)
I 4.3 0.8 3.2 0.8 1.7⁎ 0.1⁎ 2.2 0.4 na na na na na na 4.4 0.5 4.0 0.3
II 3.2 0.5 2.0 0.2 1.8⁎ 0.1⁎ 1.2 0.6 1.7 0.1 1.9 0.1 2.4 0.5 3.1 0.5 3.1 0.4
III 2.6 0.1 1.9 0.1 – – 0.4 0.5 1.9 0.3 1.6 0.1 2.0 0.1 2.4 0.2 2.5 0.2
πe(5)
I 4.0 0.7 3.2 0.7 1.8 0.0 2.2 0.4 na na na na na na 4.1 0.4 3.9 0.3
II 3.0 0.7 1.9 0.2 1.9 0.0 1.5 0.4 1.7 0.1 2.0 0.2 2.3 0.5 2.9 0.3 3.0 0.4
III 2.5 0.1 1.9 0.1 – – 0.7 0.3 2.0 0.2 1.5 0.1 1.9 0.1 2.4 0.1 2.4 0.2
πe(6–10)
I 4.1 0.7 3.0 0.6 – – 2.2 0.4 na na na na na na 3.9 0.3 3.9 0.2
II 3.0 0.5 2.0 0.3 1.9 0.1 1.4 0.5 1.8 0.1 1.9 0.2 2.4 0.5 3.0 0.4 3.0 0.3
III 2.5 0.1 2.0 0.1 – – 0.8 0.4 2.0 0.2 1.6 0.1 2.0 0.0 2.4 0.1 2.5 0.1
Source: IMF, OECD, Consensus Economics and ECB.⁎Two-years ahead.
C.
van
der
Cruijsen,
M.
Demertzis
/
Eur
opean
Journal
of
Politic
al
Economy
23
(2007)
51
–
inflation expectations are measured only twice a year, in April and October. We assume that the April measures represent inflation expectations in the first half of the year while the October measures are representative of inflation expectations during the second part of the year. The data period ranges from the second half of 1989 till the first half of 2004.5
Table 1summarizes the evolution of the data, in terms of the mean (μ) and standard deviation (σ) of the aforementioned variables for three distinct periods. We have split the data in three periods of equal length to help summarize them: period I ranges from the second half of 1989 till the first half of 1994, period II then runs till the first half of 1999, and period III ends at the first half of 2004. Inflation expectations data for the ECB refers to a shorter period and is therefore split in two parts. Period I: 1999S1–2001S2, and period II: 2002S1–2004S1 for the six-to-ten years ahead inflation expectations data and period I: 1999Q1–2001Q4, and period II: 2002Q1– 2004Q4 for the other inflation expectations horizons.
Table 1shows that, as a general trend, both the mean as well as the standard deviation of realized inflation have decreased during the period in question and for all countries. This change in inflation is the largest when comparing the first half of the nineties to the second. Canada and Australia are the only countries which experienced a reversal in the decreasing trend for their mean after the second period.
5See Appendix A for a detailed description of the inflation and inflation expectations data and a comment on the bias that survey data may possibly contain.
The general trend in inflation expectations is in line with that for realized inflation. Both the mean and the variability of inflation expectations decrease throughout the whole period. Canada's experience constitutes again an exception. Its inflation expectations decreased from period I to II, but stabilized thereafter. Interestingly, New Zealand was also faced with slightly increasing expectations across the sample for all horizons, despite it being an inflation targeter, which, generally thought, produces lower expectations.6 The level and variability of inflation expectations in the Euro area have not changed much in the 5-year period examined.
2.2. Central bank transparency
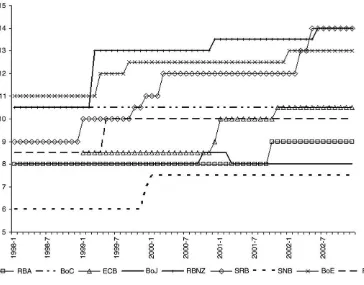
As mentioned earlier, there have been a number of attempts to measure how transparent central banks are. Using the index constructed byEijffinger and Geraats (2004,2006), we show changes in the degree of transparency in the period from 1998 to 2003.Fig. 1provides an overview of the development of the scores for total central bank transparency for the nine banks.7
Most banks have experienced increases in transparency, but they differ both in terms of the specific aspects that they had changed, as well as the timing of these changes. The average score of the nine banks examined increased from 8.9 at the start of the period to 10.7 at the end. Starting in 1998, the BoE was the most transparent central bank with a score of 11 out of 15, closely followed by the BoC and the RBNZ. The SNB had the lowest level of transparency and remained at this position at the end of the sample period, although at a higher absolute level of transparency. The BoC and the BoJ ended at the same level of transparency as they had started with, whereas all other central banks saw their total level of transparency increase, with the RBNZ and the SRB having the highest score of 14 out 15 in 2002. We attempt next to link the level of transparency to the way changes in inflation expectations are linked to changes in realized inflation.
3. Transparency and expectations
We applyLevin et al.'s (2004)methodology in three ways. First, we apply a panel regression in which we group countries according to their degree of transparency. Second, we carry out a country-specific analysis in which we test whether particular instances of changes in transparency have had a significant impact on the relationship between the changes in inflation expectations and the changes in realized inflation. Finally, we re-group the results by Levin et al. on inflation persistence, according to the level of transparency indicated by the EG index.
3.1. Panel analysis
We use panel data to analyze the link between expectations, inflation and central bank transparency.Levin et al. (2004)distinguish between countries based on whether they follow an inflation targeting regime. We argue that the concept of central bank transparency is broader than inflation targeting alone, as the existence of a quantitative target is just one component of the measure. We expect therefore, that more transparent central banks will have a better ability to anchor inflation expectations, thus weakening their relationship with inflation. We investigate
6 This increase is perhaps not surprising given that its target changed from 0
–2% in 1990 to 0–3% in 1997 and 1–3% in 2002. We thank an anonymous referee for pointing this out to us.
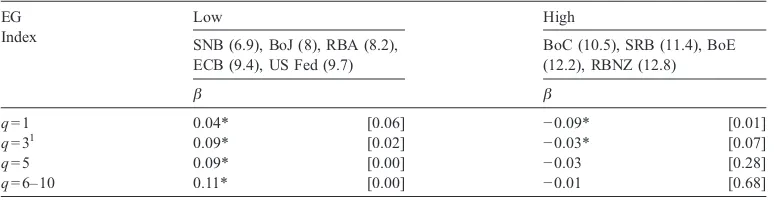
whether this is true by separating countries into two groups of ‘low’and ‘high’transparency, based on the countries' score in various indices. A country that scores higher than two thirds of the maximum score is classified as one of ‘high’transparency, and ‘low’ otherwise. We thus estimate the following panel data equation:
Dk̂q
j;t¼ajþbD
k
P
j;tþej;t ð2Þ
where nowj= (‘high’,‘low’). We expect that the high transparency group will have a lower value for β and that the relationship weakens for longer horizons. We apply the EG index as it constitutes a very comprehensive examination of all central bank characteristics.Table 2gives an overview of the results for the slope parameter and its significance.
The results show that the value of βis positive and significant in all instances for the low transparency groups, which indicates that inflation expectations follow actual inflation. The value ofβis lower for all horizons for the highly transparent group. This is an indication that countries that invest in transparent monetary policy institutions benefit from having better anchored expectations of inflation. We repeat the same exercise for three other transparency indices by
Bini-Smaghi and Gros (2001),Siklos (2002)andDe Haan et al. (2004)as well as experiment with different cut-off values for the splitting of the countries into high and low transparency groups. The results (available on request) support the finding thatβ is higher for the low transparency group. Another result that we can deduce fromTable 2is that the positive relationship between changes in inflation expectations and changes in realized inflation that we found for the low transparency group is weaker for the relatively short inflation expectations horizon. One possible explanation for this observation is that it is likely that relatively short run inflation expectations react more to other factors, e.g. output shocks, than to past inflation. In contrast, longer term inflation expectations are probably based upon information about past inflation performance and
Table 2
Estimates ofβin Eq. (2) based on the EG index
EG
Note:p-values in square brackets.8
1 Two-year ahead inflation for the ECB. *Significant at 10% confidence level.
8
what one expects for the future because shocks are more difficult to predict. We perform next the same analysis for each country individually, examining how (and whether) institutional changes that enhanced transparency during the 90s, have also affected the relationship between inflation and inflation expectations.
3.2. Country-specific analysis
We carry out a country-specific analysis to check whether distinct institutional changes that have contributed to an increase in transparency had a significant impact on the way inflation expectations follow actual inflation. Based on Geraats et al. (2006),Tomljanovich (in press),
Coppel and Connolly (2003),Mishkin and Posen (1997), andHeikensten and Vredin (2002)we take into account all changes that have occurred since 1989, described in detail for the nine central banks in Appendix B. We now perform the following regression:
Dk̂q
t ¼aþbkPtþ
Xn
i¼1
gi;tðDi;t⁎D
kP
tÞ þet ð3Þ
wherenrepresents the number of institutional changes. DummyDitakes the following values:
Di¼ 0 for t¼1
N ki −1 1 for t¼kiN T
and ki is the timing of institutional change i. We drop subscript j for convenience, as the regressions are now performed for the nine central banks individually. For changes that have taken place consecutively in 1 year, we have timed the dummy to coincide with the first, but the term may very well capture a combined effect. We expectγito be negative, so that increases in the
level of transparency weaken the link between inflation and expectations (i.e.βNβ+γi) and thus
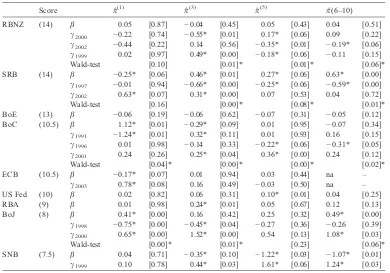
decrease the degree to which inflation expectations are fixed.9We have adopted a general-to-specific approach in the sense that we introduce a dummy for all institutional changes listed in Appendix B to start with, dropping every time the ones that do not have a significant impact at any horizon. The Wald-test (F-test) checks for the joint significance of the dummy variables.Table 3
gives an overview of the results, reporting the significant institutional changes only and showing the dummies with the largest impact on anchoring inflation expectations first.
We first present a number of general comments and then discuss some countries in greater detail. We observe that a number of countries have a positive and significant value forβat some horizons, and therefore a strong link between changes in inflation and changes in inflation expectations. However, some countries appear to have benefited from actions to increase their degree of transparency in the sense that this relationship is reversed by negative and significant γ. Canada has very clearly benefited from introducing a regime of inflation targeting, while Sweden has clearly benefited from other institutional changes. New Zealand was an inflation targeter during the whole period and appears to have had well anchored inflation expectations to start with. The introduction of inflation targeting in the UK at the end of 1992, did not appear to have a significant impact. The UK has an insignificant relationship between changes in inflation expectations and changes in realized inflation, indicating well anchored inflation expectations throughout the whole period.
9 We test for autocorrelation with the Langrange
3.3. Inflation persistence
Levin et al. (2004)also examine whether inflation targeting countries have experienced less inflation persistence. They show that those countries that follow a regime of inflation targeting exhibit lower inflation persistence than the rest. Similarly, we search whether this pattern is also applicable to countries that have higher degrees of transparency. Levin et al. (2004) make a distinction between core CPI, (without food and energy prices), and total CPI and estimate a univariate autoregressive process for inflation in the following form.11
kt¼lþ γ2002 0.63* [0.07] 0.31* [0.00] 0.07 [0.53] 0.04 [0.72]
Wald-test [0.16] [0.00]* [0.08]* [0.01]*
BoE (13) β −0.06 [0.19] −0.06 [0.62] −0.07 [0.31] −0.05 [0.12] BoC (10.5) β 1.12* [0.01] −0.29* [0.09] 0.01 [0.95] −0.07 [0.34] γ1991 −1.24* [0.01] 0.32* [0.11] 0.01 [0.93] 0.16 [0.15] γ1996 0.01 [0.98] −0.14 [0.33] −0.22* [0.06] −0.31* [0.05] γ2001 0.24 [0.26] 0.25* [0.04] 0.36* [0.00] 0.24 [0.12]
Wald-test [0.04]* [0.00]* [0.00]* [0.02]* γ2000 0.65* [0.00] 1.52* [0.00] 0.54 [0.13] 1.08* [0.03]
Wald-test [0.00]* [0.01]* [0.23] [0.06]*
SNB (7.5) β 0.04 [0.71] −0.35* [0.10] −1.22* [0.03] −1.07* [0.01] γ1999 0.10 [0.78] 0.44* [0.03] 1.61* [0.06] 1.24* [0.03]
Source: see Appendix A.10Scores based on the EG 2002 index;p-values in square brackets. Results are based on Newey
–
West standard errors. (1)
Two year ahead inflation. *Significant at 10% confidence level.
10We have added the first lagΔ πˆt
qto solve for autocorrelation in: BoJΔ π
The authors then present two ways of testing for the existence of a unit root.12First, they derive a scalar measure of persistence in the form of the largest autoregressive root,ρ, defined as the largest root of the following characteristic equation.
kk−X
k
j¼1
ajkk−j¼0 ð5Þ
The rational is that this captures the size of the impulse responseAktþj
Aet , asjincreases. Applying Stock's (1991)method, the authors get an estimate for the unbiased median and an upper 95th percentile (the upper bound of a two-sided 90% confidence interval) for the largest autoregressive root, estimated over 1994:Q1–2003:Q2. However, since the largest autoregressive root may be unrepresentative of the dynamics in the series, they consider as an alternative measure, the sum of the autoregressive coefficients,
a¼X
k
j¼1
aj ð6Þ
and by using the“grid bootstrap”technique byHansen (1999), construct the confidence intervals of thet-statistic
t¼ â−a
SEðâÞ ð7Þ
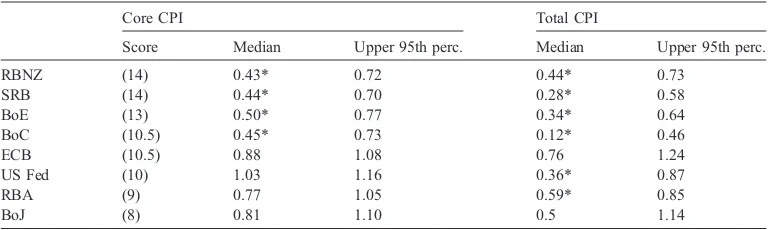
Again they report the unbiased median and the value for the upper 95th percentile estimate. A value less than unity for the latter implies that a unit root can be rejected and therefore, the inflation series is white noise (at the 5% significance level for a one-tailed test). Our expectation is that inflation in countries having transparent central banks will fail to reject white noise processes.Tables 4a and 4bgive an overview of the persistence estimates (for both tests). Note that this table is taken directly fromLevin et al. (2004)13, but countries are rearranged according to the EG 2002 index scores for their central banks, in a descending order of transparency.
The two persistence tests, reported inTables 4a and 4b, produce identical results. We see that for countries that score high in the transparency index the unit root in inflation can be rejected. These countries exhibit lower persistence for both measures of inflation. For the US Fed and Reserve bank of Australia the unit root for total CPI is also rejected. Also it is worth mentioning that although Canada and the Euro area have identical transparency scores at the end of the period
12It is worth noting that for
k= 1 we can re-write Eq. (4) as follows:
kt¼lþakt−1þet
Dkt¼aDkt−1þgt
Parameterαwill not be significant unless inflation is highly persistent. This is not dissimilar to Eq. (1), if one assumes
that the consensus forecast applied is a good proxy for the unbiased forecast ofπtfor the given horizon, and the moving average of inflation captures the same information as the first inflation difference. Both specifications therefore, are designed to test for inflation persistence.
(reported here), the Bank of Canada scores 10.5 on average across the whole sample, whereas the ECB scores 9.4 and will therefore experience greater inflation persistence.
4. Summary and conclusions
Inflation and inflation expectations have followed a declining trend over the past 15 years. At the same time, a number of central banks have made considerable efforts to become more transparent. The rationale behind such attempts was to allow for expectations to be driven by the monetary authorities' commitment to alleviate the effects of shocks, rather than the affected level of inflation itself. In achieving that, the monetary policy authorities' task of cushioning shocks is much facilitated. The question that we have asked in this paper is whether these observations were a coincidence or whether these apparent efforts to increase transparency were, at least in part, responsible for the weakening of the relation between inflation and expectations.
Following the approach byLevin et al. (2004) we have analyzed the relation between the two variables to the changes of the level of transparency in a number of ways. We find that
Table 4a
Persistence of inflation (based onρ)
Core CPI Total CPI
Score Median Upper 95th perc. Median Upper 95th perc.
RBNZ (14) 0.24* 0.60 0.25* 0.61
SRB (14) 0.16* 0.54 0.04* 0.44
BoE (13) 0.33* 0.68 0.06* 0.45
BoC (10.5) 0.27* 0.63 −0.22* 0.21
ECB (10.5) 0.84 1.06 0.87 1.06
US Fed (10) 1.04 1.10 0.54* 0.86
RBA (9) 0.70 1.02 0.47* 0.80
BoJ (8) 0.82 1.05 0.72 1.03
Source:Levin et al. (2004), part of table 3 p.59, based on OECD data.14No information on Switzerland available. *Indicates failure to accept a unit root.
Table 4b
Persistence of inflation (based on∑αj)
Core CPI Total CPI
Score Median Upper 95th perc. Median Upper 95th perc.
RBNZ (14) 0.43* 0.72 0.44* 0.73
SRB (14) 0.44* 0.70 0.28* 0.58
BoE (13) 0.50* 0.77 0.34* 0.64
BoC (10.5) 0.45* 0.73 0.12* 0.46
ECB (10.5) 0.88 1.08 0.76 1.24
US Fed (10) 1.03 1.16 0.36* 0.87
RBA (9) 0.77 1.05 0.59* 0.85
BoJ (8) 0.81 1.10 0.5 1.14
Source:Levin et al. (2004), part of table A2 p.79, based on OECD data. No information on Switzerland available. *Indicates failure to accept a unit root.
those countries that are associated with lower levels of transparency experience a significant, positive link between the two variables. This is not the case for the countries with higher levels of transparency. We also show that higher transparency is associated with less inflation persistence.
Acknowledgements
Views expressed are our own and do not necessarily reflect those of the institutions we are affiliated with. Without wishing to implicate, we would like to thank Lex Hoogduin, Peter van Els, Sylvester Eijffinger, Massimiliano Marcellino, Anthony Richards, Marie Musard-Gies, seminar participants at the DNB, UvA, the Xth Spring Meeting of Young Economists and the NBP Conference on Transparency, and one anonymous referee, for comments and suggestions.
Appendix A. Data
A.1. Inflation expectations
Data restrictions imply that sample periods are not the same for all countries. In what follows we describe the data available in detail.
RBA
πˆ (1, 3, 5 and 6–10): 1991s1–2004s1
Source: Consensus Economics BoC, BoE, US Fed
πˆ (1, 3 and 5): 1989s2–2004s1 (missing 2003s1) πˆ (6–10): 1990s1–2004s1 (missing 2003s1)
Source: Consensus Economics ECB
πˆ (1): 1999q1–2004q4 πˆ (2): 1999q1–2004q4
πˆ (5): 1999q1, 2000q1 and 2001q1–2004q4
Source:www.ecb.int/stats/prices/indic/forecast/html/table_hist_hicp.en.html
πˆ (6–10): 2003s2–2004s1
Source: Consensus Economics BoJ
πˆ (1, 3): 1989s2–2004s1
πˆ (5): 1989s2–2004s1 (missing 2001s1) πˆ (6–10): 1990s1–2004s1 (missing 2001s1)
Source: Consensus Economics RBNZ
πˆ (1, 3, 5 and 6–10): 1995s1–2004s1
Source: Consensus Economics SNB
πˆ (1): 1989s2–2004s1 (missing 2003s1)
πˆ (3, 5 and 6–10): 1998s2–2004s1 (missing 2003s1)
SRB
πˆ (1): 1990s1–2004s1 (missing 2003s1)
πˆ (3, 5 and 6–10): 1995s1–2004s1 (missing 2003s1)
Source: Consensus Economics
Consensus Economics forecast data is the average of the expectations of a group of experts. These forecasts are likely to perform better than the individual forecasts that make the consensus. Although there will be some individuals that perform better, they are difficult to identify a priori and their performance is not the same in each period. Pooling the forecasts deletes various behavior biases.
Batchelor (2001)compares, among other variables, inflation forecasts produced by the IMF and Consensus Economics, during the 90s. He finds that average forecasts were too high in both cases and the longer the forecast horizon the higher this bias. Although the mean absolute forecast error is higher in the Consensus Economics inflation forecasts, the root mean squared error is in all cases lower, which indicates that Consensus Economics forecasts were better suited to avoid large forecast errors. Nevertheless testing for differences in mean square errors, indicates that IMF inflation forecasts are significantly less biased. On the other hand, the Consensus Economics forecasts have a higher information content.
A.2. Inflation
Period: 1989s2–2004s1
RBA
Source:www.rba.gov.au
Quarterly data
BoC, BoJ, SNB, SRB, BoE and US Fed
Source: IMF, International Financial Statistics inflation data Monthly data
RBNZ
Source: IMF, International Financial Statistics inflation data Quarterly data
ECB
Source: OECD, Main Economic Indicators Monthly data
Appendix B. Tranparency changes (since 1989)
B.1. Table B Institutional changes
CB Source Transparency change
RBA 01/1990 C C (2003)
Introduction of announcements for changes to the target cash rate. (Not applied here because it occurred before the inflation expectations data period.)
08/1996 T (2003) Formalization of inflation-targeting framework. 10/2001 G (2006) The model is clarified.
BoC 02/1991 T (2003) Inflation Targets first announced.
07/1994 T (2003) 50 basis point operating band for overnight rate announced. 05/1995 M P
(1997)
Publication of monetary policy report.
02/1996 T (2003) Announcement of Official Overnight Rate target. Press release whenever change in band occurs, including explanation for change.
01/2001 M P (1997)
Policy decision dates are from now on predetermined.
ECB 12/2000 G (2006) The June and December Monthly Bulletin contain conditional inflation and output projections for the medium term.
01/2001 G (2006) Publication of a structural macroeconomic model used for policy analysis.
11/2001 G (2006) All monetary policy meetings of the Governing Council (once a month) are followed by a press conference with an explanation of the policy decision. Previous to that there were two meetings each month of which only half were followed by a press conference.
05/2003 Change in the inflation target from positive below 2% to an inflation rate of below, but close to, 2% over the medium term.
BoJ 04/1998 G (2006), T (2003)
Central Bank granted operational independence through the Bank of Japan Act. Publication of minutes and transcripts of monetary policy meetings and submission of a semi-annual report on monetary policy to the Diet.
10/2000 G (2006) Short term conditional forecasts for inflation and output by the Policy Board are part of the semiannual Outlook and Risk Assessment of the Economy and Prices.
03/2001 G (2006) The main operating target changed from the average uncollateralized overnight call rate (which has been effectively zero since February 12, 1999) to the outstanding balance of the current accounts at the Bank. The latter is a very rough range and the targeted variable shows significant fluctuations within it, but there are no explanations for these control errors. RBNZ 01/1989 T (2003) Adoption of Inflation Targeting, via the Reserve Act of 1989. Operational independence
also granted through the Act. (This change is not used in the regressions because it occurred prior to the inflation expectations data period we have.)
03/1990 M P (1997)
Introduction of Policy Target Agreements. (This change is not used in the regressions because it occurred prior to the inflation expectations data period we have.) 03/1999 G (2006) Explanations of policy changes are provided. In addition, unconditional projections of the
90-day bank bill rate (closely related to the Official Cash Rate) in the quarterly Monetary Policy Statement (policy inclination). Initially, there was opacity about control errors because there was no evaluation of the achievement of the daily settlement cash target. The main operating target changed to the Official Cash Rate, which is almost perfectly controlled.
12/2000 G (2006) Explanations were provided for non-adjustment of the Official Cash Rate.
06/2002 G (2006) The quarterly Monetary Policy Statement is accompanied by data on capacity utilization in Excel spreadsheets on the Website. (precise timing is not known)
SRB 03/1997 H V (2002)
Start of the publication of Inflation forecasts (in the quarterly inflation report).
01/1999 G (2006) Amendments to the Constitution Act and the Sveriges Riksbank Act clarify the Riksbank's institutional independence and main objective.
10/1999 G (2006) The announcement of every policy decision, not only adjustments, is explained. 12/1999 G (2006) Data on many economic variables, including capacity utilization, can be downloaded from
the Riksbank Website.
03/2000 G (2006) Discussion of past inflation forecast errors, macroeconomic transmission disturbances, evaluation of inflation in the last three years (including an account of the contribution of monetary policy) are in the March Inflation Report.
03/2002 G (2006) First time that there was a policy inclination that indicated likely adjustment of interest rates in the near future.
05/2002 G (2006) Clarified who the dissidents are, so that the minutes effectively provide attributed voting records.
SNB 12/1999 G (2006) Price stability defined as an inflation rate of less than 2% per annum. The June and December Quarterly Bulletin and the half-yearly media news conference present an inflation forecast for the next three years. The policy target changes and explanations for control errors are not given anymore in the Annual Report.
01/2000 G (2006) The Bank's independence is preserved with a constitutional amendment. Appendix B (continued)
BoE 10/1992 T (2003) Announcement of an explicit Inflation Target. Minutes of policy meetings released within 6 weeks instead of 30 years.
06/1995 M P (1997)
The target has no longer got an actual range. From then on there is a point target of 2.5%, which has to be met on an ongoing basis.
05/1997 G (2006), T (2003)
Bank of England Act led to operational independence and the immediate disclosure of policy decisions.
06/1998 T (2003) The minutes of Policy Meetings are made public within 15 days.
04/1999 G (2006) Extensive documentation of the policy models and the computer code of the macro econometric model are made available.
08/1999 G (2006) The August inflation report contains a discussion of inflation and output forecasting record of the Monetary Policy Committee.
?/2002 G (2006) Bank of England Website contains time series of important macroeconomic variables (including output gap). (uncertainty about the precise timing, therefore we did not use this change)
Fed 02/1994 G (2006), T (2003)
The FOMC started announcing changes in its policy stance. Announcements about the target are made on the day of FOMC meeting, release of minutes with 6 weeks delay and transcripts with 5 years delay.
05/1999 G (2006) Provision of policy decisions even in the case of non-adjustment. The statement that is released after each policy meeting includes an explicit phrase that describes the policy tilt. 01/2000 T (2003) Public statements after FOMC meetings have revised language (f.e. without‘neutral bias’).
Source: G =Geraats et al. (2006), CC =Coppel and Connolly (2003), MP =Mishkin and Posen (1997), T =Tomljanovich (in press), HV =Heikensten and Vredin (2002).Tomljanovich (in press)gives an overview of transparency changes indicated byCoppel and Connolly (2003),Muller and Zelmer (1999),King (1997)and central bank Webpages.
References
Batchelor, R.A., 2001. How useful are the forecasts of intergovernmental agencies? The IMF and OECD versus the consensus. Applied Economics 33, 225–235.
Bini-Smaghi, L., Gros, D., 2001. Is the European central bank sufficiently accountable and transparent? Center for Economic Policy Studies Working Paper, no. 7. Brussels.
Blinder, A.S., 2000. Central bank credibility: why do we care? How do we build it? American Economic Review 90, 1421–1431.
Buiter, W.H., 1999. Alice in Euroland. Journal of Common Market Studies 73, 181–209.
Chortareas, G., Stasavage, D., Sterne, G., 2002. Does it pay to be transparent? International evidence from the publication of central bank forecasts. Federal Reserve Bank of St. Louis Review 84, 99–117.
Chortareas, G., Stasavage, D., Sterne, G., 2003. Does monetary policy transparency reduce disinflation costs? The Manchester School 71, 521–540.
Coppel, J., Connolly, E., 2003. What do financial market data tell us about monetary policy transparency? Research Discussion Paper, vol. 05. Reserve Bank of Australia, Sydney.
De Haan, J., Amtenbrink, F., Waller, S., 2004. The transparency and credibility of the European Central Bank. Journal of Common Market Studies 42, 775–794.
Demertzis, M., Hughes Hallett, A., in press. Central Bank transparency in theory and practice. Journal of Macroeconomics, 29, 4.
Eijffinger, S.C.W., Geraats, P.M., 2004. How transparent are central banks? Cambridge Working Papers in Economics, no. 0411. January.
Eijffinger, S.C.W., Geraats, P.M., 2006. How transparent are central banks? European Journal of Political Economy 22, 1–21.
Faust, J., Svensson, L., 2002. The equilibrium degree of transparency and control in monetary policy. Journal of Money, Credit and Banking 34, 520–539.
Geraats, P.M., 2000. Why adopt transparency? The publication of central bank forecasts. CEPR Discussion Paper, no. 2582. CEPR, London.
Geraats, P.M., 2002. Central bank transparency. Economic Journal 112, 532–565. Appendix B (continued)
Geraats, P.M., Eijffinger, S.C.W., van der Cruijsen, C.A.B., 2006. Does central bank transparency reduce interest rates? CEPR Discussion Paper, no. 5526. CEPR, London.
Hansen, B.E., 1999. The grid bootstrap and the autoregressive model. The Review of Economics and Statistics 81, 594–607.
Heikensten, L., Vredin, A., 2002. The art of targeting inflation. Swedish Economic Review 4, 5–34.
Issing, O., 1999. The Eurosystem: transparent and accountable or‘Willem in Euroland”. Journal of Common Market Studies 37, 503–519.
Jensen, H., 2002. Optimal degrees of transparency in monetary policy making. Scandinavian Journal of Economics 104, 399–422.
King, M., 1997. Changes in UK monetary policy: rules and discretion in practice. Journal of Monetary Economics 39, 81–97.
Levin, A.T., Natalucci, F.M., Piger, J.M., 2004. The macroeconomic effects of inflation targeting. Federal Reserve Bank of St. Louis Review 86, 51–80.
Mishkin, F.S., Posen, A.S., 1997. Inflation targeting: lessons from four countries. Economic Policy Review. Federal Reserve Bank of New York (issue Aug. 9–10).
Muller, P., Zelmer, M., 1999. Greater transparency in monetary policy: Impact on financial markets. Technical Report, vol. 86. Bank of Canada, Ottawa.
Siklos, P., 2002. The Changing Face of Central Banking: Evolutionary Trends Since World War II. Cambridge University Press, Cambridge.
Stock, J.H., 1991. Confidence intervals for the largest autoregressive root in U.S. macroeconomic time series. Journal of Monetary Economics 28, 435–459.
Tomljanovich, M., in press. Does central bank transparency impact financial markets? A cross-country econometric analysis. Colgate University Discussion Paper 103–15. Southern Economic Journal.