Android Application for Monitoring Soil Moisture using Raspberry Pi
Lily Puspa Dewi, Justinus Andjarwirawan, Robin Putra Wardojo
Informatics Engineering DepartmentPetra Christian University Surabaya, Indonesia
Abstract— The growing population causes increasing clean
water demand. This leads to a crisis of water demand due to high water consumption. During the dry season, water availability becomes increasingly rare for crop needs. To obtain maximum crop production, the availability of water should be sufficient.
Therefore, an application for Android was created to assist monitoring of soil moisture. This application obtains data from the sensor which is connected to Raspberry Pi 3. This data will be sent to the server and displayed on Android application. LED indicator is provided to notify the water supply for the plants.
The final result of this research is a system application development where a sensor with analog data can be converted into percentages and displayed in the Android application. From this percentage, users can set the indicator for the sensor to turn on the LED. Users can also view graphs from percentage data, manage plant data for the database, and set the application configuration.
Keywords— IoT, LED, Raspberry Pi, Sensor, Soil Moisture.
I. INTRODUCTION
Human population growth leads to a crisis of water demand due to the continuous use of large quantities by humans. Ironically, water is the most important need for all living things. During the dry season, the presence of water is increasingly scarce for use on plantation. Most of the people's livelihood in Indonesia comes from plantations. In order to get the maximum plantation products and reducing water usage, the provision of water for the plantation cannot be less or more. The time of watering and the amount of water provided becomes a very serious problem. Each plant has its own characteristics in watering time and the amount of water required. Provision of water that is less or excessive in plants can cause plants to become dry or rotten.
Soil quality, in terms of plantations can be determined by measuring various soil parameters. To obtain information about soil environment condition that approached the actual condition, soil parameter measurements are needed continuously. Parameters to be used in this research is the soil moisture. Each plant needs different soil moisture. That is why soil moisture information is indispensable in plantations. With the advancement of technology today, humans can use various ways to get soil moisture information. The development of technology that is usually used is a sensor or microcontroller. Moreover, with the Internet technology, the information sent will be more real time and can be accessed every time. Therefore, the author tries to utilize sensor technology to conduct research and monitoring of soil moisture. Data will be
taken from the sensor and received using Raspberry Pi which later can be monitored from Android-based devices. It is expected that with the application of Android for monitoring the soil moisture using Raspberry Pi can improve the quality of the plant, maintain the level of soil fertility and avoid the plants from dryness or decay.
II. LITERATURE REVIEW
A. Android Studio
Android Studio was introduced in 2013 on Google I/O. Before that, used Android Developer Tools (ADT). ADT is an Android development environment built on an open source integrated development environment (IDE) called Eclipse. Android Studio is a collaboration of JetBrains and Google. With the Android Studio, it makes Android development easier. So, it become the official IDE for Android.
The basis of Android Studio is Java. Java is a very useful and popular programming language in many ways. The most important reason why using Java is memory management. This means that programmers do not have to think about the use of stacked memory, nor need to worry about the release of memory after use. Like Java, the Android Studio environment is a programming that manages memory. [1]
B. Python 2.7
Python is an open source programming language used to create standalone programs and scripting applications in many other domains. This programming language is free, portable, powerful, and relatively easy and fun to use. Many companies use Python to be developed in large and small projects.
In its development, Python already has 3 versions. But what is now popular is version 3.X and 2.X. In Python 3.X many changes in syntax calling as well as new Object-oriented programming. Therefore, Python 3.X and 2.X are considered to have different attractions and goals. [2]
and dictionary comprehensions, dictionary views, new syntax for nested with statements, the sysconfig module.[4]
C. Raspberry Pi
Raspberry Pi is a computer that runs the Linux operating system. It has USB sockets you can plug a keyboard and mouse into and HDMI (High-Definition Multimedia Interface) video output you can connect a TV or monitor into. Raspberry Pi uses an SD card instead of a hard disk that is useful for storing the operating system. When booting, there is a complete Linux desktop with office suite, video player, games, and more. Raspberry Pi is just a bare board which has no case to protect it.
Inside this Raspberry Pi, there are GPIO (general purpose input / output) pins, and they allow the Raspberry Pi to be connected to custom electronics. There is also integrated Wi-Fi and Bluetooth when purchasing this unit. Many things can be done on Raspberry Pi like on Linux desktop. For example, to change Office documents, use the Internet, and play the Page tools, developed by Rasmus Lerdorf to assist users with web page tasks. PHP proved so useful and popular, it rapidly grew to become the full-featured language that it is today, acquiring the name PHP Hypertext Preprocessor along the way to represent its expanded abilities – processing web pages
before they’re displayed.
The popularity of PHP continues to grow rapidly because of its many advantages. Among others are fast on web sistem because it is embedded in HTML code, the time to process and load a web page is short. Free, PHP is proof that free lunches do exist and that you can get more than you paid for.
It’s easy to use, the syntax is simple and easy to understand
and use, even for non-programmers. For use in web sites, PHP code is designed to be included easily in a HTML file. Versatile, PHP runs on a wide variety of operating system – Windows, Linux, Mac OS, and most varieties of Unix. Technical support is widely available; you can join one of several e-mail discussion lists offered on the PHP web site (www.php.net). Which cover topics such as general PHP, PHP on Windows, or databases and PHP. In addition, a web interface to the discussion lists is available at news.php.net,
where you can browse or search the messages. It’s secure, as
long as your scripts are designed correctly, the user does not
see the PHP code. It’s customizable, the open source license
allows programmers to modify the PHP software, and adding or modifying features as needed to fit their own environments. PHP provides significant control over the environment, reducing chances of failure. [5]
E. Soil Moisture Sensor
A soil moisture sensor is another type of water sensor. It works by measuring the electrical conductivity of the ground in which it is buried. Wet earth transmits electric current better
than dry earth and so the sensor can detect the presence of water in the soil by measuring its conductivity. When the amount of moisture brings the current capacity up to a preset level, the sensor sends a signal to the controller. The moisture level can be adjusted on the sensor. It should be placed a few inches in the ground at a well-drained spot in the yard (a location high enough that water from the surrounding area does not drain into it and produce false high-moisture readings for the yard). Since a moisture sensor senses water in only one tiny spot and is used to represent the entire yard in the controller program, its placement should be carefully selected so it is a fair example of the landscaped area. [6]
III. SYSTEMS ANALYSIS AND DESIGN
A. Hardware Design
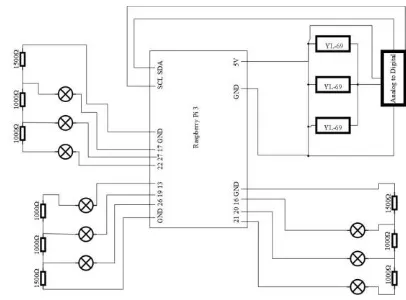
Components to be used are 3 soil moisture sensors YL-69, analog to digital converter (ADC), 3 pieces of light emitting diode (LED) used as indicator of moisture, moisture meter
comparator, 1500Ω resistor and 1000Ω resistor. The Sensors
and ADC will be rated at 5V while LED are connected to GPIO (general purpose input / output) pins in Raspberry Pi 3. GPIO pins to be used are GPIO 21, 20, 16 and GND, GPIO 26, 19, 13 and GND, GPIO 22, 27, 17 and GND. These three GPIO pairs will be used to turn on the LED. While the 5V pin and GND pin will be connected to the board to turn on the soil moisture sensor YL-69. The sensors used will be connected to the ADC and the ADC will be connected to the SDA and SCL on Raspberry Pi 3. Python will retrieve the data through these SDA and SCL pins. The results of this data will be compared with the moisture meter and converted into percentages. The hardware design can be seen in Fig 1.
Fig 1. Hardware Design
B. Raspberry Pi 3 System
Start
Fig 2. Raspberry Pi 3 system
C. Mobile Application System
Android Device will retrieve the percentage data from the server. The data will be displayed on the GUI of the mobile application. In the application, there is a plant database that will be used for indicator setting. Each sensor data can have 1 indicator. If the indicator has not been selected, then the mobile application will send data to the server and Raspberry Pi 3 will read the data to turn on the green light.
If the indicator has been selected then the application will check whether the result is less moist, moist, or too moist. For less moist results, the application will send data to the server then Raspberry Pi 3 will read the data to turn on the red light. If the result is moist, the application will send data to the server then Raspberry Pi 3 will read the data to turn on the green light. And if the result is too moist, the application will send data to the server then Raspberry Pi 3 will read the data to turn on the blue light. Mobile application system can be seen in Fig 3.
Start send indicato r data to
server and blue LED
Fig 3. Mobile application system
IV. RESULT
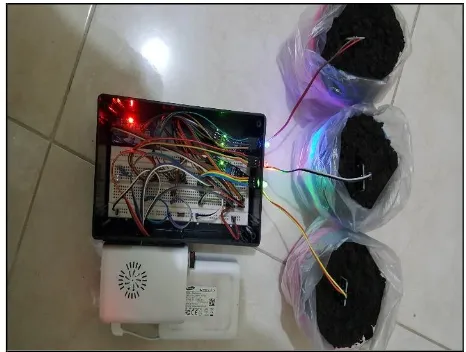
The result of this system is software and hardware. Result of hardware testing can be seen in Fig 4.
Fig 4. Result of hardware testing
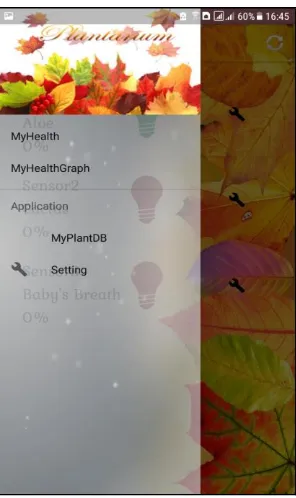
Main menu is a menu to select some features in this application. This menu has several features, including
“MyHealth” menu, “MyHealthGraph” menu, “MyPlantDB”
Fig 5. Main menu testing
Sensor results menu or called “MyHealth” is the menu that first appears when the application is opened. This menu displays the percentage of sensor results that have been retrieved from the server. There is a refresh button on the top right to retrieve the latest sensor results. Furthermore, this button also works to change the color of the LED and send the LED status of the sensor that has been given an indicator. On the right side of the LED there is a button to set the indicator. If this button is pressed, the page will move to the settings menu of the indicator. At the bottom of the page, there is a button to simulate the water requirement for the plant. Sensor results menu testing before being given an indicator can be seen in Fig 6.
Fig 6. Sensor results menu testing before being given an indicator
After the sensor results menu is given an indicator then the display will change. Sensor results menu testing after being given an indicator can be seen in Fig 7.
Fig 7. Sensor results menu testing after being given an indicator
Indicator settings menu is the menu that appears when the indicator settings button on the sensor results menu is pressed. This menu contains plant data that has been entered into the database. Indicator setting menu testing can be seen in Fig 8.
Database list menu or called "MyPlantDB" is a menu that displays the name of the plant that has been entered in the database. At the top right, there is an add button that is used to add the contents of the database. Whereas if one of the list is pressed, it will display the details of the plant. Database list menu testing can be seen in Fig 9.
Fig 9. Database list menu testing
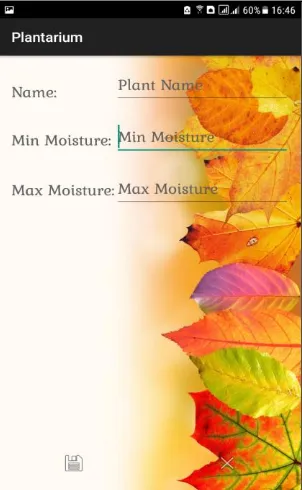
Add database menu is the menu used to add the plant database. In this menu, users fill in plant details such as the name of the plant, the minimum moisture of the plant, and the maximum moisture of the plant. At the bottom of the menu there are 2 buttons to save and cancel. Add database menu testing can be seen in Fig 10.
Fig 10. Add database menu testing
Plant details menu is the menu used to display the name of the plant, minimum moisture of the plant, and maximum moisture of the plant. This menu will be displayed when the user selects one of the contents of the database list menu. At the bottom, there is a button to edit and delete. Plant details menu testing can be seen in Fig 11.
Fig 11. Plant details menu testing
Delete the database can be done by pressing the delete button contained in the plant details menu. If the button is pressed, then a message will appear to confirm deletion. Delete database testing can be seen in Fig 12.
Edit database menu is the menu that will appear when the edit button on the Plant detail menu is pressed. This menu is used to modify an existing database. Existing data will appear again to be changed by the user. There are 2 buttons on the bottom of the menu. The button is the save button and cancel button. Edit database menu testing can be seen in Fig 13.
Fig 13. Edit database menu testing
Graphic menu or called "MyHealthGraph" is the menu used to display graphic images in the application. This graph is formed from the database on the server. There are 2 kinds of graphs to display, the first is the line graph. Line graph testing can be seen in Fig 14.
Fig 14. Line graph testing
The second graph is the area chart. Area chart testing can be seen in Fig 15.
Fig 15. Area chart testing
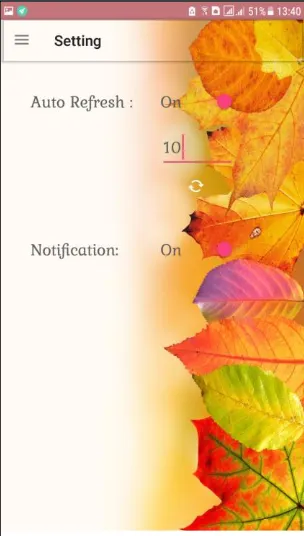
Setting menu is the menu used to run automatic refresh feature or notification. At first, this feature is off. For automatic refresh feature, user must enter numbers in seconds. Setting menu testing can be seen in Fig 16.
Simulation menu is the menu used to run the required water count simulation feature. This feature can provide the required amount of water the plants need with the length, width, and height specified by the user. User can select the sensor or enter the desired percentage manually. If the plant is too moist it will appear warning not to add water. Simulation menu testing can be seen in Fig 17.
Fig 17. Simulation menu testing
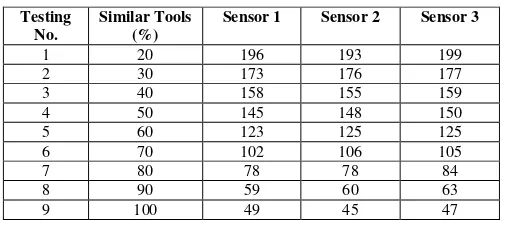
To convert analog data from the sensor to a percentage, testing done with comparison of similar tools. Testing is done 20 times every 10% with a time span of 10 seconds each data retrieval. Results of equations with comparison tools can be seen in Table 1.
TABLE 1. RESULT OF EQUATIONS WITH COMPARISON TOOLS
Testing the soil, then testing was carried out with the addition of water to the soil with size of 10x10x10 cm. Testing is done 6 times with sensor 1, sensor 2, and sensors 3. While the addition of water is done by adding 10 millilitres each test and is done from 0 millilitres to 50 millilitres. The results of testing addition of water to the soil can be seen in Table 2.
TABLE 2. RESULTS OF TESTING ADDITION OF WATER TO THE SOIL
Testing application for monitoring soil moisture using Raspberry Pi, it can be concluded:
• Application can convert analog data from sensor to percentage using comparison of similar tools.
• From the results of equations with comparison tools can be concluded that the results of each sensor is not much different. So, the minimum and maximum can be taken from each class to be changed to percentage.
• Data obtain 20 times because on data retrieval 10 times found anomaly in analog data.
• Data is changed every 10% of soil moisture percentage starting from 20% - 100%.
• Data obtain from 20% because in the test no results found less than 20%.
• Android application can take percentage data from the server within a certain period or manually pressed by the user.
• Application can turn on the LED indicator from Android by sending LED data to the server. The indicator data from the server is taken by Raspberry Pi 3 and read to turn on the light.
• There is a test for the addition of water to the plant done 6 times with the addition of 10 millilitres of water per experiment. The addition of water starts from 0 millilitres to 50 millilitres.
• Testing performed on soil with size of 10x10x10 cm.
• From the addition of water testing, it is known that every 50 millilitres of water with soil size of 10x10x10 cm, 30% of moisture is obtained.
REFERENCES
[1] C. Craig, and A. Gerber, “Learn Android Studio: Build Android apps quickly and effectively,”United States of America: Apress, 2015. [2] M. Lutz, “Learning python,”United States of America: O’Reilly Media,
Inc., 2013.
[3] S. Monk, “Programming the Raspberry Pi: Getting started with Python,” New York: McGraw-Hill Companies, 2013.
[4] Python.org, “Python 2.7.2 release,” 2016. [Online] Available: https://www.python.org/download/releases/2.7.2/
[5] S. Suehring, and J. Valade, “PHP, MySQL, JavaScript & HTML5 All-In-One For Dummies,” New Jersey: John Wiley & Sons, Inc., 2013. [6] Q. Wells, “Guide to digital home technology integration,”New York: