Studies in Classifi cation, Data Analysis,
and Knowledge Organization
Algorithms from
and for Nature
and Life
Berthold Lausen
Dirk Van den Poel
Alfred Ultsch
Editors
Studies in Classification, Data Analysis,
and Knowledge Organization
Managing Editors Editorial Board
H.-H. Bock, Aachen D. Baier, Cottbus
W. Gaul, Karlsruhe F. Critchley, Milton Keynes
M. Vichi, Rome R. Decker, Bielefeld
C. Weihs, Dortmund E. Diday, Paris
M. Greenacre, Barcelona C.N. Lauro, Naples J. Meulman, Leiden P. Monari, Bologna S. Nishisato, Toronto N. Ohsumi, Tokyo O. Opitz, Augsburg G. Ritter, Passau M. Schader, Mannheim
For further volumes:
Berthold Lausen
Dirk Van den Poel
Alfred Ultsch
Editors
Algorithms from
and for Nature and Life
Classification and Data Analysis
Editors
Berthold Lausen
Department of Mathematical Sciences University of Essex
Colchester, United Kingdom
Alfred Ultsch Databionics, FB 12 University of Marburg Marburg, Germany
Dirk Van den Poel Department of Marketing Ghent University Ghent, Belgium
ISSN 1431-8814
ISBN 978-3-319-00034-3 ISBN 978-3-319-00035-0 (eBook) DOI 10.1007/978-3-319-00035-0
Springer Cham Heidelberg New York Dordrecht London
Library of Congress Control Number: 2013945874
© Springer International Publishing Switzerland 2013
This work is subject to copyright. All rights are reserved by the Publisher, whether the whole or part of the material is concerned, specifically the rights of translation, reprinting, reuse of illustrations, recitation, broadcasting, reproduction on microfilms or in any other physical way, and transmission or information storage and retrieval, electronic adaptation, computer software, or by similar or dissimilar methodology now known or hereafter developed. Exempted from this legal reservation are brief excerpts in connection with reviews or scholarly analysis or material supplied specifically for the purpose of being entered and executed on a computer system, for exclusive use by the purchaser of the work. Duplication of this publication or parts thereof is permitted only under the provisions of the Copyright Law of the Publisher’s location, in its current version, and permission for use must always be obtained from Springer. Permissions for use may be obtained through RightsLink at the Copyright Clearance Center. Violations are liable to prosecution under the respective Copyright Law.
The use of general descriptive names, registered names, trademarks, service marks, etc. in this publication does not imply, even in the absence of a specific statement, that such names are exempt from the relevant protective laws and regulations and therefore free for general use.
While the advice and information in this book are believed to be true and accurate at the date of publication, neither the authors nor the editors nor the publisher can accept any legal responsibility for any errors or omissions that may be made. The publisher makes no warranty, express or implied, with respect to the material contained herein.
Printed on acid-free paper
Preface
Revised versions of selected papers presented at the Joint Conference of the German Classification Society (GfKl) – 35th Annual Conference – GfKl 2011 – , the German Association for Pattern Recognition (DAGM) – 33rd annual symposium – DAGM 2011 – and the Symposium of the International Federation of Classification Societies (IFCS) – IFCS 2011 – held at the University of Frankfurt (Frankfurt am Main, Germany) August 30 – September 2, 2011, are contained in this volume of “Studies in Classification, Data Analysis, and Knowledge Organization”.
One aim of the conference was to provide a platform for discussions on results concerning the interface that data analysis has in common with other areas such as, e.g., computer science, operations research, and statistics from a scientific perspective, as well as with various application areas when “best” interpretations of data that describe underlying problem situations need knowledge from different research directions.
Practitioners and researchers – interested in data analysis in the broad sense – had the opportunity to discuss recent developments and to establish cross-disciplinary cooperation in their fields of interest. More than 420 persons attended the con-ference, more than 180 papers (including plenary and semiplenary lectures) were presented. The audience of the conference was very international.
Fifty-five of the papers presented at the conference are contained in this. As an unambiguous assignment of topics addressed in single papers is sometimes difficult the contributions are grouped in a way that the editors found appropriate. Within (sub)chapters the presentations are listed in alphabetical order with respect to the authors’ names. At the end of this volume an index is included that, additionally, should help the interested reader.
The editors like to thank the members of the scientific program committee: D. Baier, H.-H. Bock, R. Decker, A. Ferligoj, W. Gaul, Ch. Hennig, I. Herzog, E. H¨ullermeier, K. Jajuga, H. Kestler, A. Koch, S. Krolak-Schwerdt, H. Locarek-Junge, G. McLachlan, F.R. McMorris, G. Menexes, B. Mirkin, M. Mizuta, A. Montanari, R. Nugent, A. Okada, G. Ritter, M. de Rooij, I. van Mechelen, G. Venturini, J. Vermunt, M. Vichi and C. Weihs and the additional reviewers of the proceedings: W. Adler, M. Behnisch, C. Bernau, P. Bertrand, A.-L. Boulesteix,
vi Preface
A. Cerioli, M. Costa, N. Dean, P. Eilers, S.L. France, J. Gertheiss, A. Geyer-Schulz, W.J. Heiser, Ch. Hohensinn, H. Holzmann, Th. Horvath, H. Kiers, B. Lorenz, H. Lukashevich, V. Makarenkov, F. Meyer, I. Morlini, H.-J. Mucha, U. M¨uller-Funk, J.W. Owsinski, P. Rokita, A. Rutkowski-Ziarko, R. Samworth, I. Schm¨adecke and A. Sokolowski.
Last but not least, we would like to thank all participants of the conference for their interest and various activities which, again, made the 35th annual GfKl conference and this volume an interdisciplinary possibility for scientific discussion, in particular all authors and all colleagues who reviewed papers, chaired sessions or were otherwise involved. Additionally, we gratefully take the opportunity to acknowledge support by Deutsche Forschungsgemeinschaft (DFG) of the Sympo-sium of the International Federation of Classification Societies (IFCS) – IFCS 2011. As always we thank Springer Verlag, Heidelberg, especially Dr. Martina Bihn, for excellent cooperation in publishing this volume.
Colchester, UK Berthold Lausen
Ghent, Belgium Dirk Van den Poel
Contents
Part I Invited
Size and Power of Multivariate Outlier Detection Rules. . . 3 Andrea Cerioli, Marco Riani, and Francesca Torti
Clustering and Prediction of Rankings
Within a Kemeny Distance Framework. . . 19 Willem J. Heiser and Antonio D’Ambrosio
Solving the Minimum Sum of L1 Distances Clustering Problem by Hyperbolic Smoothing and Partition into Boundary
and Gravitational Regions. . . 33 Adilson Elias Xavier, Vinicius Layter Xavier,
and Sergio B. Villas-Boas
Part II Clustering and Unsupervised Learning
On the Number of Modes of Finite Mixtures of Elliptical Distributions. . . 49 Grigory Alexandrovich, Hajo Holzmann, and Surajit Ray
Implications of Axiomatic Consensus Properties. . . 59 Florent Domenach and Ali Tayari
Comparing Earth Mover’s Distance and its Approximations
for Clustering Images. . . 69 Sarah Frost and Daniel Baier
A Hierarchical Clustering Approach to Modularity Maximization. . . 79 Wolfgang Gaul and Rebecca Klages
Mixture Model Clustering with Covariates Using Adjusted
Three-Step Approaches.. . . 87 Dereje W. Gudicha and Jeroen K. Vermunt
viii Contents
Efficient Spatial Segmentation of Hyper-spectral 3D Volume Data. . . 95 Jan Hendrik Kobarg and Theodore Alexandrov
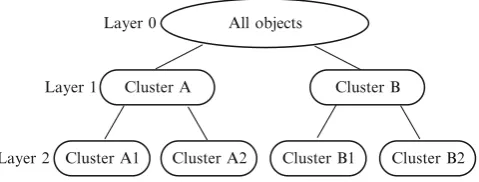
Cluster Analysis Based on Pre-specified Multiple Layer Structure. . . 105 Akinori Okada and Satoru Yokoyama
Factor PD-Clustering.. . . 115 Cristina Tortora, Mireille Gettler Summa, and Francesco Palumbo
Part III Statistical Data Analysis, Visualization and Scaling
Clustering Ordinal Data via Latent Variable Models. . . 127 Damien McParland and Isobel Claire Gormley
Sentiment Analysis of Online Media. . . 137 Michael Salter-Townshend and Thomas Brendan Murphy
Visualizing Data in Social and Behavioral Sciences:
An Application of PARAMAP on Judicial Statistics. . . 147 Ulas Akkucuk, J. Douglas Carroll, and Stephen L. France
Properties of a General Measure of Configuration Agreement. . . 155 Stephen L. France
Convex Optimization as a Tool for Correcting Dissimilarity
Matrices for Regular Minimality. . . 165 Matthias Trendtel and Ali ¨Unl¨u
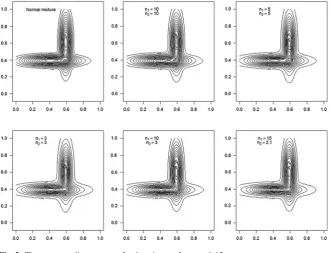
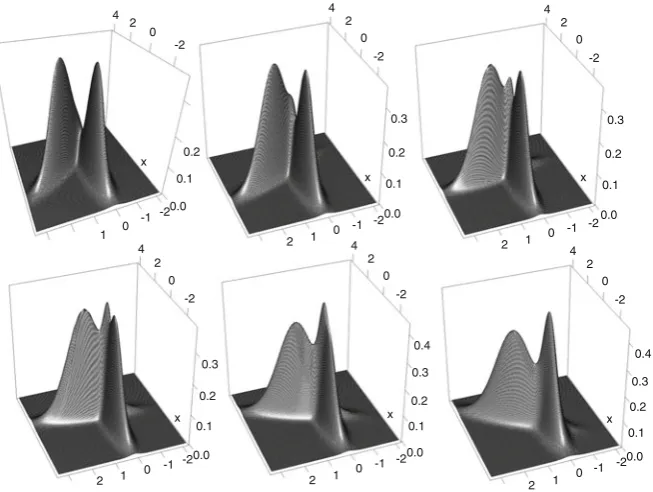
Principal Components Analysis for a Gaussian Mixture. . . 175 Carlos Cuevas-Covarrubias
Interactive Principal Components Analysis: A New
Technological Resource in the Classroom. . . 185 Carmen Villar-Pati˜no, Miguel Angel Mendez-Mendez,
and Carlos Cuevas-Covarrubias
One-Mode Three-Way Analysis Based on Result of One-Mode
Two-Way Analysis. . . 195 Satoru Yokoyama and Akinori Okada
Latent Class Models of Time Series Data: An Entropic-Based
Uncertainty Measure. . . 205 Jos´e G. Dias
Regularization and Model Selection with Categorical Covariates.. . . 215 Jan Gertheiss, Veronika Stelz, and Gerhard Tutz
Contents ix
Intrablocks Correspondence Analysis. . . 233 Campo El´ıas Pardo and Jorge Eduardo Ortiz
Determining the Similarity Between US Cities Using a Gravity
Model for Search Engine Query Data . . . 243 Paul Hofmarcher, Bettina Gr¨un, Kurt Hornik, and Patrick Mair
Part IV Bioinformatics and Biostatistics
An Efficient Algorithm for the Detection and Classification of
Horizontal Gene Transfer Events and Identification of Mosaic Genes. . . 253 Alix Boc, Pierre Legendre, and Vladimir Makarenkov
Complexity Selection with Cross-validation for Lasso
and Sparse Partial Least Squares Using High-Dimensional Data. . . 261 Anne-Laure Boulesteix, Adrian Richter, and Christoph Bernau
A New Effective Method for Elimination of Systematic Error
in Experimental High-Throughput Screening. . . 269 Vladimir Makarenkov, Plamen Dragiev, and Robert Nadon
Local Clique Merging: An Extension of the Maximum Common Subgraph Measure with Applications in Structural
Bioinformatics. . . 279 Thomas Fober, Gerhard Klebe, and Eyke H¨ullermeier
Identification of Risk Factors in Coronary Bypass Surgery. . . 287 Julia Schiffner, Erhard Godehardt, Stefanie Hillebrand, Alexander
Albert, Artur Lichtenberg, and Claus Weihs
Part V Archaeology and Geography, Psychology and Educational Sciences
Parallel Coordinate Plots in Archaeology. . . 299 Irmela Herzog and Frank Siegmund
Classification of Roman Tiles with Stamp PARDALIVS. . . 309 Hans-Joachim Mucha, Jens Dolata, and Hans-Georg Bartel
Applying Location Planning Algorithms to Schools: The Case
of Special Education in Hesse (Germany).. . . 319 Alexandra Schwarz
Detecting Person Heterogeneity in a Large-Scale Orthographic
Test Using Item Response Models. . . 329 Christine Hohensinn, Klaus D. Kubinger, and Manuel Reif
x Contents
Part VI Text Mining, Social Networks and Clustering
An Approach for Topic Trend Detection . . . 347 Wolfgang Gaul and Dominique Vincent
Modified Randomized Modularity Clustering: Adapting the
Resolution Limit. . . 355 Andreas Geyer-Schulz, Michael Ovelg ¨onne, and Martin Stein
Cluster It! Semiautomatic Splitting and Naming
of Classification Concepts. . . 365 Dominik Stork, Kai Eckert, and Heiner Stuckenschmidt
Part VII Banking and Finance
A Theoretical and Empirical Analysis of the Black-Litterman Model. . . 377 Wolfgang Bessler and Dominik Wolff
Vulnerability of Copula-VaR to Misspecification of Margins
and Dependence Structure. . . 387 Katarzyna Kuziak
Dynamic Principal Component Analysis: A Banking Customer
Satisfaction Evaluation. . . 397 Caterina Liberati and Paolo Mariani
Comparison of Some Chosen Tests of Independence
of Value-at-Risk Violations. . . 407 Krzysztof Piontek
Fundamental Portfolio Construction Based on Mahalanobis Distance. . . . 417 Anna Rutkowska-Ziarko
Multivariate Modelling of Cross-Commodity Price Relations
Along the Petrochemical Value Chain. . . 427 Myriam Th¨ommes and Peter Winker
Part VIII Marketing and Management
Lifestyle Segmentation Based on Contents of Uploaded Images
Versus Ratings of Items. . . 439 Ines Daniel and Daniel Baier
Optimal Network Revenue Management Decisions Including
Flexible Demand Data and Overbooking. . . 449 Wolfgang Gaul and Christoph Winkler
Non-symmetrical Correspondence Analysis of Abbreviated
Contents xi
Antecedents and Outcomes of Participation in Social
Networking Sites. . . 465 Sandra Loureiro
User-Generated Content for Image Clustering
and Marketing Purposes . . . 473 Diana Schindler
Logic Based Conjoint Analysis Using the Commuting
Quantum Query Language . . . 481 Ingo Schmitt and Daniel Baier
Product Design Optimization Using Ant Colony And Bee
Algorithms: A Comparison. . . 491 Sascha Voekler, Daniel Krausche, and Daniel Baier
Part IX Music Classification Workshop
Comparison of Classical and Sequential Design of Experiments
in Note Onset Detection. . . 501 Nadja Bauer, Julia Schiffner, and Claus Weihs
Recognising Cello Performers Using Timbre Models. . . 511 Magdalena Chudy and Simon Dixon
A Case Study About the Effort to Classify Music Intervals
by Chroma and Spectrum Analysis. . . 519 Verena Mattern, Igor Vatolkin, and G¨unter Rudolph
Computational Prediction of High-Level Descriptors of Music
Personal Categories.. . . 529 G¨unther R¨otter, Igor Vatolkin, and Claus Weihs
High Performance Hardware Architectures for Automated
Contributors
Ulas Akkucuk Department of Management, Bogazici University, Istanbul, Turkey, [email protected]
Alexander Albert Clinic of Cardiovascular Surgery, Heinrich-Heine University, 40225 D¨usseldorf, Germany
Theodore Alexandrov Center for Industrial Mathematics, University of Bremen, 28359 Bremen, Germany
Grigory Alexandrovich Department of Mathematics and Computer Science,
Mar-burg University, MarMar-burg, Germany
Daniel Baier Institute of Business Administration and Economics, Brandenburg University of Technology Cottbus, Postbox 101344, 03013 Cottbus, Germany, [email protected]
Hans-Georg Bartel Department of Chemistry, Humboldt University,
Brook-Taylor-Straße 2, 12489 Berlin, Germany,[email protected]
Nadja Bauer Faculty of Statistics Chair of Computational Statistics, TU Dort-mund, DortDort-mund, Germany,[email protected]
Christoph Bernau Institut f¨ur Medizinische Informationsverarbeitung, Biometrie und Epidemiologie, Universit¨at M¨unchen (LMU), M¨unich, Germany
Wolfgang Bessler Center for Finance and Banking, University of Giessen, Licher Strasse 74, 35394 Giessen, Germany,[email protected] Holger Blume Institute of Microelectronic Systems, Appelstr. 4, 30167 Hannover, Germany,[email protected]
Alix Boc Universit´e de Montr´eal, C.P. 6128, succursale Centre-ville, Montr´eal, QC H3C 3J7 Canada,[email protected]
xiv Contributors
Anne-Laure Boulesteix Institut f¨ur Medizinische Informationsverarbeitung,
Biometrie und Epidemiologie, Universit¨at M¨unchen (LMU), M¨unich, Germany, [email protected]
Nina B ¨uchel European Research Center for Information Systems (ERCIS), Uni-versity of M¨unster, M¨unster, Germany,[email protected]
Carlos Cuevas-Covarrubias Anahuac University, Naucalpan, State of Mexico,
Mexico,[email protected]
J. Douglas Carroll Rutgers Business School, Newark and New Brunswick,
Newark, NJ, USA
Andrea Cerioli Dipartimento di Economia, Universit`adi Parma, Parma, Italy,
Magdalena Chudy Centre for Digital Music, Queen Mary University of London,
Mile End Road, London, E1 4NS UK,[email protected]
Antonio D’Ambrosio Department of Mathematics and Statistics, University of
Naples Federico II, Via Cinthia, M.te S. Angelo, Naples, Italy,[email protected]
Ines Daniel Institute of Business Administration and Economics, Brandenburg
University of Technology Cottbus, Postbox 101344, 03013 Cottbus, Germany, [email protected]
Jos´e G. Dias UNIDE, ISCTE – University Institute of Lisbon, Lisbon, Portugal Edif´ıcio ISCTE, Av. das Forc¸as Armadas, 1649-026 Lisboa, Portugal, [email protected]
Simon Dixon Centre for Digital Music, Queen Mary University of London, Mile
End Road, London, E1 4NS UK,[email protected]
Jens Dolata Head Office for Cultural Heritage Rhineland-Palatinate (GDKE),
Große Langgasse 29, 55116 Mainz, Germany,[email protected]
Florent Domenach Department of Computer Science, University of Nicosia,
46 Makedonitissas Avenue, PO Box 24005, 1700 Nicosia, Cyprus, [email protected]
Plamen Dragiev D´epartement d’Informatique, Universit´e du Qu´ebec `a Montr´eal, c.p. 8888, succ. Centre-Ville, Montreal, QC H3C 3P8 Canada
Department of Human Genetics, McGill University, 1205 Dr. Penfield Ave., Mon-treal, QC H3A-1B1 Canada
Kai Eckert KR & KM Research Group, University of Mannheim, Mannheim,
Germany,[email protected]
Contributors xv
Thomas Fober Department of Mathematics and Computer Science,
Philipps-Universit¨at, 35032 Marburg, Germany,[email protected]
Stephen L. France Lubar School of Business, University of
Wisconsin-Milwaukee, P. O. Box 742, Wisconsin-Milwaukee, WI, 53201-0742 USA,[email protected]
Sarah Frost Institute of Business Administration and Economics, Brandenburg
University of Technology Cottbus, Postbox 101344, 03013 Cottbus, Germany, [email protected]
Wolfgang Gaul Institute of Decision Theory and Management Science,
Karlsruhe Institute of Technology (KIT), Kaiserstr. 12, 76128 Karlsruhe, Germany, [email protected]
Jan Gertheiss Department of Statistics, LMU Munich, Akademiestr. 1, 80799
Munich, Germany,[email protected]
Andreas Geyer-Schulz Information Services and Electronic Markets, IISM, Karl-sruhe Institute of Technology, Kaiserstrasse 12, D-76128 KarlKarl-sruhe, Germany, [email protected]
Erhard Godehardt Clinic of Cardiovascular Surgery, Heinrich-Heine University, 40225 D¨usseldorf, Germany,[email protected]
Isobel Claire Gormley University College Dublin, Dublin, Ireland,
Bettina Gr ¨un Department of Applied Statistics, Johannes Kepler University Linz, Altenbergerstraße 69, 4040 Linz, Austria,[email protected]
Dereje W. Gudicha Tilburg University, PO Box 50193, 5000 LE Tilburg, The
Netherlands,[email protected]
Reinhold Hatzinger Institute for Statistics and Mathematics, WU Vienna
Uni-versity of Economics and Business, Augasse 2-6, 1090 Vienna, Austria, [email protected]
Willem J. Heiser Institute of Psychology, Leiden University, P.O. Box 9555, 2300 RB Leiden, The Netherlands,[email protected]
Irmela Herzog LVR-Amt f¨ur Bodendenkmalpflege im Rheinland, Bonn
Kay F. Hildebrand European Research Center for Information Systems (ERCIS),
University of M¨unster, M¨unster, Germany,[email protected]
Stefanie Hillebrand Faculty of Statistics TU Dortmund, 44221 Dortmund,
Germany
Paul Hofmarcher Institute for Statistics and Mathematics, WU (Vienna
xvi Contributors
Christine Hohensinn Faculty of Psychology Department of Psychological
Assessment and Applied Psychometrics, University of Vienna, Vienna, Austria, [email protected]
Hajo Holzmann Department of Mathematics and Computer Science, Marburg
University, Marburg, Germany
Fachbereich Math-ematik und Informatik, Philipps-UniversitR Marburg, Hans-Meerweinstr., D-35032 Marburg, Germany,[email protected]. de
Kurt Hornik Institute for Statistics and Mathematics, WU (Vienna University of Economics and Business), Augasse 2-6, 1090 Wien, Austria,[email protected] Eyke H ¨ullermeier Department of Mathematics and Computer Science, Philipps-Universit¨at, 35032 Marburg, Germany,[email protected]
Eugene Kaciak Brock University, St. Catharines, ON, Canada,
Rebecca Klages Institute of Decision Theory and Management Science,
Karl-sruhe Institute of Technology (KIT), Kaiserstr. 12, 76128 KarlKarl-sruhe, Germany, [email protected]
Gerhard Klebe Department of Mathematics and Computer Science,
Philipps-Universit¨at, 35032 Marburg, Germany
Jan Hendrik Kobarg Center for Industrial Mathematics, University of Bremen,
28359 Bremen, Germany,[email protected]
Daniel Krausche Institute of Business Administration and Economics,
Bran-denburg University of Technology Cottbus, Postbox 101344, D-03013 Cottbus, Germany,[email protected]
Klaus D. Kubinger Faculty of Psychology Department of Psychological
Assess-ment and Applied Psychometrics, University of Vienna, Vienna, Austria, [email protected]
Katarzyna Kuziak Department of Financial Investments and Risk Management,
Wroclaw University of Economics, ul. Komandorska 118/120, Wroclaw, Poland, [email protected]
Pierre Legendre Universit´e de Montr´eal, C.P. 6128, succursale Centre-ville, Montr´eal, QC H3C 3J7 Canada,[email protected]
Caterina Liberati Economics Department, University of Milano-Bicocca, P.zza
Ateneo Nuovo n.1, 20126 Milan, Italy,[email protected]
Contributors xvii
Loureiro Sandra Maria Correia Marketing, Operations and General
Management Department, ISCTE-IUL Business School, Av., Forc¸as Armadas, 1649-026 Lisbon, Portugal,[email protected]
Marco Maier Institute for Statistics and Mathematics, WU Vienna
Uni-versity of Economics and Business, Augasse 2-6, 1090 Vienna, Austria, [email protected]
Patrick Mair Institute for Statistics and Mathematics, WU (Vienna University of Economics and Business), Augasse 2-6, 1090 Wien, Austria,[email protected]
Vladimir Makarenkov D´epartement d’Informatique, Universit´e du Qu´ebec `a
Montr´eal, C.P.8888, succursale Centre Ville, Montreal, QC H3C 3P8 Canada, [email protected]
Paolo Mariani Statistics Department, University of Milano-Bicocca, via Bicocca degli Arcimboldi, n.8, 20126 Milan, Italy,[email protected]
Verena Mattern Chair of Algorithm Engineering, TU Dortmund, Dortmund,
Germany,[email protected]
Damien McParland University College Dublin, Dublin, Ireland,
Miguel Angel Mendez-Mendez Universidad Anahuac, Mexico City, Mexico
Hans-Joachim Mucha Weierstrass Institute for Applied Analysis and Stochastics (WIAS), 10117 Berlin, Germany,[email protected]
Ulrich M ¨uller-Funk European Research Center for Information Systems
(ERCIS), University of M¨unster, M¨unster, Germany,[email protected]
Thomas Brendan Murphy School of Mathematical Sciences and Complex
and Adaptive Systems Laboratory, University College Dublin, Dublin 4, Ireland, [email protected]
Robert Nadon Department of Human Genetics, McGill University, 1205
Dr. Penfield Ave., Montreal, QC H3A-1B1 Canada
Akinori Okada Graduate School of Management and Information Sciences, Tama
University, Tokyo, Japan,[email protected]
Michael Ovelg¨onne Information Services and Electronic Markets, IISM,
Karl-sruhe Institute of Technology, Kaiserstrasse 12, D-76128 KarlKarl-sruhe, Germany, [email protected]
Francesco Palumbo Universit`a degli Studi di Napoli Federico II, Naples, Italy, [email protected]
Campo El´ıas Pardo Departamento de Estad´ıstica, Universidad Nacional de
xviii Contributors
Krzysztof Piontek Department of Financial Investments and Risk Management,
Wroclaw University of Economics, ul. Komandorska 118/120, 53-345 Wroclaw, Poland,[email protected]
Surajit Ray Department of Mathematics and Statistics, Boston University, Boston, USA
Manuel Reif Faculty of Psychology Department of Psychological
Assess-ment and Applied Psychometrics, University of Vienna, Vienna, Austria, [email protected]
Marco Riani Dipartimento di Economia, Universit`adi Parma, Parma,
Italy,[email protected]
Adrian Richter Institut f¨ur Medizinische Informationsverarbeitung, Biometrie und Epidemiologie, Universit¨at M¨unchen (LMU), M¨unich, Germany
G ¨unther R¨otter Institute for Music and Music Science, TU Dortmund, Dortmund, Germany,[email protected]
G ¨unter Rudolph Chair of Algorithm Engineering, TU Dortmund, Dortmund,
Germany,[email protected]
Thomas Rusch84 Institute for Statistics and Mathematics, WU Vienna
Uni-versity of Economics and Business, Augasse 2-6, 1090 Vienna, Austria, [email protected]
Anna Rutkowska-Ziarko Faculty of Economic Sciences University of Warmia
and Mazury, Oczapowskiego 4, 10-719 Olsztyn, Poland,[email protected]
Adam Sagan Cracow University of Economics, Krakw, Poland,
Michael Salter-Townshend School of Mathematical Sciences and Complex and
Adaptive Systems Laboratory, University College Dublin, Dublin 4, Ireland, [email protected]
Julia Schiffner Faculty of Statistics Chair of Computational Statistics, TU Dort-mund, 44221 DortDort-mund, Germany,[email protected]
Diana Schindler Department of Business Administration and Economics,
Biele-feld University, Postbox 100131, 33501 BieleBiele-feld, Germany, [email protected]
Ingo Schm¨adecke Institute of Microelectronic Systems, Appelstr. 4, 30167 Han-nover, Germany,[email protected]
Ingo Schmitt Institute of Computer Science, Information and Media Technology, BTU Cottbus, Postbox 101344, D-03013 Cottbus, Germany,[email protected]
Alexandra Schwarz German Institute for International Educational Research,
Contributors xix
Frank Siegmund Heinrich-Heine-Universit¨at D¨usseldorf, D¨usseldorf
Martin Stein Information Services and Electronic Markets, IISM, Karlsruhe
Institute of Technology, Kaiserstrasse 12, D-76128 Karlsruhe, Germany, [email protected]
Veronika Stelz Department of Statistics, LMU Munich, Akademiestr. 1, 80799
Munich, Germany
Dominik Stork KR & KM Research Group, University of Mannheim, Mannheim,
Germany,[email protected]
Heiner Stuckenschmidt KR & KM Research Group, University of Mannheim,
Mannheim, Germany,[email protected]
Mireille Gettler Summa CEREMADE, CNRS, Universit´e Paris Dauphine, Paris,
France,[email protected]
Ali Tayari Department of Computer Science, University of Nicosia, Flat 204,
Democratias 16, 2370 Nicosia, Cyprus,[email protected]
Myriam Th¨ommes Humboldt University of Berlin, Spandauer Str. 1, 10099
Berlin, Germany,[email protected]
Francesca Torti Dipartimento di Economia, Universit`adi Parma, Parma, Italy Dipartimento di Statistica, Universit`a di Milano Bicocca, Milan, Italy, [email protected]
Cristina Tortora Universit`a degli Studi di Napoli Federico II, Naples, Italy
CEREMADE, CNRS, Universit´e Paris Dauphine, Paris, France,
Matthias Trendtel Chair for Methods in Empirical Educational Research, TUM
School of Education, Technische Universit¨at M¨unchen, M¨unchen, Germany, [email protected]
Gerhard Tutz Department of Statistics, LMU Munich, Akademiestr. 1, 80799
Munich, Germany
Ali Unl ¨u¨ Chair for Methods in Empirical Educational Research, TUM
School of Education, Technische Universit¨at M¨unchen, M¨unchen, Germany, [email protected]
Igor Vatolkin Chair of Algorithm Engineering, TU Dortmund, Dortmund,
Ger-many,[email protected];[email protected]
Jeroen K. Vermunt Tilburg University, PO Box 50193, 5000 LE Tilburg, The
Netherlands,[email protected]
Carmen Villar-Pati ˜no Universidad Anahuac, Mexico City, Mexico,
xx Contributors
Sergio B. Villas-Boas Federal University of Rio de Janeiro, Rio de Janeiro, Brazil, [email protected]
Dominique Vincent Institute of Decision Theory and Management Science, Karl-sruhe Institute of Technology (KIT), Kaiserstr. 12, 76128 KarlKarl-sruhe, Germany, [email protected]
Adilson Elias Xavier Federal University of Rio de Janeiro, Rio de Janeiro, Brazil, [email protected]
Vinicius Layter Xavier Federal University of Rio de Janeiro, Rio de Janeiro, Brazil,[email protected]
Sascha Voekler Institute of Business Administration and Economics, Brandenburg University of Technology Cottbus, Postbox 101344, D-03013 Cottbus, Germany, [email protected]
Claus Weihs Faculty of Statistics Chair of Computational Statistics, TU
Dortmund, 44221 Dortmund, Germany, [email protected]; [email protected]
Peter Winker Department of Statistics and Econometrics,
Justus-Liebig-University Giessen, Licher Str. 74, 35394 Giessen, Germany, [email protected]
Christoph Winkler Karlsruhe Institute of Technology (KIT), 76128 Karlsruhe,
Germany,[email protected]
Dominik Wolff Center for Finance and Banking, University of Giessen, Licher
Strasse 74, 35394 Giessen, Germany,[email protected]
Satoru Yokoyama Faculty of Economics Department of Business Administration,
Part I
Size and Power of Multivariate Outlier
Detection Rules
Andrea Cerioli, Marco Riani, and Francesca Torti
Abstract Multivariate outliers are usually identified by means of robust distances. A statistically principled method for accurate outlier detection requires both avail-ability of a good approximation to the finite-sample distribution of the robust distances and correction for the multiplicity implied by repeated testing of all the observations for outlyingness. These principles are not always met by the currently available methods. The goal of this paper is thus to provide data analysts with useful information about the practical behaviour of some popular competing techniques. Our conclusion is that the additional information provided by a data-driven level of trimming is an important bonus which ensures an often considerable gain in power.
1
Introduction
Obtaining reliable information on the quality of the available data is often the first of the challenges facing the statistician. It is thus not surprising that the systematic study of methods for detecting outliers and immunizing against their effect has a long history in the statistical literature. See, e.g.,Cerioli et al.(2011a),Hadi et al. (2009),Hubert et al. (2008) and Morgenthaler(2006) for recent reviews on this topic. We quote fromMorgenthaler(2006, p. 271) that “Robustness of statistical methods in the sense of insensitivity to grossly wrong measurements is probably as old as the experimental approach to science”. Perhaps less known is the fact that
A. Cerioli ()M. Riani
Dipartimento di Economia, Universit`a di Parma, Parma, Italy e-mail:[email protected];[email protected]
F. Torti
Dipartimento di Economia, Universit`a di Parma, Parma, Italy
4 A. Cerioli et al.
similar concerns were also present in the Ancient Greece more than 2,400 years ago, as reported by Thucydides in his History of The Peloponnesian War (III 20): “The Plataeans, who were still besieged by the Peloponnesians and Boeotians, . . . made ladders equal in length to the height of the enemy’s wall, which they calculated by the help of the layers of bricks on the side facing the town . . . A great many counted at once, and, although some might make mistakes, the calculation would be oftener right than wrong; for they repeated the process again and again . . . In this manner they ascertained the proper length of the ladders”.1
With multivariate data outliers are usually identified by means of robust dis-tances. A statistically principled rule for accurate multivariate outlier detection requires:
(a) An accurate approximation to the finite-sample distribution of the robust distances under the postulated model for the “good” part of the data;
(b) Correction for the multiplicity implied by repeated testing of all the observa-tions for outlyingness.
These principles are not always met by the currently available methods. The goal of this paper is to provide data analysts with useful information about the practical behaviour of popular competing techniques. We focus on methods based on alternative high-breakdown estimators of multivariate location and scatter, and compare them to the results from a rule adopting a more flexible level of trimming, for different data dimensions. The present thus extends that of (Cerioli et al. 2011b), where only low dimensional data are considered. Our conclusion is that the additional information provided by a data-driven approach to trimming is an important bonus often ensuring a considerable gain in power. This gain may be even larger when the number of variables increases.
2
Distances for Multivariate Outlier Detection
2.1
Mahalanobis Distances and the Wilks’ Rule
Lety1; : : : ; yn be a sample ofv-dimensional observations from a population with
mean vector and covariance matrix ˙. The basic population model for which most of the results described in this paper were obtained is that
yi N.; ˙ / iD1; : : : ; n: (1)
Size and Power of Multivariate Outlier Detection Rules 5
The sample mean is denoted byO and˙O is the unbiased sample estimate of˙. The Mahalanobis distance of observationyi is
di2D.yi O/0˙O1.yi O/: (2)
For simplicity, we omit the fact thatd2
i is squared and we call it a distance.
Wilks (1963) showed in a seminal paper that, under the multivariate normal model (1), the Mahalanobis distances follow a scaled Beta distribution:
di2 .n1/
Wilks also conjectured that a Bonferroni bound could be used to test outlyingness of the most remote observation without losing too much power. Therefore, for a nominal test size ˛, Wilk’s rule for multivariate outlier identification takes the largest Mahalanobis distance amongd2
1; : : : ; dn2, and compares it to the 1˛=n
quantile of the scaled Beta distribution (3). This gives an outlier test of nominal test size˛.
Wilks’ rule, adhering to the basic statistical principles (a) and (b) of Sect.1, provides an accurate and powerful test for detecting a single outlier even in small and moderate samples, as many simulation studies later confirmed. However, it can break down very easily in presence of more than one outlier, due to the effect of masking. Masking occurs when a group of extreme outliers modifiesO and˙O in such a way that the corresponding distances become negligible.
2.2
Robust Distances
One effective way to avoid masking is to replace O and ˙O in (2) with high-breakdown estimators. A robust distance is then defined as
Q
di2D.yi Q/0˙Q1.yi Q/; (4)
whereQ and˙Q denote the chosen robust estimators of location and scatter. We can expect multivariate outliers to be highlighted by large values ofdQ2
i, even if masked in
the corresponding Mahalanobis distances (2), because nowQ and˙Q are not affected by the outliers.
One popular choice ofQ and˙Q is related to the Minimum Covariance Deter-minant (MCD) criterion (Rousseeuw and Van Driessen 1999). In the first stage, we fix a coveragebn=2c h < nand we define the MCD subset to be the sub-sample of h observations whose covariance matrix has the smallest determinant. The MCD estimator of, sayQ.MCD/, is the average of the MCD subset, whereas
6 A. Cerioli et al.
subset (Pison et al. 2002). A second stage is then added with the aim of increasing efficiency, while preserving the high-breakdown properties ofQ.MCD/and˙Q.MCD/.
Therefore, a one-step reweighting scheme is applied by giving weightwi D 0 to
observations whose first-stage robust distance exceeds a threshold value. Otherwise the weight iswi D 1. We consider the Reweighted MCD (RMCD) estimator of
and˙, which is defined as
serves the purpose of ensuring consistency at the normal model. The resulting robust distances for multivariate outlier detection are then
Q
di.2RMCD/D.yi QRMCD/0˙QRMCD1 .yi QRMCD/ iD1; : : : ; n: (5)
Multivariate S estimators are another common option forQ and˙Q. ForQ 2 <v
and˙Q a positive definite symmetricvvmatrix, they are defined to be the solution of the minimization problemj Q˙j Dmin under the constraint
1
i is given in (4),.x/is a smooth function satisfying suitable regularity and
robustness properties, andDEf.z0z/gfor av-dimensional vectorz N.0; I /. The function in (6) rules the weight given to each observation to achieve robustness. Different specifications of .x/ lead to numerically and statistically different S estimators. In this paper we deal with two such specifications. The first one is the popular Tukey’s Biweight function
.x/D
where c > 0 is a tuning constant which controls the breakdown point of S estimators; seeRousseeuw and Leroy(1987, pp.135–143) andRiani et al.(2012) for details. The second alternative that we consider is the slightly more complex Rocke’s Biflat function, described, e.g., by Maronna et al. (2006, p. 190). This function assigns weights similar to (7) to distance values close to the median, but null weights outside a user-defined interval. Specifically, let
Size and Power of Multivariate Outlier Detection Rules 7
where2
v;.1 / is the1 quantile of2v. Then, the weight under Rocke’s Biflat
function is 0 whenever a normalized version of the robust distancedQ2
i is outside the
intervalŒ1; 1C. This definition ensures better performance of S estimators when vis large. Indeed, it can be proved (Maronna et al. 2006, p. 221) that the weights assigned by Tukey’s Biweight function (7) become almost constant as
v! 1. Therefore, robustness of multivariate S estimators is lost in many practical situations wherevis large. Examples of this behaviour will be seen in Sect.3.2even forvas small as 10.
Given the robust, but potentially inefficient, S estimators of and ˙, an improvement in efficiency is sometimes advocated by computing refined location and shape estimators which satisfy a more efficient version of (6) (Salibian-Barrera et al. 2006). These estimators, called MM estimators, are defined as the minimizers of
and the function.x/provides higher efficiency than.x/at the null model (1). Minimization of (9) is performed over allQQ 2 <vand all˙QQ belonging to the set
of positive definite symmetricvvmatrices withj QQ˙j D 1. The MM estimator of is then QQ, while the estimator of ˙ is a rescaled version of ˙QQ. Practical implementation of MM estimators is available using Tukey’s Biweight function only (Todorov and Filzmoser 2009). Therefore, we follow the same convention in the performance comparison to be described in Sect.3.
2.3
The Forward Search
The idea behind the Forward Search (FS) is to apply a flexible and data-driven trimming strategy to combine protection against outliers and high efficiency of estimators. For this purpose, the FS divides the data into a good portion that agrees with the postulated model and a set of outliers, if any (Atkinson et al. 2004). The method starts from a small, robustly chosen, subset of the data and then fits subsets of increasing size, in such a way that outliers and other observations not following the general structure are revealed by diagnostic monitoring. Letm0 be the size of
the starting subset. Usuallym0DvC1or slightly larger. LetS.m/be the subset of
data fitted by the FS at stepm(m D m0; : : : ; n), yielding estimates.m/O ,˙ .m/O
and distances
O
8 A. Cerioli et al.
These distances are ordered to obtain the fitting subset at stepmC1. WhilstS.m/ remains outlier free, they will not suffer from masking.
The main diagnostic quantity computed by the FS at stepmis
O
di2min.m/W iminDarg mindOi2.m/ fori…S.m/; (11)
i.e. the distance of the closest observation toS.m/, among those not belonging to this
subset. The rationale is that the robust distance of the observation entering the fitting subset at stepmC1will be large if this observation is an outlier. Its peculiarity will then be revealed by a peak in the forward plot ofd2
imin.m/.
All the FS routines, as well as the algorithms for computing most of the com-monly adopted estimators for regression and multivariate analysis, are contained in the FSDA toolbox for MATLAB and are freely downloadable fromhttp://www. riani.it/MATLABor from the web site of the Joint Research Centre of the European Commission. This toolbox also contains a series of dynamic tools which enable the user to link the information present in the different plots produced by the FS, such as the index or forward plot of robust Mahalanobis distancesdOi2.m/and the scatter plot matrix; seePerrotta et al.(2009) for details.
3
Comparison of Alternative Outlier Detection Rules
Precise outlier identification requires cut-off values for the robust distances when model (1) is true. If Q D QRMCD and ˙Q D Q˙RMCD, Cerioli et al. (2009) show
that the usually trusted asymptotic approximation based on the2
v distribution can
be largely unsatisfactory. Instead,Cerioli(2010) proposes a much more accurate approximation based on the distributional rules
Q
wherewi andw are defined as in Sect.2.2.Cerioli and Farcomeni(2011) show
how the same distributional results can be applied to deal with multiplicity of tests to increase power and to provide control of alternative error rates in the outlier detection process.
In the context of the Forward Search,Riani et al.(2009) propose a formal outlier test based on the sequencedO2
imin.m/,mDm0; : : : ; n1, obtained from (11). In this test, the values ofdO2
imin.m/are compared to the FS envelope
Size and Power of Multivariate Outlier Detection Rules 9
whereV2
m;˛ is the100˛% cut-off point of the .mC1/th order statistic from the
scaledF distribution
The flexible trimming strategy enjoyed by the FS ensures a balance between the two enemy brothers of robust statistics: robustness against contamination and efficiency under the postulated multivariate normal model. This makes the Forward Search a valuable benchmark against which alternative competitors should be compared. On the other hand, very little is known about the finite sample behaviour of the outlier detection rules which are obtained from the multivariate S and MM estimators summarized in Sect.2.2. In the rest of this section, we thus explore the performance of the alternative rules with both “good” and contaminated data, under different settings of the required user-defined tuning constants. We also provide comparison with power results obtained with the robust RMCD distances (5) and with the flexible trimming approach given by the FS.
3.1
Size
Size estimation is performed by Monte Carlo simulation of data sets generated from thev-variate normal distributionN.0; I /, due to affine invariance of the robust distances (4). The estimated size of each outlier detection rule is defined to be the proportion of simulated data sets for which the null hypothesis of no outliers, i.e. the hypothesis that allnobservations follow model (1), is wrongly rejected. For S and MM estimation, the finite sample null distribution of the robust distancesdQ2
i is
unknown, even to a good approximation. Therefore, these distances are compared to the1˛=nquantile of their asymptotic distribution, which is2
v. As in the Wilks’
rule of Sect.2.1, the Bonferroni correction ensures that the actual size of the test of no outliers will be bounded by the specified value of˛if the2
vapproximation is
adequate.
In our investigation we also evaluate the effect on empirical test sizes of each of some user-defined tuning constants required for practical computation of multivariate S and MM estimators. See, e.g., Todorov and Filzmoser (2009) for details. Specifically, we consider:
• bdp: breakdown point of the S estimators, which is inherited by the MM estimators as well (the default value is 0.5);
10 A. Cerioli et al.
• effshape2: dummy variable setting whether efficiency of the MM estimators is defined with respect to shape (effshapeD1) or to location (effshapeD0, the default value);
• nsamp: number of sub-samples of dimension.pC1/in the resampling algorithm for fast computation of S estimators (our default value is 100);
• refsteps: maximum number of iterations in the Iterative Reweighted Least
Squares algorithm for computing MM estimators (our default value is 20); • gamma: tail probability in (8) for Rocke’s Biflat function (the default value
is 0.1).
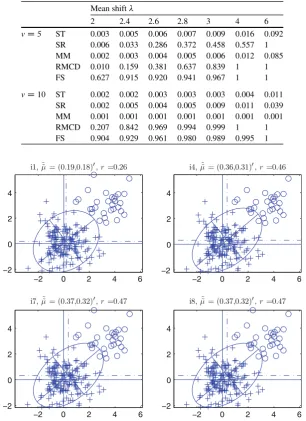
Tables1and2report the results fornD200,vD5andvD10, when˛D0:01 is the nominal size for testing the null hypothesis of no outliers and 5,000 independent data sets are generated for each of the selected combinations of parameter values. The outlier detection rule based on S estimators with Tukey’s Biweight function (7) is denoted by ST. Similarly, SR is the S rule under Rocke’s Biflat function. It is seen that the outlier detection rules based on the robust S and MM distances with Tukey’s Biweight function can be moderately liberal, but with estimated sizes often not too far from the nominal target. As expected, liberality is an increasing function of dimension and of the breakdown point, both for S and MM estimators. Efficiency of the MM estimators (eff) is the only tuning constant which seems to have a major impact on the null behaviour of these detection rules. On the other hand, SR has the worst behaviour under model (1) and its size can become unacceptably high, especially whenvgrows. As a possible explanation, we note that a number of observations having positive weight under ST receive null weight with SR (Maronna et al. 2006, p. 192). This fact introduces a form of trimming in the corresponding estimator of scatter, which is not adequately taken into account. The same result also suggests that better finite-sample approximations to the null distribution of the robust distancesdQ2
i with Rocke’s Biflat function are certainly
worth considering.
3.2
Power
We now evaluate the power of ST, SR and MM multivariate outlier detection rules. We also include in our comparison the FS test ofRiani et al.(2009), using (14), and the finite-sample RMCD technique ofCerioli(2010), relying on (12) and (13). These additional rules have very good control of the size of the test of no outliers even for sample sizes considerably smaller thannD 200, thanks to their accurate cut-off values. Therefore, we can expect a positive bias in the estimated power of all the procedures considered in Sect.3.1, and especially so in that of SR.
S
iz
e
an
d
P
o
w
er
o
f
Mu
lti
v
ar
ia
te
O
u
tlie
r
D
et
ec
tio
n
R
u
le
s
1
1
Table 1 Estimated size of the test of the hypothesis of no outliers for n D 200and nominal test size˛ D 0:01. ST is the
outlier detection rule based on S estimators with Tukey’s Biweight function (7); MM is the rule based on MM estimators, using
again Tukey’s Biweight function (7). Five thousand independent data sets are generated for each of the selected combinations of
parameter values
all parameters bdp eff effshape nsamp refsteps
at default value 0.15 0.25 0.8 0.98 0 10 500 10 500
vD5 ST 0.023 0.010 0.014 0.023 0.023 0.023 0.026 0.024 0.023 0.023
MM 0.021 0.019 0.020 0.023 0.015 0.023 0.021 0.020 0.022 0.023
vD10 ST 0.033 0.005 0.007 0.033 0.033 0.033 0.031 0.036 0.033 0.033
MM 0.038 0.035 0.028 0.068 0.019 0.038 0.029 0.030 0.034 0.036
12 A. Cerioli et al.
Table 2 Estimated size of the test of the hypothesis of no outliers fornD200and nominal test size˛D0:01, using S estimators with Rocke’s Biflat function (SR), for different values of in (8). Five thousand independent data sets are generated for each of the selected combinations of parameter values
gamma
0.15 0.10 0.05 0.025 0.01 0.001
vD5 0.066 0.057 0.055 0.056 0.056 0.061 vD10 0.089 0.080 0.079 0.078 0.077 0.081
Average power of an outlier detection rule is defined to be the proportion of contaminated observations rightly named to be outliers. We estimate it by simulation, in the case n D 200and forv D 5 andv D 10. For this purpose, we generatev-variate observations from the location-shift contamination model
yi .1ı/N.0; I /CıN.0Ce; I /; iD1; : : : ; n; (16)
where0 < ı < 0:5is the contamination rate,is a positive scalar andeis a column vector of ones. The0:01=nquantile of the reference distribution is our cut-off value for outlier detection. We only consider the default choices for the tuning constants in Tables1and2, given that their effect under the null has been seen to be minor. We base our estimate of average power on 5,000 independent data sets for each of the selected combinations of parameter values.
It is worth noting that standard clustering algorithms, likeg-means, are likely to fail to separate the two populations in (16), even in the ideal situation where there is a priori knowledge thatg D 2. For instance, we have run a small benchmark study withnD 200,vD5and two overlapping populations by settingD2and ı D 0:05in model (16). We have found that the misclassification rate ofg-means can be as high as 25 % even in this idyllic scenario where the true value ofg is known and the covariance matrices are spherical. The situation obviously becomes much worse whengis unknown and must be inferred from the data. Furthermore, clustering algorithms based on Euclidean distances, like g-means, are not affine invariant and would thus provide different results on unstandardized data.
Size and Power of Multivariate Outlier Detection Rules 13
Table 3 Estimated average power for different shiftsin the contamination model (16), in the casenD200,vD5andvD10, when the contamination rateıD0:05. Five thousand independent data sets are generated for each of the selected combinations of parameter values
Mean shift
2 2.2 2.4 2.6 2.8 3
vD5 ST 0.344 0.525 0.696 0.827 0.912 0.963
SR 0.387 0.549 0.698 0.820 0.908 0.957 MM 0.148 0.280 0.466 0.672 0.836 0.935 RMCD 0.227 0.390 0.574 0.732 0.856 0.936 FS 0.359 0.567 0.730 0.840 0.909 0.953
vD10 ST 0.758 0.919 0.978 0.995 0.999 1
SR 0.856 0.946 0.986 0.997 0.999 1
MM 0.479 0.782 0.942 0.990 0.998 1
RMCD 0.684 0.839 0.956 0.987 0.997 1
FS 0.808 0.911 0.968 0.991 0.998 1
Table 4 Quantities as in Table3, but now forıD0:15 Mean shift
2 2.4 2.6 2.8 3 3.4
vD5 ST 0.073 0.532 0.772 0.901 0.960 0.996 SR 0.275 0.433 0.594 0.742 0.854 0.925 MM 0.006 0.010 0.012 0.016 0.026 0.397 RMCD 0.096 0.428 0.652 0.815 0.913 0.988 FS 0.580 0.803 0.878 0.935 0.965 0.993
vD10 ST 0.006 0.007 0.008 0.01 0.013 0.041 SR 0.696 0.825 0.895 0.923 0.931 0.946 MM 0.001 0.001 0.001 0.001 0.003 0.030 RMCD 0.530 0.938 0.959 0.993 1 1 FS 0.887 0.938 0.974 0.991 0.998 1
14 A. Cerioli et al.
Table 5 Quantities as in Table3, but now forıD0:30 Mean shift
2 2.4 2.6 2.8 3 4 6
vD5 ST 0.003 0.005 0.006 0.007 0.009 0.016 0.092 SR 0.006 0.033 0.286 0.372 0.458 0.557 1 MM 0.002 0.003 0.004 0.005 0.006 0.012 0.085 RMCD 0.010 0.159 0.381 0.637 0.839 1 1 FS 0.627 0.915 0.920 0.941 0.967 1 1
vD10 ST 0.002 0.002 0.003 0.003 0.003 0.004 0.011 SR 0.002 0.005 0.004 0.005 0.009 0.011 0.039 MM 0.001 0.001 0.001 0.001 0.001 0.001 0.001 RMCD 0.207 0.842 0.969 0.994 0.999 1 1 FS 0.904 0.929 0.961 0.980 0.989 0.995 1
−2 0 2 4 6
Fig. 1 Ellipses corresponding to 0.95 probability contours at different iterations of the algorithm for computing multivariate MM estimators, for a data set simulated from the contamination model (16) withnD200,vD2,ıD0:15andD3
Size and Power of Multivariate Outlier Detection Rules 15
Fig. 2 Index plots of robust scale residuals obtained using MM estimation with a preliminary S-estimate of scale based on a 50 % breakdown point.Left-hand panel: 90 % nominal efficiency; right-hand panel: 95 % nominal efficiency. Thehorizontal linescorrespond to the 99 % individual and simultaneous bands using the standard normal
of the parameter estimates and can contribute to masking in the supposedly robust distances (10).
A similar effect can also be observed with univariate (vD1) data. For instance, Atkinson and Riani(2000, pp. 5–9) andRiani et al.(2011) give an example of a regression dataset with 60 observations on three explanatory variables where there are six masked outliers (labelled 9, 21 30, 31, 38 47) that cannot be detected using ordinary diagnostic techniques. The scatter plot of the response against the three explanatory variables and the traditional plot of residuals against fitted values, as well as theqqplot of OLS residuals, do not reveal observations far from the bulk of the data. Figure2shows the index plots of the scaled MM residuals. In the left-hand panel we use a preliminaryS estimate of scale with Tukey’s Biweight function (7) and 50 % breakdown point, and 90 % efficiency in the MM step under the same function. In the right-hand panel we use the same preliminary scale estimate as before, but the efficiency is 95 %. As the reader can see, these two figures produce a very different output. While the plot on the right (which is similar to the masked index plot of OLS residuals) highlights the presence of a unit (number 43) which is on the boundary of the simultaneous confidence band, only the plot on the left (based on a smaller efficiency) suggests that there may be six atypical units (9, 21 30, 31, 38 47), which are indeed the masked outliers.
4
Conclusions
16 A. Cerioli et al.
show that the actual size of the outlier tests based on multivariate S and MM estimators using Tukey’s Biweight function and relying on the 2
v distribution is
larger than the nominal value, but the extent of the difference is often not dramatic. The effect of the many tuning constants required for their computation is also seen to be minor, except perhaps efficiency in the case of MM estimators. Therefore, when applied to uncontaminated data, these rules can be considered as a viable alternative to multivariate detection methods based on trimming and requiring more sophisticated distributional approximations.
However, smoothness of Tukey’s Biweight function becomes a trouble when power is concerned, especially if the contamination rate is large and the number of dimensions grows. In such instances our simulations clearly show the advantages of trimming over S and MM estimators. In particular, the flexible trimming approach ensured by the Forward Search is seen to greatly outperform the competitors, even the most liberal ones, in almost all our simulation scenarios and is thus to be recommended.
Acknowledgements The authors thank the financial support of the project MIUR PRIN MISURA - Multivariate models for risk assessment.
References
Atkinson, A. C., & Riani, M. (2000).Robust diagnostic regression analysis. New-York: Springer. Atkinson, A. C., Riani, M., & Cerioli, A. (2004).Exploring multivariate data with the forward
search. New York: Springer.
Cerioli, A. (2010). Multivariate outlier detection with high-breakdown estimators.Journal of the American Statistical Association, 105, 147–156.
Cerioli, A., & Farcomeni, A. (2011). Error rates for multivariate outlier detection.Computational Statistics and Data Analysis, 55, 544–553.
Cerioli, A., Riani, M., & Atkinson, A. C. (2009). Controlling the size of multivariate outlier tests with the MCD estimator of scatter.Statistics and Computing, 19, 341–353
Cerioli, A., Atkinson, A. C., & Riani, M. (2011a). Some perspectives on multivariate outlier detection. In S. Ingrassia, R. Rocci, & M. Vichi (Eds.),New perspectives in statistical modeling and data analysis(pp. 231–238). Berlin/Heidelberg: Springer.
Cerioli, A., Riani, M., & Torti, F. (2011b). Accurate and powerful multivariate outlier detection. 58th congress of ISI, Dublin.
Hadi, A. S., Rahmatullah Imon, A. H. M., & Werner, M. (2009). Detection of outliers.WIREs Computational Statistics, 1, 57–70.
Hubert, M., Rousseeuw, P. J., & Van aelst, S. (2008). High-breakdown robust multivariate methods. Statistical Science, 23, 92–119.
Maronna, R. A., Martin, D. G., & Yohai, V. J. (2006).Robust statistics. New York: Wiley. Morgenthaler, S. (2006). A survey of robust statistics.Statistical Methods and Applications, 15,
271–293 (Erratum 16, 171–172).
Perrotta, D., Riani, M., & Torti, F. (2009). New robust dynamic plots for regression mixture detection.Advances in Data Analysis and Classification, 3, 263–279.
Size and Power of Multivariate Outlier Detection Rules 17
Riani, M., Atkinson, A. C., & Cerioli, A. (2009). Finding an unknown number of multivariate outliers.Journal of the Royal Statistical Society B, 71, 447–466.
Riani, M., Torti, F., & Zani, S. (2011). Outliers and robustness for ordinal data. In R. S. Kennet & S. Salini (Eds.),Modern analysis of customer satisfaction surveys: with applications using R. Chichester: Wiley.
Riani, M., Cerioli, A., & Torti, F. (2012). A new look at consistency factors and efficiency of robust scale estimators. Submitted.
Rousseeuw, P. J., & Leroy, A. M. (1987).Robust regression and outlier detection. New York: Wiley.
Rousseeuw, P. J. & Van Driessen, K. (1999). A fast algorithm for the minimum covariance determinant estimator.Technometrics, 41, 212–223.
Salibian-barrera, M., Van Aelst, S., & Willems, G. (2006). Principal components analysis based on multivariate mm estimators with fast and robust bootstrap.Journal of the American Statistical Association, 101, 1198–1211.
Todorov, V., & Filzmoser, P. (2009). An object-oriented framework for robust multivariate analysis. Journal of Statistical Software, 32, 1–47.
Clustering and Prediction of Rankings
Within a Kemeny Distance Framework
Willem J. Heiser and Antonio D’Ambrosio
Abstract Rankings and partial rankings are ubiquitous in data analysis, yet there is relatively little work in the classification community that uses the typical properties of rankings. We review the broader literature that we are aware of, and identify a common building block for both prediction of rankings and clustering of rankings, which is also valid for partial rankings. This building block is the Kemeny distance, defined as the minimum number of interchanges of two adjacent elements required to transform one (partial) ranking into another. The Kemeny distance is equivalent to Kendall’sfor complete rankings, but for partial rankings it is equivalent to Emond and Mason’s extension of. For clustering, we use the flexible class of methods proposed by Ben-Israel and Iyigun (Journal of Classification 25: 5–26, 2008), and define the disparity between a ranking and the center of cluster as the Kemeny distance. For prediction, we build a prediction tree by recursive partitioning, and define the impurity measure of the subgroups formed as the sum of all within-node Kemeny distances. The median ranking characterizes subgroups in both cases.
1
Introduction
Ranking and classification are basic cognitive skills that people use every day to create order in everything that they experience. Many data collection methods in the life and behavioral sciences often rely on ranking and classification. Grouping and ordering a set of elements is also a major communication and action device in social
W.J. Heiser ()
Institute of Psychology, Leiden University, 2300 RB Leiden, The Netherlands e-mail:[email protected]
A. D’Ambrosio
Department of Industrial Engineering, University of Naples Federico II, Piazzale Tecchio, 80125, Naples, Italy
e-mail:[email protected]
B. Lausen et al. (eds.),Algorithms from and for Nature and Life, Studies in Classification, Data Analysis, and Knowledge Organization, DOI 10.1007/978-3-319-00035-0 2, © Springer International Publishing Switzerland 2013
20 W.J. Heiser and A. D’Ambrosio
life, as is clear when we consider rankings of sport-teams, universities, countries, web-pages, French wines, and so on. Not surprisingly, the literature on rankings is scattered across many fields of science.
Statistical methods for the analysis of rankings can be distinguished in (1) data analysis methods based on badness-of-fit functions that try to describe the structure of rank data, (2) probabilistic methods that model the ranking process, and assume substantial agreement (orhomogeneity) among the rankers about the underlying order of the rankings, and (3) probabilistic methods that model the population of rankers, assuming substantial disagreement (orheterogeneity) between them. Let us look at each of these in turn.
Two examples of data analysis methods based on badness-of-fit functions that have been applied to rankings are principal components analysis (PCA, see Cohen and Mallows1980; Diaconis1989; Marden1995, Chap. 2), and multidimensional scaling (MDS) or unfolding (Heiser and de Leeuw1981; Heiser and Busing2004). In psychometrics, PCA on rankings was justified by what is called thevector model for rankings,going back to the independent contributions of Guttman (1946); Slater (1960) and Tucker (1960) and popularized by Carroll (1972, pp. 114–129) through his MDPREF method. It is also possible to perform a principal components analysis while simultaneously fitting some optimal transformation of the data that preserves the rank order (in a program called CATPCA, cf. Meulman et al.2004). By contrast, the unfolding technique is based on the ideal point model for rankings, which originated with Coombs (1950,1964, Chaps. 5–7), but his analytical procedures were only provisional and had been soon superseded by MDS methods (Roskam 1968; Kruskal and Carroll 1969). Unfortunately, however, MDS procedures for ordinal unfolding tended to suffer from several degeneracy problems for a long time (see Van Deun2005; Busing2009for a history of these difficulties and state-of-the-art proposals to resolve them). One of these proposals, due to Busing et al. (2005), is available under the name PREFSCAL in the IBM-SPSS Statistics package.
Probabilistic modeling for the ranking process assuming homogeneity of rankers started with Thurstone (1927, 1931), who proposed that judgments underlying rank orders follow a multivariate normal distribution with location parameters corresponding to each ranked object. Daniels (1950) looked at cases in which the random variables associated with the ranked objects are independent. Examples of more complexThurstonian modelsinclude B¨ockenholt (1992), Chan and Bentler (1998), Maydeu-Olivares (1999) and Yao and B¨ockenholt (1999). A second class of models assuming homogeneity of rankers started with Mallows (1957), and was also based upon a process in which pairs of objects are compared, but now according to the Bradley-Terry-Luce (BTL) model (Bradley and Terry1952; Luce 1959), thus excluding intransitivities. These probability models amount to a negative exponential function of some distance between rankings, for example the distance related to Kendall’s(see Sect.3); hence their namedistance-based ranking models
Clustering and Prediction of Rankings Within a Kemeny Distance Framework 21
their namemultistage models(Fligner and Verducci1988). We refer to Critchlow et al. (1991) for an in-depth discussion of all of these models. Critchlow and Fligner (1991) demonstrated how both the Thurstonean models and the multistage BTL models can be seen as generalized linear models and be fitted with standard software.
Probabilistic models for the population of rankers assuming substantial hetero-geneity of their rankings are of at least three types. First, there are probabilistic versions of the ideal point model involving choice data (Zinnes and Griggs 1974; Kamakura and Srivastava 1986), or rankings (Brady 1989; Van Blokland-Vogelesang1989; Hojo1997,1998). Second, instead of assuming one probabilistic model for the whole population, we may move to (unknown) mixtures of subpop-ulations, characterized by different parameters. For example, mixtures of models of the BTL type were proposed by Croon (1989), and mixtures of distance-based models by Murphy and Martin (2003). Gormley and Murphy (2008a) provided a very thorough implementation of two multistage models with mixture components. Third, heterogeneity of rankings can also be accounted for by the introduction of covariates, from which we can estimate mixtures of known subpopulations. Examples are Chapman and Staelin (1982), Dittrich et al. (2000), B¨ockenholt (2001), Francis et al. (2002), Skrondal and Rabe-Hesketh (2003), and Gormley and Murphy (2008b). All of these authors use the generalized linear modeling framework.
Most methods that are mainstream in the classification community follow the first approach, that is, they use an algorithm model (e.g., hierarchical clustering, construction of phylogenetic trees), or try to optimize some badness-of-fit function (e.g., K-means, fuzzy clustering, PCA, MDS). Some of them analyze a rank ordering of dissimilarities, which makes the results order-invariant, meaning that order-preserving transformations of the data have no effect. However, there are very few proposals in the classification community directly addressing clustering of multiple rankings, or prediction of rankings based on explanatory variables characterizing the source of them (covariates). Our objective is to fill this gap, and to catch up with the statisticians.1
Common to all approaches is that they have to deal with the sample space of rankings, which has a number of very specific properties. Also, most methods either implicitly or explicitly use some measure of correlation or distance among rankings. Therefore, we start our discussion with a brief introduction in the geometry of rankings in Sect. 2, and how it naturally leads to measures of correlation and distance in Sect.3. We then move to the median ranking in Sect.4, give a brief sketch in Sect.5of how we propose to formulate a clustering procedure and to build a prediction tree for rankings, and conclude in Sect.6.
22 W.J. Heiser and A. D’Ambrosio
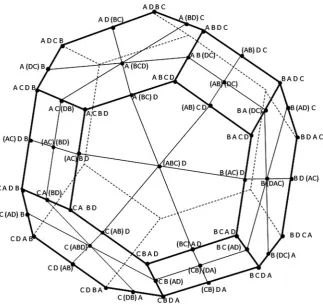
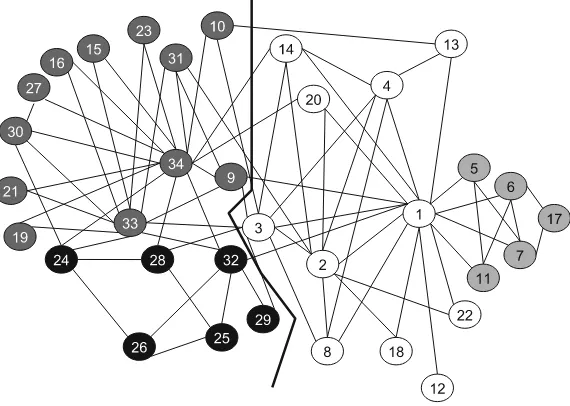
Fig. 1 Permutation polytope for all 24 full rankings of four objects, supplemented by all partial rankings with one tie-block of two or three objects, or two tie-blocks of two objects. Full rankings have equal distance towards the center; partial rankings lie strictly within this sphere. For clarity, mirror images at the back of the polytope are not labeled
2
Geometry of Rankings
The 24 full rankings that can be formed from four objects form a permutation polytope that has the shape of a truncated octahedron (cf. Thompson1993; Heiser 2004). Thompson offered an thorough study of the permutation structure of partial rankings, showing that the 12 partial rankings with a tie in last position form a truncated tetrahedron, as do the 12 partial rankings with a tie in first position. The 12 partial rankings with a tie in middle position, however, are the intersection of a cube and an octahedron, forming a cuboctahedron. Then there are six partial rankings with two tie-blocks forming an octahedron, and finally four partial rankings with tie-blocks of three in last position or in first position, each forming a tetrahedron.