Welfare generosity and location choices among new
United States immigrants
Marvin E. Dodson III
Institute for Economic Advancement University of Arkansas at Little Rock 2801 S. University Avenue Little Rock, AR 72204-1099
Abstract
This paper extends the limited research that investigates the determinants of location choices among new United States immigrants. Unlike previous work, this study employs data that includes country of birth, major categories of admission, and state of intended residence for each new immigrant. Additionally, due to censoring concerns in immigration data this study uses a Tobit estimation technique. The results suggest significant correlation between immigrant inflow and welfare generosity. Furthermore, the welfare motivation seems to be equally pervasive in every major category of admission among new immigrants. © 2001 Elsevier Science Inc. All rights reserved.
1. Introduction
A back and forth legislative battle has developed over immigrant eligibility in public assistance programs in the recent past. The Personal Responsibility and Work Opportunity Reconciliation Act of 1996 (P.L. 104-193) (PRWORA) tightened eligibility requirements for both immigrants and natives in most income assistance programs. Under this legislation, most immigrants were barred from federal income assistance programs for the first five years of residence. Further, individual states were given the power to determine eligibility beyond this exclusionary period. Recent reversals of these requirements have proceeded rather covertly. The Agricultural Research, Extension and Education Reform Act of 1998 (P.L. 105-185)1readmitted 250,000
I would like to thank Clifford Hawley, Brian Cushing, Stratford Douglas, George Hammond, Sudeshna Bandyopadhyay, Thomas Garrett, Victor Claar, Gary Wagner, and Mark Kepple for helpful comments. Also two anonymous referees provided suggestions which improved this paper.
1
7 U.S.C. § 2014, § 2015(f).
International Review of Law and Economics 21 (2001) 47– 67
legal immigrants to the food stamp program who were excluded under the 1996 law. The Balanced Budget Act of 1997 restored $11.5 billion in supplemental security income benefits to similarly excluded legal immigrants. The courts have also set the outer bounds on state power with regard to PRWORA. The United States Supreme Court struck down attempts by
California to limit welfare payments to new residents in the case of Saenz v. Roe.2
California’s policy targeted all new state residents, whether native or immigrant. Fourteen other states had similar laws.
Although PROWRA allows states to push most new legal immigrants off the welfare rolls, most have not.3Not only have these states maintained TANF4payments to immigrants out of state budgets but most are or are expected to incorporate immigrants who arrived after the reform date once their exclusionary period ends. No doubt, this generosity is due in large part to the current economic expansion. When state tax revenues become more scarce, states will inevitably revisit the issue of immigrant participation in public assistance programs.
Federal guidelines identify four major categories of immigrant admissions. They are imme-diate relatives of U.S. citizens, family-sponsored immigrants, employment-based immigrants, and refugees and asylees. Eligibility criteria for assistance among these groups differ slightly.5 For example, Amerasian, Cuban, and Haitian immigrants regardless of admission category are exempt from most PROWRA restrictions. Refugees and asylees also face less stringent eligibility requirements. While these exceptions exist, as a whole all permanent legal residents were eligible for welfare in the same manner as citizens prior to PROWRA. Consequently, the new restrictions in PROWRA are fairly uniform across all immigrant categories.
Several studies have attempted to measure the use of transfer payments by immigrants. Borjas and Hilton (1996) are the most cited example. In their results, an immigrant house-hold’s probability of receiving any type of assistance was 26.1 percent in the 1990-91 period while the native probability was 16.3 percent. Further, the average number of months that an immigrant remained on welfare was 9.5 while natives collected benefits for only 7.8 months.6 The important distinction illuminated in this study is the difference in participation rates between cash and non-cash benefit programs. While immigrants and natives appear similar in their usage of cash programs, their usage diverges when programs such as Medicaid, food stamps, and housing allowances are considered.
Interestingly, Baker and Benjamin (1993) find the opposite result for recent immigrants to Canada. Buckley (1996) argues this result is due to a more effective screening process in Canada that emphasizes marketable skills.7McCarthy and Vernez (1997) find that immigrant participation in California’s welfare programs is slightly less than that found by Borjas and
2
Saenz v. Roe, 119 S.Ct. 1518, 143 L.Ed.2d 689, 67 USLW 4291 (1999).
3
See “Welfare Reform–Implications of Proposals on Legal Immigrants’ Benefits,” GAO/HEHS-98-132, July 1998 for a discussion of the legislation that altered eligibility requirements for immigrants and the response of states to these changes.
4
Temporary Assistance to Needy Families (TANF) replaced Aid to Families with Dependent Children (AFDC) as a result of PROWRA.
5
See the GAO report cited above for details on the requirements.
6
Borjas and Hilton (1996), pages 580 and 588.
7
Hilton. Hu (1996) maintains that increased welfare participation among immigrants is concentrated among the elderly. He finds that new immigrants arriving after age fifty-five are more likely to enter assistance programs than similar natives and younger immigrants.
Much work has been done on migration within the United States. Examples include Greenwood (1975), Graves and Linneman (1979), Graves and Knapp (1988), and Dresher (1994). In these models migration depends upon the public and private economic cost and benefits associated with relocation. More recently Conway and Houtenville (1998, 1998b, 1998c) find that the elderly population is attracted to states whose tax and expenditure policies treat them favorably. Blank (1988) inspects the movement patterns of low income female headed households. She finds that these households are more likely to leave low welfare payment and low wage areas. Gramlich and Laren (1984) find that households in general who are moving are more likely to locate in a state that has higher AFDC benefits. Dunlevy (1991) researches the immigrant population. He shows that the new immigrant population in a state is positively related to the state’s immigrant stock. He does not consider welfare generosity. Bartel (1989) supports Dunlevy’s results by finding that the stock of similarly born immigrants is the major incentive in immigrant location decisions.
Buckley (1996) investigates the determinants of location for new U.S. immigrants according to their admission category and state of intended residence, using a panel for the years 1985 to 1991. His data does not allow for disaggregation of the dependent variable according to nativity or place of birth. Therefore, he uses the percent of the state’s population that is foreign born, regardless of nativity, as an independent variable. The results suggest that there is significant welfare motivation in immigrant location choices. In addition, his results imply that less gener-osity in welfare payments will not only reduce total immigration, but raise the skill level of the immigrant inflow since employment-based immigrants are less responsive to welfare.
Zavodny (1997, 1998) examines the determinants of immigrant locations in a panel for fiscal years 1982 and 1992. The dependent variable is the total number of immigrants from individual countries to individual states. She does not consider differences across admission categories. According to Zavodny (1997), the presence of immigrants from the same country of birth is the determining factor in location choices and that welfare generosity plays no part. She concludes that Buckley’s (1996) welfare motivation results are biased upwards because he uses the total foreign-born population and not the population according to country of birth as an independent variable. In a more recent study, Borjas (1999) finds that immigrants do cluster in states with higher welfare payments. In fact, he finds that the distribution of immigrants among the states is statistically different from the distribution of relocating natives. Furthermore, welfare generosity appears to be a good predictor of this distribution.
2. A new model of immigrant location choice
This new model of immigrant location choice has two important advantages over Buckley (1996) and Zavodny (1997). First, the data in this specification are more complete and include more detailed characteristics for each immigrant. With these data the welfare motivation in location decisions found by Buckley (1996) and the nativity incentive found by Zavondy (1997) can be tested simultaneously. Second, unlike the ordinary least squares
49
method of estimation used by both of the previous authors, this model employs the more appropriate technique of Tobit estimation.
This model like those of Buckley (1996) and Zavodny (1997), maintains that an immigrant will choose the utility maximizing location. Eq. (1) states that the probability of individual i choosing the location k in period t conditional on his location j in period t - 1 is equal to the probability that location k in period t is the utility maximizing choice. This conditional probability is the basis for estimation.
Pr~kit/jit21!5Pr~Uijkt5MAX~Uij1t,Uij2t, . . .. . .UijNt!! (1)
The use of frequencies leads to the basic model in equation (2).
Iijk5a 1Xkb 1Njkd 1Dg 1 eijk (2)
I is a vector of immigrants indexed by class i, source country j, and intended state of
residence k. X is a matrix of state specific economic factors. N is a matrix of nativity factors.
D is a matrix of dummies that attempts to describe possible ports of entry and proxy for
moving costs.
Eq. (2) is the same form of regression used by Buckley (1996) and Zavodny (1997) with the exception of an added disaggregation of the data. The equation simply states that the number of people who found location k to be their utility maximizing choice depends upon the state and source country factors of all the possible choices. The decision to immigrate and the location choice is not separable in this model. Rather, the choice of residence is viewed as a set of alternatives within the decision to migrate. Separating the decision to migrate from the choice of residence would indicate that the dependent variable should be the percentage of immigrants from each country who locate in each state. Zavodny (1997) performs the analysis with both levels and percentages and finds no difference in results.
The index i indicates the category of admission (family sponsored, immediate relatives, employment based, refugees). The country of origin is indicated by the subscript j. There are twenty-one countries of origin in the sample.8 These twenty-one countries accounted for 83.9% of total immigration in fiscal year 1991 and 75.2% in fiscal year 1992. The subscript k indicates the forty-nine possible location choices. They include all the continental states of the United States plus the District of Columbia.
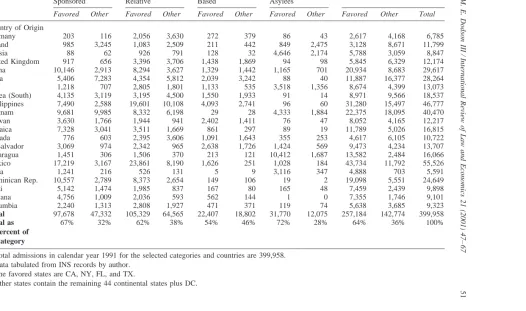
Table 1 provides some descriptive evidence about the dependent variable. Immigrants legalized under IRCA are excluded from the data, since their residence is already established. Also, children have been excluded from the sample. If children were included, the identical and independent distribution assumption, necessary for estimation would be violated, since children locate with their parents. Annual values from this data set are calendar years not fiscal years, as reported in most INS publications.
In recent years, immigrants from Asian countries have increased dramatically. Between 1961 and 1970, Asian countries accounted for only 12.8 percent of all new immigrants. That
8
Table 1
Favored Other Favored Other Favored Other Favored Other Favored Other Total
Country of Origin
Germany 203 116 2,056 3,630 272 379 86 43 2,617 4,168 6,785
Poland 985 3,245 1,083 2,509 211 442 849 2,475 3,128 8,671 11,799
Russia 88 62 926 791 128 32 4,646 2,174 5,788 3,059 8,847
United Kingdom 917 656 3,396 3,706 1,438 1,869 94 98 5,845 6,329 12,174
China 10,146 2,913 8,294 3,627 1,329 1,442 1,165 701 20,934 8,683 29,617
India 5,406 7,283 4,354 5,812 2,039 3,242 88 40 11,887 16,377 28,264
Iran 1,218 707 2,805 1,801 1,133 535 3,518 1,356 8,674 4,399 13,073
Korea (South) 4,135 3,119 3,195 4,500 1,550 1,933 91 14 8,971 9,566 18,537
Phillippines 7,490 2,588 19,601 10,108 4,093 2,741 96 60 31,280 15,497 46,777
Vietnam 9,681 9,985 8,332 6,198 29 28 4,333 1,884 22,375 18,095 40,470
Taiwan 3,630 1,766 1,944 941 2,402 1,411 76 47 8,052 4,165 12,217
Jamaica 7,328 3,041 3,511 1,669 861 297 89 19 11,789 5,026 16,815
Canada 776 603 2,395 3,606 1,091 1,643 355 253 4,617 6,105 10,722
El Salvador 3,069 974 2,342 965 2,638 1,726 1,424 569 9,473 4,234 13,707
Nicaragua 1,451 306 1,506 370 213 121 10,412 1,687 13,582 2,484 16,066
Mexico 17,219 3,167 23,861 8,190 1,626 251 1,028 184 43,734 11,792 55,526
Cuba 1,241 216 526 131 5 9 3,116 347 4,888 703 5,591
Dominican Rep. 10,557 2,789 8,373 2,654 149 106 19 2 19,098 5,551 24,649
Haiti 5,142 1,474 1,985 837 167 80 165 48 7,459 2,439 9,898
Guyana 4,756 1,009 2,036 593 562 144 1 0 7,355 1,746 9,101
Columbia 2,240 1,313 2,808 1,927 471 371 119 74 5,638 3,685 9,323
Total 97,678 47,332 105,329 64,565 22,407 18,802 31,770 12,075 257,184 142,774 399,958
Total as Percent of Category
67% 32% 62% 38% 54% 46% 72% 28% 64% 36% 100%
Total admissions in calendar year 1991 for the selected categories and countries are 399,958. Data tabulated from INS records by author.
The favored states are CA, NY, FL, and TX.
Other states contain the remaining 44 continental states plus DC.
share has increased to 37.3 between 1981 and 1990. The Asian countries represented in this sample sum to 147,618 admissions. This is over one-third of the total admissions or 36.9 percent. They include China with 29,617; South Korea with 18,537; 46,777 for the Phillip-pines; 40,470 immigrants from Vietnam; and Taiwan totaling 12,217.
The same table provides some evidence about the preferences for some states among new United States immigrants. The favored states in Table 1 include immigrants who located in California, Texas, Florida, and New York. Immigrants locating in the remaining forty-five possible destinations are found in columns labeled other. The favored states were chosen simply to illustrate the general preference among immigrants for these states versus the remainder. Together, the favored states absorbed 257,184 immigrants, 64 percent of this 1991 sample. Only 36 percent of the immigrants in this sample located in the remaining forty-four possible states or the District of Columbia, obviously these four states are preferred by immigrants.
Previous research has only been able to disaggregate immigration data across two major characteristics, either admission category and state of intended residence (Buckley, 1996) or country of birth and state of intended residence (Zavodny, 1997). The data used here is from unpublished Immigration and Naturalization Service records provided by the National
Technical Information Service.9 The previous research employed the same data, but was
encumbered with the published forms that report only a few major characteristics.10 Cross-tabulation of the admission category, country of origin, and state of intended residence, available with this set, is not available in the published format. In order to attempt to settle the controversy between Buckley (1996) and Zavodny (1997) all these characteristics are needed.
Estimation of the determinants of location choices among immigrants may also be biased without this level of disaggregation. If immigrants are attracted to locations that contain large populations of similarly born immigrants, using the population of all foreign born immi-grants may underestimate any correlation with location decisions. In other words, the fraction of the total foreign-born population not from the new immigrants country of birth may produce enough statistical noise to cover up any correlation. This may be the case in Buckley (1996) and displays why country of origin is important in this estimation. Zavodny (1997) recognized this possibility but could not estimate differences across admission categories. Using total immigration without disaggregating with respect to admission categories may also be biased. If immigrants in the immediate relative category or the family-sponsored category locate in the same state as their sponsors then the strong attraction between location choices and similarly born immigrants is to be expected. However, this fact may be biased upwards with regard to employment-based immigrants who will most likely locate in the same states as their employer or areas where they can get the best return for their skills.
9
Immigrants Admitted into the United States, 1990-1995. Dept. of Justice, Immigration and Naturalization Service. NTIS # PB97-500763.
10
In addition to addressing the data constraint faced by Buckley (1996) and Zavodny (1997), this model uses a Tobit estimation technique. Tobit is appropriate for two reasons. First, the
dependent variable is censored.11 The dependent variable is the number of immigrants
locating in any state and therefore is nonnegative. The second reason Tobit is required, is a massing problem. Disaggregating the data to this level reveals a number of zero observations for each of the dependent variables. The data set contains a frequency for each of the forty-nine states stacked according to the twenty-one countries of origin. The total data set contains 1029 observations. Out of this total, there are 271, 84, 398, and 516 zero observa-tions for the family sponsored, immediate relative, employment based, and refugee and asylee categories, respectively. The existence of these observations seriously biases the ordinary least squares estimator.
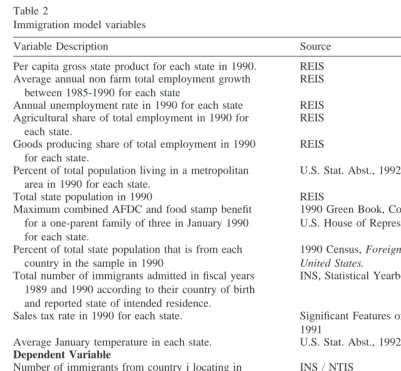
The matrix X in equation (2) includes state economic factors. These factors include per capita gross state product, the unemployment rate, state employment shares in the goods producing sector and agriculture, the percent of the state population living in metro areas, the growth rate of employment between 1985 and 1990, the total population of the state, the sales tax rate for the state and the average January temperature for each state. Also, included in this matrix is the combined maximum monthly potential benefit from AFDC and the food stamp program for a one-parent family of three persons. Table 2 provides a summary definition for each of the independent variables and identifies each source.
These independent variables have three specific measurement objectives. They are vari-ables that measure the health of the state’s economy, the disposition or typical features of the state and its economy, and two auxiliary control variables. The measures of economic health include per capita gross state product, the employment growth rate and the unemployment rate. Per capita gross state product will correlate positively with location choices if immi-grants are attracted by productive, high income states. Growth in employment should indicate an expanding opportunity set for new arrivals in each state. Positive correlation between location choice and employment opportunities will result if these opportunities are important parts of the utility function.
Typically an unexpected positive sign plagues the relationship between unemployment and location decisions in similar estimations (Buckley, 1996; Zavodny, 1997). There may be several reasons for these results. The time lag on the variable may be inappropriate. The unemployment rate during the last six months could be more important than the previous year’s unemployment rate. A more intuitive explanation could be that the unemployment rate in relation to the source country’s unemployment rate is more important. Every state in the United States may have an unemployment rate that is so low in relation to the source country’s unemployment rate that this variable makes very little difference in the location decision. The addition of employment growth to this model may mitigate the consequences of this suspect variable.
The second set of variables describes the typical economic or social features within a state. Included in this set are the agricultural share of total employment, the goods producing share of total employment, the percent of the state’s population that resides within a metro area,
11
See Greene (1990), p.691.
53
and the total population of the state. Industry employment shares will measure work preferences of immigrants. Reason suggests that if the immigrant is trained and experienced in a manufacturing process he will choose a state with a relatively larger share of employ-ment in the goods producing sector. The same arguemploy-ment applies for agriculture. These estimates will produce a coefficient that is relative to the service producing sector, since it is left out of the model.
Casual inspection of the concentration of foreign-born individuals and their current state of residence suggests that states with large metropolitan areas are preferred by immigrants. Zavodny (1997) finds support for this contention. She finds that the percent of a state’s population living within a metropolitan area is a strong attractor in location decisions. This same percentage is included in this model. States with large populations may indicate an area that allows for easier assimilation or an area with more social opportunities. In order to
Table 2
Immigration model variables
Variable Description Source Per capita gross state product for each state in 1990. REIS Average annual non farm total employment growth
between 1985-1990 for each state
REIS
Annual unemployment rate in 1990 for each state REIS Agricultural share of total employment in 1990 for
each state.
REIS
Goods producing share of total employment in 1990 for each state.
REIS
Percent of total population living in a metropolitan area in 1990 for each state.
U.S. Stat. Abst., 1992
Total state population in 1990 REIS Maximum combined AFDC and food stamp benefit
for a one-parent family of three in January 1990 for each state.
1990 Green Book, Comm. on Ways and Means, U.S. House of Representatives
Percent of total state population that is from each country in the sample in 1990
1990 Census, Foreign Born Population of the
United States.
Total number of immigrants admitted in fiscal years 1989 and 1990 according to their country of birth and reported state of intended residence.
INS, Statistical Yearbook, 1990 and 1991.
Sales tax rate in 1990 for each state. Significant Features of Fiscal Federalism, v. I, 1991
Average January temperature in each state. U.S. Stat. Abst., 1992
Dependent Variable
Number of immigrants from country j locating in state k, for each of the four major admission categories in calendar year 1991.
INS / NTIS
account for these possibilities, the total population of the state is included as an independent variable.
The auxiliary controls are the state sales tax rates and the average January temperature within each state. Any influence due to taxes may vary across admission categories. For example, if employment-based immigrants can expect higher wages they may choose locations with lower tax rates, holding other influences constant. On the other hand, some immigrants may take higher tax rates as a signal for a higher provision of public goods. Since, income tax structures across states are extremely varied and property taxes differ at the county level, the only consistent statewide tax measure left is the sales tax rate.12January temperatures may account for any natural amenities connected with the location choice. It is reasonable to suggest that an immigrant will wish to locate in a state with a climate similar to that in the source country. In order to account for this possibility, January temperatures are interacted with the source country dummies. All the state factors are lagged one year since this is the information available to the individual immigrant.
The matrix of nativity factors (N) includes the 1990 percent of the total population in state k whose country of birth is j. This variable measures the stock of similarly born immigrants. Like Zavondy (1997) this variable will correlate positively with location choices if immi-grants are attracted to states with communities that represent their country of origin. This percentage of the state population that is similarly born, however, may not capture the influence of recent arrivals. The number of similarly born immigrants, regardless of admis-sion category, admitted in fiscal years 1989 and 1990 who reported state k as their intended residence is also included in N. This flow variable is intended to test for a possible hysteresis effect. For example, Arizona may be an attractive location choice to 1991 immigrants from Nicaragua if a Nicaraguan community just recently developed. In this case, the recent change in immigrant inflow creates a permanent incentive to locate in Arizona. In fact, this incentive may be more powerful than that seen in the stock variable because those immigrants represented by the stock variable may have become well assimilated and less representative of the source country over many years.
The cost of relocating or distance is also an important factor in the location decision. Zavodny (1997) uses the distance between the most populated city in the source country and the most populated city in the host state as a proxy for these moving costs. However, this variable may not accurately measure the important part of the moving cost. The most important measure for an immigrant, who is choosing a state residence, is the distance between the port of entry and the state of intended residence. An immigrant may choose an Atlantic or Pacific passage based solely on the distance between the resulting port of entry and the intended destination state. In other words, the cost of moving from the source country to the port of entry is sunk once the immigrant reaches the United States. Once arriving in the United States an immigrant can stay in the state that encompasses the port of entry or
12
Admittedly, the sales tax rate may be a poor proxy for the burden of taxes across states. I replaced the variable with per capita total state and local government tax receipts (less federal transfers) in order to test for any sensitivity in the results. None of the results were altered and the tax variable remained insignificant in all regressions.
55
reside in another state. Furthermore, this could explain why the states which are preferred by immigrants lie next to an international border or have a coastline. This model attempts to control for this sunk cost by incorporating the more appropriate cost of moving between the port of entry and the state of intended residence.
In order to capture these possibilities three dummy variables are included in the model. The first takes a value of one for states that maintain a border with Canada. The second identifies states with a southern international border. In the third dummy variable states with a coastline take the value of one. In order to describe some of the most probable ports of entry for each country the variable COST is constructed. This variable takes on the value for the coastal dummy variable for each state and country combination except for Mexico and Canada. For these two exceptions, the variable takes on the values found in the international border dummies.
To elaborate, consider the observation for immigrants from India who locate in Nevada, in this case COST would maintain a zero observation since Nevada has no coastline. On the other hand, COST would have a value of one for Indian immigrants who locate in Virginia. For the first case, the immigrant incurred the additional expense of locating beyond the first available port of entry. In the second case, remaining in Virginia indicates that the cost of further travel once reaching a coastline state may have been a factor in the location choice. A third example, is an immigrant from Mexico who locates in Nevada, the COST value would be a zero again since Nevada has no border with Mexico.
The interpretation of this dummy variable is simple. A value of one in COST implies the immigrant located in a state with a probable port of entry; the marginal cost of locating in a more distant state was burdensome. A value of zero indicates the immigrant paid the additional cost of moving to a more distant state. Since observations with a one in this variable identify the situation where the marginal cost was foregone it should vary positively with location choice. States that embody minimal or no marginal cost should see more immigration. The remaining three dummy variables are also included in the specification. Each should vary positively with the dependent variable. Obviously, states that are more accessible to immigrants should have more immigration, especially if the marginal cost of further travel is important. More important, this specification will control for immigration to states that merely have an international border or coastline.
The variables listed above can be characterized as “pull” or host country factors. None of these would pick up any factors in the source country that encourage emigration or “push” the immigrants out of the source country. Dummy variables for the j countries are included in order to pick up any variation in location choices that are specific to a certain country. These dummies also proxy for some of the “pushes” associated with immigration.
3. Estimation results for the full set of 1991 United States immigrants
A series of log likelihood ratio statistics tested three restricted models for each admission category. In the first test, all coefficients were restricted to zero. The null hypothesis was rejected for each admission category at the 1 percent level of significance. Thex2statistics were 1049.6, 1102.5, 6993.9, and 7435.7 for the family sponsored, immediate relative, refugee, and employment-based categories respectively. A second test restricted the coeffi-cients for the temperature interactions and the country dummies to zero. In this case the restricted model was rejected for each class of admission at the 1 percent level of significance as well. This suggests that there is source country specific variation in location decisions and that climate in the intended state of residence is important relative to the source country’s climate. A third restricted model set the coefficients of the border, coastal, and distance dummies to zero. The restricted model in this case could not be rejected at the 1, 5, or 10 percent level of significance for the family sponsored, immediate relative, or refugee class of admission. Thex2statistics were 6.07, 8.01, and 6.64 respectively. The restricted model was rejected in the case of the employment-based admission class. The test statistic was 15.51, which is significant at 5 percent.
COST is only weakly significant for two of the four admission categories but does display the proposed relationship in these cases. Other results, not reported here, include substituting the distance from each source country capital city to each state capital for this distance
dummy.13 As argued before, this variable may not capture the important segment of any
moving cost, but the results were similar and the final conclusions were not altered. The dummy variables for coastal states and states with an international border with Mexico are not significant for any of the admission classes. Refugees and employment-based immigrants seem to be repelled by those states that border Canada.
Before elaborating on the estimation results of the model something must be said concerning the multicollinearity issue raised by Buckley (1996) and further complicated by the combination of his results and those of Zavodny (1997). Buckley suggests that measure-ments of the foreign-born population may be correlated with the other independent variables, especially the welfare generosity variable. Given that the independent variables correlate with the current inflow, they may also explain the stock of immigrants already in place.
Consider the scenario where immigrants from country j are welfare motivated and locate in state k at time period t. Also assume that the current inflow of immigrants at time t resembles the nativity stock at time t. In this case multicollinearity exists between the welfare variable and the nativity stock. Coefficient estimates may exhibit spurious correlation due to this problem. The scenario above is unlikely in this specification. Correlation between the stock variable and welfare suggests that the variation in the population share from country j and the variation in maximum welfare payments for any particular state k are related.
Two factors make this connection seem unreasonable. First, the stock variable is the culmination of many years of flows. It could be that the immigrant flow in period t is related to welfare payments in period t or t-1. However, immigrant flows in period t-100 through
13
Distance data provided by the Bureau of Airline Statistics, U.S. DOT.
57
t-10 are most likely not correlated with welfare payments in period t or t-1. Second, keep in mind that changes in welfare payments are the product of legislation. This legislation may be dependent upon some formula or change drastically with changes in representation. It is possible that current immigration inflow may influence changes in welfare legislation, but past immigration inflows would most likely not enter this decision. More to the point, current welfare payments may explain current immigration flow but it is unlikely that it explains the sum of past immigration inflows.
In an attempt to more accurately model location choices, this model introduces a third variable which produces still more multicollinearity concerns. Similarly born immigrants who entered each state in fiscal years 1989 and 1990 are included as independent variables. In the end, any resolution to this debate in the current specification will be found in empirical testing. Variance inflation factors (VIF) are well known and a simple tool in determining the severity of any multicollinearity. A VIF of five or more is the threshold for severe multi-collinearity.14A VIF for the welfare variable, foreign born share of state population, and the recent immigrant flow variable was calculated using this procedure. The values for each were 2.7, 1.1 and 1.2, respectively. Since all of these were far below five, multicollinearity is not a problem in the model.
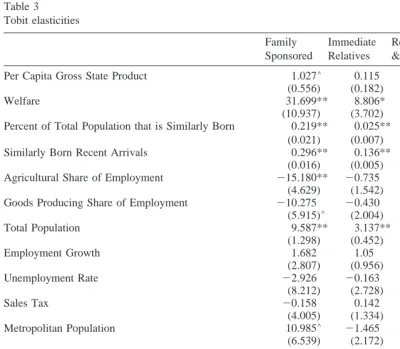
The elasticities presented in Table 3 are calculated using the median values of both the independent and dependent variables. The zero observations in the dependent variables would produce an upward bias if mean values were used. Elasticities for each category of admission are included. The log-likelihood statistics for each regression are also reported in Table 3.
Per capita gross state product is significant only in the family sponsored and refugee catego-ries. Further, none of the classes consider the growth in employment or the unemployment rate. These elasticities indicate that the health of any particular state’s economy does not typically impact the location choices of immigrants. The specific economic and social features of states seem to weigh more heavily into the location decision. In all admission categories the state population is a significant and positive factor in the decision. For example, a 1 percent increase in the state population is associated with a 9.5 percent increase in family-sponsored immigrants locating within the state on average. The same population increase results in a larger inflow of refugees and employment-based immigrants.
Elasticity estimates in Table 3 also suggest that immigrants from every admission category prefer employment in the service producing sector. In all cases, a negative elasticity results with respect to the share of employment in agriculture and the goods producing sector. These estimates are strongly significant for employment based and family-sponsored immi-grants. Contrary to Zavodny (1997) the percent of the population within a state living in a metropolitan area is not strongly significant. Only in the case of family-sponsored immi-grants and refugees is the metropolitan population a significant factor and only at the 10 percent level. However, the elasticities are large in magnitude compared to the insignificant elasticity associated with the immediate relative and employment-based category.
All immigrants seem to be attracted by at least one of the nativity factor variables. Employment-based immigrants do not respond significantly to the similarly born stock of
14
immigrants but a 10 percent increase in the recent flow of similarly born immigrants increased the number of employment-based immigrants to the average state by 0.7 percent. Refugees respond in a converse manner; responding with a 5.9 percent increase for every 10 percent increase in the stock of similarly born immigrants in the average state but not responding to the recent inflow. Family sponsored and immediate relatives respond to both of the nativity variables.
The significant elasticities for the nativity factors lend support for Zavodny’s (1997) conclusions. However, while this motivation exists in location choices, after correctly controlling for nativity factors the welfare generosity variable remains positive and signif-icant. This result is strongly supportive of Buckley’s (1996) argument. Every class of
Table 3 Per Capita Gross State Product 1.027V 0.115 3.772V 0.128
(0.556) (0.182) (2.265) (0.428) Welfare 31.699** 8.806* 150.983** 40.616**
(10.937) (3.702) (44.376) (8.112) Percent of Total Population that is Similarly Born 0.219**
(0.021) Similarly Born Recent Arrivals 0.296** 0.136** 20.031 0.077**
(0.016) (0.005) (0.048) (0.01) Agricultural Share of Employment 215.180** 20.735 27.275 213.035**
(4.629) (1.542) (18.76) (3.502) Goods Producing Share of Employment 210.275 20.430 27.751 213.607**
(5.915)V (2.004) (24.742) (4.327) Total Population 9.587** 3.137** 30.156** 10.104**
(1.298) (0.452) (5.361) (1.001) Employment Growth 1.682 1.05 5.487 1.421
(2.807) (0.956) (11.566) (2.114) Unemployment Rate 22.926 20.163 25.881 23.642
(8.212) (2.728) (34.742) (6.113) Sales Tax 20.158 0.142 6.267 23.682
(4.005) (1.334) (16.538) (2.933) Metropolitan Population 10.985V 21.465 51.624V 2.356
(6.539) (2.172) (26.677) (4.801)
COST 58.529V 82.283V 45.38 5.747
(46.043) (58.899) (29.522) (10.809) Coastal States 218.05 255.485 233.709 10.942
(45.891) (58.579) (29.63) (10.754) Northern Border States 222.767 259.231V 235.972* 211.838*
(24.744) (30.632) (17.06) (6.019) Southern Border States 222.764 57.434 221.154 0.409
(39.632) (50.288) (26.098) (9.655) Log Likelihood 25826.21 27257.38 24311.66 24090.76
Elasticities are calculated as: Estimated Tobit coefficient* (Median of independent variable / Median of dependent variable).
Standard errors are calculated as: square root of ((Median of independent variable / Median of dependent variable)2
* (Variance of the estimated Tobit coefficient)).
A significance level of 1% is denoted by **, 5% by *, and 10% byV.
59
admission displays some welfare motivation in the location decision. The smallest elasticity is in the immediate relative category. In this case a 1 percent increase in the maximum combined AFDC and food stamp benefit correlates with an 8.8 percent increase in the number of immigrants choosing the state as their location. The same increase in welfare correlates with an even larger inflow of immigrants in each of the remaining three categories.
4. Differences among immigrants within the sample
Females are typically the primary beneficiaries of AFDC payments. For example, in 1991 female headed households, with no spouse present, accounted for a majority of the benefi-ciaries in the AFDC program and the food stamp program. This group made up 69 percent of total participants in the AFDC program. The same group accounted for 57 percent of the total participants in the food stamp program. For all means tested assistance programs, which includes AFDC, the food stamp program, Medicaid, and housing assistance the female headed-household participation rate was 48 percent.15
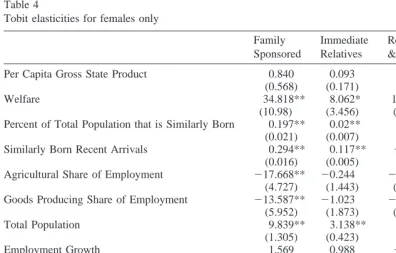
Consequently, the determinants of location choices for female immigrants may provide additional evidence as to the possibility of welfare motivation. If immigrants are welfare motivated and females maintain a greater participation rate in the AFDC and food stamp program, welfare motivation should be more apparent among females than with the total sample. Table 4 reports elasticities for female immigrant location choices with respect to the same determinants using the same Tobit procedure and elasticity calculation as described in Table 3. Female immigrants display very little difference in relation to the full set of immi-grants with respect to the determinants of location choices. Total population is still a significantly positive factor in the decision. The metropolitan population is significant only for refugees. Family sponsored and employment based female immigrants consider the employment shares within a state while the other categories do not. Nativity factors remain an important factor in the decision for females as well. However, like the results for total immigration, the maximum welfare payment within a state overshadows the other determinants.
Intuition suggests that immigrant’s in each of the admission categories react differently to these proposed state factors. As discussed earlier employment-based immigrants may choose states that maintain employment shares in manufacturing for example. Additionally, they may not consider any of these factors if they simply reside in a state based on a predeter-mined employer location. Although the calculated elasticities imply some differing responses to the independent variables across the various admission categories, there is no assurance that they are statistically different.
A secondary model can check for these differences. In this second model all the observations for each of the four admission classes are pooled into one data set. Next, a set of three dummy variables indicating the various classes are interacted with each of
15
All statistics on 1991 participation rates in means tested assistance programs are from the U.S. Statistical
the independent variables. Employment-based admissions are the one set of immigrants not interacted with a dummy variable. Therefore, the regression includes 4116 obser-vations, all the independent variables plus another three sets of the independent variables interacted with each of the three dummies. Each of the interacted independent variables are interpreted as the marginal difference between the individual response for the independent variable across the family sponsored, immediate relative, and refugee admission class relative to the same response for the employment-based admission class. If these marginal differences are not statistically significant, then the conclusion is that no difference across the admission categories exists with respect to the response for that independent variable.
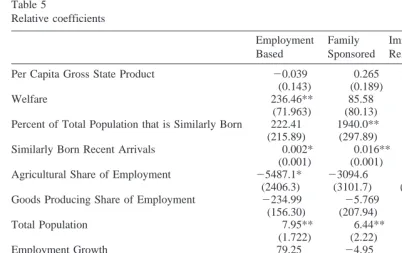
Table 5 displays these marginal coefficients and any statistical difference relative to the employment-based admission class for the full sample of 1991 immigrants. The table indicates that there is no statistical difference between the employment-based category and any of the other admission categories in the location decision with respect to the maximum combined AFDC and food stamp benefits in any particular state. All the admission categories indicate an equally positive and significant response to welfare.16
16
As a secondary test of this result I regressed the location choices of family sponsored, immediate relative and refugee category immigrants on the hypothesized independent variables and the residuals from the employ-Table 4
Tobit elasticities for females only
Family Sponsored
Immediate Relatives
Refugees & Asylees
Employment Based Per Capita Gross State Product 0.840 0.093 3.76 0.285
(0.568) (0.171) (2.766) (0.449) Welfare 34.818** 8.062* 167.643** 39.437**
(10.98) (3.456) (52.583) (8.331) Percent of Total Population that is Similarly Born 0.197** 0.02** 0.565** 0.003
(0.021) (0.007) (0.092) (0.016) Similarly Born Recent Arrivals 0.294** 0.117** 20.034 0.065**
(0.016) (0.005) (0.055) (0.01) Agricultural Share of Employment 217.668** 20.244 223.149 212.536**
(4.727) (1.443) (22.531) (3.617) Goods Producing Share of Employment 213.587** 21.023 213.04 213.257**
(5.952) (1.873) (29.818) (4.452) Total Population 9.839** 3.138** 34.002** 9.485**
(1.305) (0.423) (6.33) (1.047) Employment Growth 1.569 0.988 21.151 1.066
(2.811) (0.895) (13.676) (2.18) Unemployment Rate 23.295 20.381 216.352 23.412 (8.254) (2.567) (41.473) (6.264) Sales Tax 20.141 0.232 12.162 22.177
(4.040) (1.253) (20.187) (3.052) Metropolitan Population 10.519 20.899 78.338* 3.86
(6.623) (2.031) (31.963) (4.941) A significance level of 1% is denoted by **, 5% by *, and 10% byV.
61
Immigrants do respond differently to changes in the recent flow of immigration, total population of the destination state, and the metropolitan population within the destination state. According to the estimates in Table 5 family-sponsored immigrants and those classified as immediate relatives are more likely to locate in states with a larger recent flow of similarly born immigrants. This result is most likely due to the location of the new immigrant’s sponsor. Refugees, on the other hand, are less likely to locate in states with a large recent flow than employment-based immigrants. Each class of admission responds differently to the population within the state of residence. Category differences for female immigrants are not reported but are similar. Like the total sample, there are no differences among the admission categories with respect to welfare generosity. Total state population, recent immigration and the similarly born stock of immigrants do produce varying incentives for female immigrants in each category of admission.
ment based immigrant specification. If employment based immigrants are not welfare motivated, as many would expect, and there are any unobserved factors which explain location choices among all immigrants then these factors would be represented in the error term. This procedure changed none of the significant coefficients and altered no conclusions.
Table 5
Relative coefficients
Employment Based
Family Sponsored
Immediate Relative
Refugees & Asylees Per Capita Gross State Product 20.039 0.265 0.177 0.252
(0.143) (0.189) (0.179) (0.193) Welfare 236.46** 85.58 55.39 242.28
(71.963) (80.13) (77.60) (82.88) Percent of Total Population that is Similarly Born 222.41 1940.0** 551.64V 1965.9**
(215.89) (297.89) (296.24) (298.28) Similarly Born Recent Arrivals 0.002* 0.016** 0.022** 20.002*
(0.001) (0.001) (0.001) (0.001) Agricultural Share of Employment 25487.1* 23094.6 4433.5 4481.6
(2406.3) (3101.7) (3015.4) (3198.0) Goods Producing Share of Employment 2234.99 25.769 212.08 12.92 (156.30) (207.94) (203.57) (217.87) Total Population 7.95** 6.44** 6.64** 5.78**
(1.722) (2.22) (2.21) (2.27) Employment Growth 79.25 24.95 71.77 21.26
(141.78) (191.97) (188.41) (200.01) Unemployment Rate 3.17 22.67 20.723 213.77
(7.44) (9.67) (9.34) (10.17)
Sales Tax 22.89** 1.77 5.08 2.86
(4.47) (6.17) (5.97) (6.43) Metropolitan Population 56509.0* 27263.8 273714.0* 215510.0
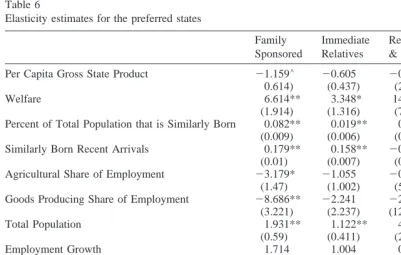
5. Estimates for the preferred states only
The magnitude of the welfare motivation in both the full immigrant sample and with the female only sample raises some suspicion. According to the results for the full sample a 1 percent increase in the maximum combined AFDC and food stamp benefits on average will increase the inflow of immediate relative immigrant admissions by 8.8 percent, 31.69 percent for family-sponsored immigrants and 40.62 percent for employment-based immigrants. The largest elastic-ity is in the Refugee and asylee category. The same increase in potential welfare benefits will produce a 150.98 percent increase in these immigrants locating in the state. Females produce comparable results. The large elasticity for refugees is not completely surprising. Borjas (1995) maintains that refugees are relatively more likely to participate in means tested benefit programs. Furthermore, the large elasticities with respect to welfare only confirm the welfare motivation advanced and tested by Buckley (1996). On the other hand, the level of disaggregation in this data could be culpable in producing suspiciously large elasticities.
Table 1 clearly indicates that some states are preferred by immigrants, indeed, and there are several states with very small immigrant inflows. Furthermore, these small inflows are further separated by admission class producing many zero observations as discussed before. For example, the fourteen family-sponsored immigrants who located in Wyoming only represent four countries of origin; four from China, one from India, three from Korea, and six from Vietnam. In this example there are seventeen zero observations for the state of Wyoming. Among the observations for refugees from Guyana there are forty-five zero observations out of forty-nine. The small numbers that result from this dissagregation may create an overestimate of the median elasticities for the determinants. These small numbers will, of course, indicate large percentage changes with small changes in the levels. Any elasticity will be overstated due to these small levels.
In order to account for any small number problems in the data a further specification is considered. In this case the determinants of location choice for immigrants who intend to reside in the preferred states only are examined. The dependent variable is now the number of immigrants from each of the twenty-one countries of origin who locate in those states with a total immigrant inflow of 5,700 or more in 1991. These thirteen states are selected for three reasons17. First, these states have total immigrant inflows that are cut off by the seventy-fifth percentile of the distribution. Since any immigration policy analysis will be more important to states with large inflows of immigrants, this cutoff may describe results that are more policy oriented. Second, the states in this upper fourth of the distribution are those that have been preferred by immigrants in the recent past. Between the fiscal years of 1988 and 1996, 9.42 million legal immigrants entered the United States, of this total these states absorbed 8.02 million or 85 percent. Third, these states have significantly fewer zero observations. This reduction in zeros will reduce any possibility of overstated elasticities.
Table 6 reports the elasticities for this estimation. Specification tests were also run on this model. In the same manner as before log-likelihood ratio tests indicate that the model is well
17
The states are California, New York, Texas, Florida, New Jersey, Illinois, Massachusetts, Virginia, Pennsylvania, Washington, Maryland, Michigan, and Connecticut.
63
specified. In the first test all the coefficients were restricted to zero, leaving only the constant term. In this test, the null hypothesis was rejected in each case. Thex2test statistics with 67 degrees of freedom were 1070.23, 899.296, 1110.41, and 560.659 for the family sponsored, employment based, immediate relative and refugee class respectively. All are significant test statistics and reject the restricted model at the 1 percent level. In a second test, all coefficients except the country dummies were restricted to a value of zero. If the null cannot be rejected in this case then any location determinants are unique to each source country and the state factors play no statistical part in the location decisions. As with the previous models the null was rejected in each case at the 1 percent level. The chi-square test statistics, in the same order as above, were 991.278, 700.175, 1043.99, and 343.707.
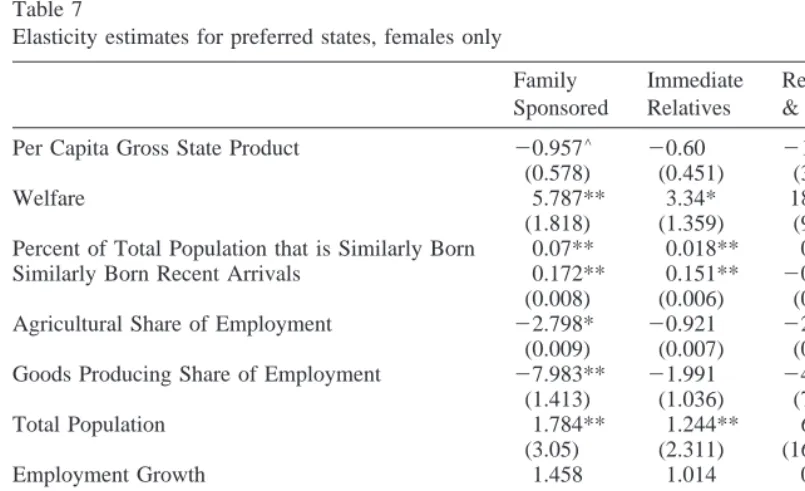
The elasticities reported in Table 6 provide support for the earlier results and indicate that immigrants who migrate to these preferred states do display welfare motivation. Further-more, the elasticities are more reasonable indicating that the states with smaller immigrant flows did inflate the original elasticities. Table 6 indicates that welfare generosity is still a significant determinant in the location decision even when controlling for nativity factors. Like the results above, female immigrants who locate in preferred states also display a strong attraction to welfare generosity. In both the full sample and the female sample, every class of admission displays the positive and significant correlation with welfare payments. The results for female immigrants in these preferred states are found in Table 7.
Table 6
Elasticity estimates for the preferred states
Family Sponsored
Immediate Relatives
Refugees & Asylees
Employment Based Per Capita Gross State Product 21.159V 20.605 20.182 20.755*
0.614) (0.437) (2.446) (0.382) Welfare 6.614** 3.348* 14.412V 4.701**
(1.914) (1.316) (7.519) (1.174) Percent of Total Population that is Similarly Born 0.082** 0.019** 0.231** 0.003
(0.009) (0.006) (0.033) (0.006) Similarly Born Recent Arrivals 0.179** 0.158** 20.007 0.04** (0.01) (0.007) (0.029) (0.005) Agricultural Share of Employment 23.179* 21.055 20.029 21.837* (1.47) (1.002) (5.804) (0.906) Goods Producing Share of Employment 28.686** 22.241 22.845 20.704
(3.221) (2.237) (12.566) (1.967) Total Population 1.931** 1.122** 4.975* 1.326**
(0.59) (0.411) (2.32) (0.365) Employment Growth 1.714 1.004 0.041 1.522* (1.21) (0.829) (4.813) (0.755) Unemployment Rate 5.305 1.491 3.619 21.037V
(4.147) (2.826) (16.769) (2.62) Sales Tax 3.756* 1.546 1.022 20.295 (1.912) (1.327) (7.479) (1.179) Metropolitan Population 24.681** 22.109 21.635 3.316* (4.267) (2.934) (16.782) (2.683) States included are CA, NY, TX, FL, NJ, IL, MA, VA, PA, WA, MD, MI, CT.
These estimates also indicate that the stock of similarly born immigrants does impact the location decision. Like Zavodny’s (1997) conclusion, these results suggest that similarly born immigrants are an important factor in the location choice. Additionally, the recent inflow of similarly born immigrants influences the location decisions of immigrants in each class of admission except refugees. However, as before her contention that country of origin is the dominant determinant in this decision finds no support here.
There is relatively little difference between the full sample estimates and the estimates for the preferred states. State population is still a positive and significant determinant. Only the employ-ment-based immigrants respond significantly to the unemployment rate. None of the admission categories display a relationship between location decisions and employment growth. Only immigrants in the family-sponsored category react to the industrial make-up of the state.
6. Conclusions
The elasticity estimates and model results produced in this study provide an answer to the controversy raised by earlier studies. First, welfare generosity and the presence of similarly born immigrants are both significant factors in the location decisions of immigrants in the sample. In each category of admission there is positive and significant correlation between welfare and the
Table 7
Elasticity estimates for preferred states, females only Family Sponsored
Immediate Relatives
Refugees & Asylees
Employment Based Per Capita Gross State Product 20.957V 20.60 21.664 20.02
(0.578) (0.451) (3.16) (0.032) Welfare 5.787** 3.34* 18.071V 3.067**
(1.818) (1.359) (9.704) (0.648) Percent of Total Population that is Similarly Born 0.07** 0.018** 0.245** 0.001 Similarly Born Recent Arrivals 0.172** 0.151** 20.006 0.038**
(0.008) (0.006) (0.043) (0.006) Agricultural Share of Employment 22.798* 20.921 22.39 20.736**
(0.009) (0.007) (0.037) (0.006) Goods Producing Share of Employment 27.983** 21.991 24.262 20.933**
(1.413) (1.036) (7.572) (0.22) Total Population 1.784** 1.244** 6.02* 1.803**
(3.05) (2.311) (16.187) (0.313) Employment Growth 1.458 1.014 0.827 0.071
(1.161) (0.857) (6.286) (0.145) Unemployment Rate 5.128 1.168 6.631 20.244
(4.014) (2.925) (21.919) (0.447) Sales Tax 3.226V 1.437 2.736 20.156
(1.815) (1.37) (9.681) (0.218) Metropolitan Population 24.60 21.99 23.93 0.347* (4.09) (3.036) (21.902) (0.445) States included are CA, NY, TX, FL, NJ, IL, MA, VA, PA, WA, MD, MI, CT.
A significance level of 1% is denoted by **, 5% by *, and 10% byV.
65
number of immigrants choosing an individual state as their intended state of residence. The same result occurs for the two variables that describe the presence of similarly born immigrants. With regard to the welfare variable, elasticities for each category of admission are significant at the 1 or 5 percent levels, lending support to Buckley’s (1996) welfare motivation theory. This confir-mation of Buckley’s (1996) results are all the more powerful since this article controls for nativity factors using the approach advanced by Zavodny (1997).
Second, there is no variation across the federal admission categories with regard to welfare but differences do exist with regard to the nativity factors. This implies that all immigrants regardless of admission category are welfare seeking in their location choices. On the other hand, there are significant differences across admission categories with regard to the attrac-tiveness of the stock of similarly born immigrants, the recent inflow of similarly born immigrants and state population.
Third, several specifications indicate the robustness of these results. Two variants of the model indicate that these results hold under various circumstances. First, these results hold for female immigrants only. This may be even more convincing evidence of welfare motivation in immigrant location choices since females are the primary beneficiaries of these welfare programs. Second, welfare motivation is a consistent finding for the preferred states as well as all states. Since some states have very small immigrant inflows, the full data set could overstate the elasticities of the determinants. Elasticity estimates with the preferred states are smaller relative to the full sample estimates, but in both cases the response to welfare is positive and significant.
Buckley (1996) argues and finds evidence that immigrants are welfare seeking in their location decisions. There is evidence here that welfare motivation does impact the location decision. However, Buckley’s (1996) suggestion that employment-based immigrants are relatively less welfare motivated does not find support here. In fact, these estimates suggest that all immigrants, regardless of admission category, are motivated by welfare generosity equally when choosing a destination state. This is not the first finding of welfare motivation among employment-based immigrants. Buckley also finds this results but does not test for any statistical differences across the admission categories. While recent immigration and welfare reform allows both the federal government and states to decrease income assistance expenditures in general, states have been hesitant to fully exercise this power. These findings suggest that in the future states may wish to reexamine the public assistance incentives they provide to new immigrants.
References
Conway, K. S., & Houtenville, A. J. (1998). Do the elderly ‘vote with the feet’? Public Choice, 97(4), 663– 85. Conway, K. S., & Houtenville, A. J. (1998b). Elderly migration and state fiscal policy: evidence from the 1990 census migration flows. Aging Studies Program Paper No. 13, Center for Policy Research, The Maxwell School. Syracuse, NY: Syracuse University.
Conway, K. S., & Houtenville, A. J. (1998c). When random group effects are cross-correlated: an application to elderly migration flow models. Aging Studies Program Paper No. 15, Center for Policy Research, The Maxwell School. Syracuse, NY: Syracuse University.
Baker, M., & Benjamin, D. (1995). The receipt of transfer payments by immigrants to Canada. Journal of Human
Bartel, A. P. (1989). Where do the new U.S. immigrants live? Journal of Labor Economics, 7(4), 371–391. Blank, R. M. (1988). The effect of welfare and wage levels on the location decisions of female-headed
households. Journal of Urban Economics, 24(2), 186 –211.
Borjas, G. J. (1999). Immigration and welfare magnets. Journal of Labor Economics, 17(4), 607– 637. Borjas, G. J. (1994). The economics of immigration. Journal of Economic Literature, 32(4), 1667–1717. Borjas, G. J., & Hilton, L. (1996). Immigration and the welfare wtate: immigrant participation in means-tested
entitlement programs. Quarterly Journal of Economics, 3(2), 575– 604.
Borjas, G. J. (1995). The economic benefits from immigration, Journal of Economic Perspectives, 9(2), 3–22. Borjas, G. J. (1993). Immigration policy, national origin, and immigrant skills: a comparison of Canada and the
United States. In D. Card & R. B. Freeman (eds.) Small differences that matter: labor markets and income
maintenance in Canada and the United States, Chicago, IL: University of Chicago Press, p. 21.
Buckley, F. H. (1996). The political economy of immigration policies. International Review of Law and
Economics, 16(1), 81–99.
Dresher, K. A. (1994). Local public finance and the residential location decisions of the elderly. Ph.D. Dissertation, University of Wisconsin.
Dunlevy, J. A. (1991) On the settlement patterns of recent Caribbean and Latin immigrants to the United States.”
Growth and Change, 22(1), 54 – 67.
Gramlich, E. M., & Laren, D. (1984). Migration and income redistribution responsibilities. Journal of Human
Resources, 19(4), 489 –511.
Graves, P. E., & Knapp, T. A. (1988). Mobility behavior of the elderly. Journal of Urban Economics, 24(1), 1– 8. Graves, P. E., & Linneman, P. E. (1979). Household migration: theoretical and empirical results. Journal of
Urban Economics, 6(3), 383– 404.
Greene, W. H. Econometric Analysis, 2nd ed. New York, NY: Macmillian Publishing Company, 1993. Greenwood, M. J. (1975). Research on internal migration in the United States: a survey. Journal of Economic
Literature, 13(2), 397– 433.
Hu, W.-Y. (1998). Elderly immigrants on welfare. Journal of Human Resources, 33(3), 711.
McCarthy, K. F., & Vernez, G. (1997). Immigration in a changing economy California’s experience, Santa Monica, CA: RAND.
Studenmund, A. H. (1992). Using econometrics. 2nd
ed., New York, N.Y.: HarperCollins Publishers, Inc. U.S. Advisory Commission on Intergovernmental Relations. (1991) Significant Features of Fiscal Federalism.
U.S. Government Printing Office: Washington, DC.
U. S. Department of Justice, Immigration and Naturalization Service. Immigrants Admitted into the United States,
1990-1995. NTIS # PB97-500763.
U.S. Department of Commerce, Economics and Statistics Administration, Bureau of Economic Analysis. (1997)
Regional Economic Information System 1969-95, Washington, D.C.
U.S. Department of Commerce, Bureau of the Census. Statistical Abstract of the United States. Various years, U.S. Government Printing Office, Washington, DC.
U.S. Department of Commerce, Bureau of the Census. Foreign Born Population of the United States, Census
1990. STF3. U.S. Government Printing Office: Washington, DC.
U.S. General Accounting Office, Health, Education, and Human Services Division. (1998) Welfare reform– implications of proposals on legal immigrants’ benefits. GAO/HEHS-98-132.
Zavodny, M. (1997). Welfare and the locational choices of new immigrants. Economic Review, Federal Reserve Bank of Dallas, 2–10.
Zavodny, M. (1998). Determinants of recent immigrants’ locational choices.” Working Paper Series, Federal Reserve Bank of Atlanta, 98(3), 1–27.
67