THE STUDY OF LAND SUBSIDENCE RATE AT COASTAL AREA OF SEMARANG CITY, INDONESIA
Anindya Wirasatriya
Oceanography Study Programme, Diponegoro University, Indonesia
Abstrak
Semarang is a coastal city that has been suffered by rob flood for at least 25 years. One of main factors causes rob flood in Semarang is land subsidence. Land subsidence occurs in Semarang is a complex problem because the rate of land subsidence is different in places and changes in the development of time. Therefore it is necessary to monitor the land subsidence rate in Semarang. The aim of this research are to check the newest elevation of Bench Marks in coastal area of Semarang, to monitor land subsidence rate in coastal area of Semarang, To make elevation and land subsidence contour map in coastal area of Semarang.
The result of this research shows that bench marks which are above MSL + 100 m in height are stable enough. The closer to the sea, the faster land subsidence occurs. Soil type in coastal area of Semarang which is included young-soft soil type makes it still undergoes compression / consolidation. More over, coastal area of Semarang which is the center of the city activity such as industry, buildings, reclamation, crowded transportation, and many artisian well has made land subsidence happens faster.
Key Words : Bench Marks Elevation, Land Subsidence, Semarang
1. INTRODUCTION
In the last 25 years, Semarang City that lies at coastal area of Central Java has
suffered “rob” flood, flood caused by the raising sea level at high tide. This kind of flood inundated many places in Semarang City. In May 2005, there are at least 14
village were inundated by “rob” flood with the width of puddle area was 2.418 Ha. One factor causes “rob” flood is sea level rise. The sea level rise rate that recorded at Tide Observation Station Tanjung Mas Harbor, Semarang was 5,43 cm/year
(Wirasatriya, 2005)
Based on the previous research of Wirasatriya (2005), the dominant factor
causes sea level rise in Semarang City was land subsidence. At the other side there
was also global warming factor that caused sea level rise in whole part of the world
but this global factor only caused sea level rise in Semarang about 2,65 mm/year.
with others. Generally closer to coastal area the faster land subsidence occurres.
Sutanta and Hobma (2002) stated that it would be very difficult to determine the
value of land subsidence in Semarang since there would be a different value in
different place and different time. This complexity aroses from the dynamics of
natural phenomena and human intervention, which in turn make it difficult to find
the most probable scenario of land subsidence in the area. Therefore it is very
important to observe the land subsidence in Semarang coastal area periodically.
Based on Wirasatriya (2005) in order to observe land subsidence in Semarang
coastal area, it is necessary to measure the elevation of many Bench Marks (BM) in
Semarang each year. By knowing those BMs elevation each year, the value of land
subsidence in many places in Semarang will be monitored. The aim of this research
are :
1. To check the newest elevation of Bench Marks in coastal area of Semarang.
2. To monitor land subsidence rate in coastal area of Semarang.
3. To make elevation and land subsidence contour map in coastal area of
Semarang
2. RESEARCH METHOD
This was descriptive research that had explorative character. According to
Arikunto (1993) this kind of research was performed to descript the situation or
status of a phenomenon. Thus the final result of this research give the description of
elevation and land subsidence in coastal area of Semarang.
The research was done in June 2006. The procedure of this research was
divided into 3 step, i.e. : preparation step, leveling measurement step and data
analysis step. The preparation step were preparing the equipments , searching for the
related literature and secondary data like previous elevation data, Semarang map,
etc.
The measuring step used leveling method to observe the elevation of BMs in
coastal area of Semarang. TTG 449 which is the most stable BM was used as a
reference point of measurement. TTG 449 is located in front of the “Ada” store in
Srondol which has 221,004 m of elevation from mean sea level (MSL) (later the
(1997) TTG points is gained from List Book of reference points from
BAKOSURTANAL, the responsible institution for surveying and mapping data in
Indonesia.
The elevation measurement followed this stripe :
1. “Go” stripe : Starting from srondol, Jl. Setia Budi, Jl. Gombel Lama, Jatingaleh, Kaliwiru, Jl. Sultan Agung, Taman Diponegoro Elisabeth, Jl. Diponegoro,
Siranda, Simpang Lima, Jl. Gajah Mada, Jl Pemuda, Johar Post Office, Jl.
Ronggowarsito and finished in Tanjung Emas Harbour.
2. ”Back” stripe : Starting from Tanjung Emas Harbour, Jl. Ronggo Warsito, Johar Post Ofice, Jl Imam Bonjol, Tugu Muda, Kali sari, Jl S Parman, Taman
Diponegoro Elisabeth, Jl Sultan Agung, Kaliwiru, Jatingaleh, Gombel , Jl Setia
Budi, and finished in Srondol.
The bench marks that were measured for the elevation were :
1. “Go and Back” Stripe :
a. TTG 449 in front of ADA Store Srondol
b. DTK 348 in forked road of Jl Setia budi and Jl Kyai Mojo
c. DTK 346 in forked road of Jl Setiabudi and Jl Gombel Lama
d. BM Gombel in Jl Gombel Lama
e. TTG 447 at the clock monument at Kaliwiru
f. DTK 341 in front of AKPOL
g. DTK 340 at Diponegoro park near Elisabeth Hospital
h. Go back to TTG 449 passing the same BM.
2. Circle stripe :
a. DTK 340 at Diponegoro park near Elisabeth Hospital
b. BM 6 Pelabuhan in front of Siranda Hotel
c. DTK 002 at simpang lima field
d. DTK 335 at Jl Gajah mada
e. BM Sub-District Border in front of Johar Post Office
f. BM Tidal Observation Station at Tanjung Emas Harbour Semarang
g. BM Drip in front of Johar Post Office
h. TTG 446 at Tugu Muda Park
j. BM Kop A Yani 16 in front of Gajah Mungkur Sub-District office
k. DTK 014 in front of Gajah Mungkur Sub-District office
l. DTK 340 at Diponegoro park near Elisabeth Hospital
BM elevation data gained were compared with the previous elevation data to
analyze the value of land subsidence. More over the value of land subsidence was
also compared with the previous data to know the change of subsidence rate. The
elevation and subsidence rate data were input for making elevation contour map and
land subsidence contour map in coastal area of Semarang.
3. RESULT AND DISCUSSION
Result
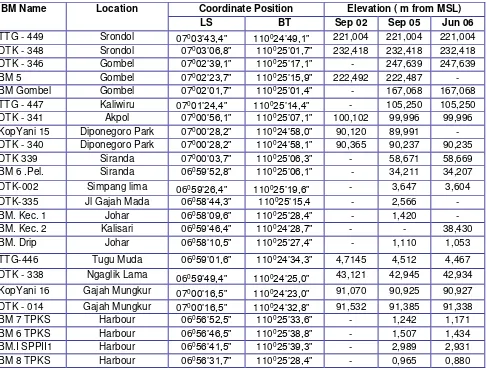
The elevation of BMs in Coastal area of Semarang are shown in table 1,
Based on the leveling measurement from TTG 449 as a reference point.
Table 1. BM elevation in Semarang City
BM Name Location Coordinate Position Elevation ( m from MSL)
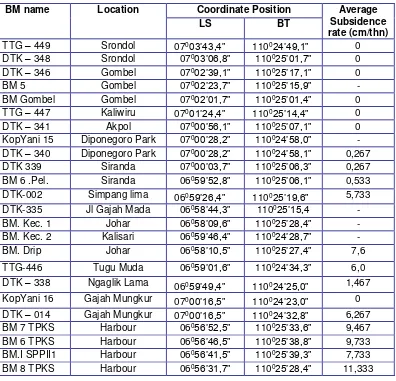
Land subsidence rate was known based on elevation data in September 2005
and Jun 2006 as shown in table 2
Table 2. Land subsidence rate of BMs in Semarang
BM name Location Coordinate Position Average
Subsidence
most accurate scenario for land subsidence in Semarang since the dynamic of natural
factor and human intervention. A simplicity had been made to determine it. It was
the land subsidence was assumed following linier trend and using the newest data as
a base of subsidence forecasting.
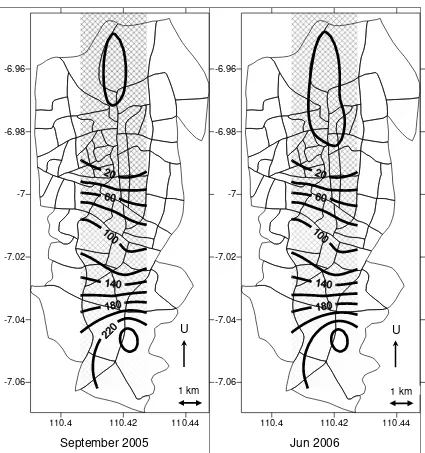
Elevation and land subsidence contour map in Semarang is shown in figure 1
110.4 110.42 110.44 -7.06
-7.04 -7.02 -7 -6.98 -6.96
September 2005
110.4 110.42 110.44
-7.06 -7.04 -7.02 -7 -6.98 -6.96
Jun 2006
Fig 1. Elevation Contour Map of Semarang (in M + MSL)
1 km
U U
110.4 110.42 110.44 -7.06
-7.04 -7.02 -7 -6.98 -6.96
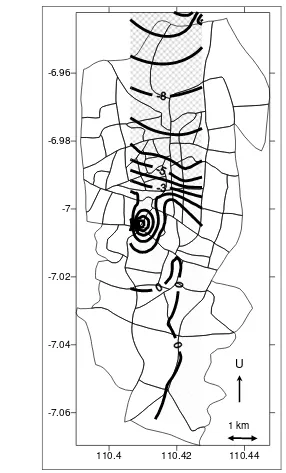
Fig 2. Land Subsidence Contour Map of Semarang (in cm/tahun)
Discussion
According to table 1 and 2; figure 1 and 2, Bench marks which are above
MSL + 100 m in height were stable enough. The closer to the sea, the faster land
subsidence occurs. Based on Wirasatriya (2005) soil type in coastal area of Semarang
which included young-soft soil type makes it still underwent compression /
consolidation. More over, coastal area of Semarang which is the center of the city U
activity such as industry, buildings, reclamation, crowded transportation, and many
artisian well has made land subsidence happens faster. Based on Suhandini (2004) in
http://www.landpolicy.org, the land subsidence rate depended on the burden on the
land. The heavier burden, the faster land subsidence happens. It was observed in
Semarang that because of 5 tons burden, it would be lower the land about 0,0102 m
-0,4098 m. Suripin (2002) had found the correlation between the land subsidence rate
and the height of pilling and also between the land subsidence rate and the reduction
of under ground water elevation. Those correlation are shown at equations below :
Y = 0,159 X2,5069 R2 = 0,9954
Y = Land Subsidence rate (m) X = Pilling Height (m)
S = 6,5267 SU0,6394 (R2 = 0,9904)
S = Land Subsidence Rate (m) SU = The reduction of under ground water (m)
A research team from Mineral Engineering Faculty, Bandung Institute of
Technology stated that the reduction of under ground water elevation in Semarang
caused the degradation of the land about 0,6 – 1,2 cm/year in rate (Suripin, 2002). Data from Geology and Environment Management Agency (1999) showed that the
amount of artisian well pipes increased fast in Semarang. In 1982 there were 127
pipes noted and they sucked under ground water about 13,49 million m3. In 1998,
there were 776 pipes noted and it caused 35,64 million m3 of under ground water is
sucked. There fore it is necessary to make an effective rule to control the under
ground water sucking.
The fastest land subsidence occurs in Tanjung Emas Harbour (Pelabuhan
Tanjung Emas). It reached more than 10 cm/year. Tanjung Emas harbor has very
crowded industry activity where in that area is located many large factories. Those
large factories are also have artisian well to supply their water demand. More over,
loading and unloading activity of trailer truck that bring tons of cargo and the
existing of north main street with its traffic add to the burden of soil in Tanjung
Emas Harbor. Therefore it is important to manage the human activity at coastal area
4. CONCLUSIONS
The conclusion of this research are :
1. Areas at Semarang city where have elevation above 100 m + MSL are stable
enough and do not undergo land subsidence
2. The closer to the sea, the faster land subsidence occurs and the fastest land
subsidence occurs in Tanjung Emas Harbour (Pelabuhan Tanjung Emas).
REFERENCES
Arikunto, S. 1993. Research Procedure : A Practice Approach, Rineka Cipta, Jakarta
BAPPEDA Semarang. 2000. The Coastal and Sea Area Profile of Semarang City. BAPPEDA. Semarang
http://www.landpolicy.org. Semarang, A city that Ignores Land Use Management and Environment. Browsing on 26 June 2004
Muhrozi; S Pranoto dan Nasrullah. 1997. Study on Determining Land Subsidence at the Lower Land of Semarang. Civil Engineering , Diponegoro University, Semarang
Suripin, 2002. Model Development of Ground Water Abstraction and Land Subsidence Potential Maps at The North Coast of Semarang Based On GIS. Civil Engineriing Study Program. Engineriing Faculty Diponegoro University. Semarang. 32 p
Sutanta, H dan TW Hobma. 2002. Preliminary Assessment of The Impact of Land Subsidence and Sea Level Rise in Semarang, Central Java, Indonesia. Proceeding PORSEC. Bali