105
MODELLING OF LAND SUBSIDENCE ALONG TANAH MAS
-PELABUHAN SECTION SEMARANG CITY USING FINITE
ELEMENT METHOD
Dwi Sarah, Arifan J. Syahbana, R. Fajar Lubis and Asep Mulyono
ABSTRACT
Land subsidence has been anapparent problem in the northern part of Semarang city, Central Java, which has caused enormous physical and economical impacts. This area is underlain by alluvium sediments of clay, silt, sand and gravel. The nature of the alluvium soil is soft and highly compressible which induces natural consolidation to occur. The lowering of groundwater table due to exploitation and loads of building and earth fill accelerate the rate of consolidation settlement. A study of land subsidence modeling was carried out in the northern part of Semarang city. Collection and analysis of data on the geology, hydrology, soil properties and monitored settlements were conducted. Modeling of land subsidence involved stress deformation analysis using finite element method. The settlements computed for selected section of the city of Semarang were compared with measurements of settlement in the city area. The simulation results appear to be in reasonably good agreement with the measurement results.
Naskah masuk : 21 Juli 2011
Naskah diterima : 8 Desember 2011 Dwi Sarah
Research Center for Geotechnology, Indonesian Institute of Sciences, Bandung 40135
Email : [email protected] Arifan J. Syahbana
Research Center for Geotechnology, Indonesian Institute of Sciences, Bandung 40135
Email : [email protected] R. Fajar Lubis
Research Center for Geotechnology, Indonesian Institute of Sciences, Bandung 40135
Email : [email protected] Asep Mulyono
UPT. Loka Uji Teknik Penambangan dan Mitigasi Bencana Liwa –LIPI
Email :[email protected]
Simulation results at selected section indicated that the contribution of lowering groundwater table factor accounts for less than 50% of total monitored subsidence. Meanwhile simulation results using application of external loading and lowering of groundwater table showed better agreement with the monitored subsidence. Information of magnitude and factors causing land subsidence is important particularly for city planning purposes.
Keywords: subsidence, consolidation, soil, groundwater, external load, modeling, simulation.
106
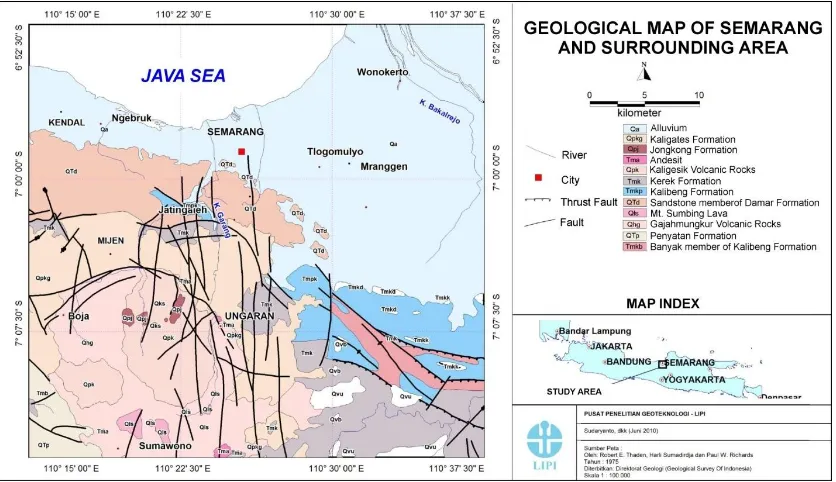
Figure 1. Geological map of Semarang City (Thaden et.al, 1996) Informasi besaran dan faktor-faktor yang
mempengaruhi terjadinya amblesan tanah penting diketahui khususnya untuk kepentingan perencanaan wilayah kota.
Kata kunci : amblesan, konsolidasi, tanah,
airtanah, beban permukaan, pemodelan, simulasi.
INTRODUCTION
Land subsidence is a geological hazard which causes the ground elevation to drop slowly and may lead to a disaster. It could occur as the result of human activities such as excessive groundwater withdrawal, load of construction etc and also due to natural geological actions. Subsidence has become a significant problem worldwide, particularly in the urban areas, such as Jakarta (Abidin et al, 2008), Shanghai (Chai et al, 2004), New Jersey (Sun et al, 1999), Bangkok (Bergado et al,1988). Besides Jakarta, land subsidence is also known to occur in Semarang and Bandung (Abidin et.al., 2006; Abidin et.al 2008 ). Semarang is the capital of Central Java Province, located at the northern Coast of Java Island. Semarang city covers an area of 373.7 km2 with the population of 1.43 million people in 2006 [Semarang City, 2009]. Semarang city has been experiencing land subsidence for more than 100 years with rate varying spatially ranging from 0-3 cm/year up to 9-15 cm/year (Abidin et.al, 2010). Land subsidence has caused damages to structures, increasing sea water intrusion, and regular occurrences of tidal flooding particularly in the
coastal region of Semarang. Consequently the associated economic costs of these impacts are enormous.
The Semarang coastal plain is occupied by quaternary alluvial deposit consisting of alternating layers of sand, silty sand and soft clay with lenses of gravels and volcanic sand (Thaden, 1975). The geology of this area provides large potential of groundwater. The occurrence of soft highly compressible soil at the upper layer induces consolidation to occur. The decrease of groundwater level over years due to exploitation is expected to accelerate consolidation process. Loads due to buildings and land reclamation over the compressible soils may also contribute to the settlement of this area. Stress-deformation analysis combined with changing groundwater level and surface loads was applied to obtain the consolidation settlement. This paper aims to elucidate the mechanism of subsidence in the northern part of Semarang city. Numerical modeling using finite element method was carried out for selected sections along Tanah Mas-Pelabuhan. These sections were selected as the highlight to the area severely affected by subsidence. Finite element package Plaxis v.8.2 (Plaxis B.V, 1998) was used in this modeling.
Geological Setting of Study Area
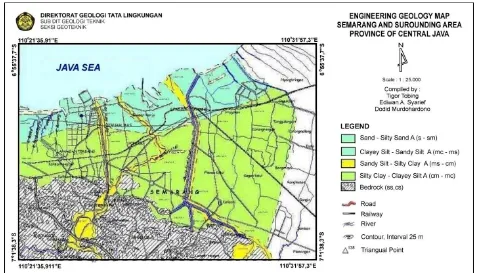
107 Figure 2. Engineering geological map of Semarang City (Tobing et.al, 2001)
Development of the alluvial deposit is controlled by tidal, deltaic and river environment. This alluvial deposit changes gradually towards the south, as characterised by the hilly morphology at the south. The young alluvium is characterised as soft and highly compressible (coefficient of compressibility, cv of 7.5x10⁻⁴ to 1.8x10⁻³ cm2/s).
The northern part of the Semarang area is covered by Kali Garang deltaic alluvium up to a depth of 80 to 100 m in the coastal area. Aquifers are found at depths ranging from 30 to 80 m in this alluvium. The engineering geological map of Semarang city (Figure 2) issued by the Directorate of Engineering Geology and Environment (Tobing et.al, 2001) divides the Semarang area into units as the following:
a. Sand- sandy silt : coastal deposit, blackish, very loose-loose, well sorted, high permeability, thickness of 1- > 10 m. This unit spreads along the coast, cone penetration of 15 - > 150kg/cm2.
b. Clayey silt- sandy silt : swamp deposit, brownish grey, very soft- soft, low-high plasticity, high compressibility, low permeability, thickness 2.5 – > 20m. This unit is found along the coast.
c. Sandy silt- clayey silt : flood deposit, brown- grey, soft to firm, low to medium permeability, intercalated with medium to
coarse sand at some places, thickness 1-> 50m. This unit spreads around Garang River. d. Silty clay- clayey silt: alluvial deposit, soft to
firm, medium-high plasticity. This unit is found at the center of Semarang alluvial plain. e. Base rock : sandstone, conglomerates (Damar Formation) and marine deposit (Tertiary age).
Theoretical aspect related to subsidence
According to the effective stress theory of Terzaghi, the drawdown of piezometric level in an aquifer would increase the effective stress of the soil layer as stated in the equation:
𝜎′= 𝜎 − 𝑢 (1)
where ' is the effective stress, is the total stress and u is the pore water pressure . The increase in vertical effective stress (is equal to the negative change of pore water pressure (– u).When the pore-water pressures are in excess of equilibrium boundary conditions, a consolidation process is initiated. The change in pore-water
pressure can be computed using Terzaghi’s one -dimensional consolidation theory:
𝛿𝑢 𝛿𝑡 =𝐶𝑣
𝛿2𝑢
𝛿𝑧2 (2)
where cv is the coefficient of consolidation.
108
knowledge of the coefficient of volume change, mv
as
Terzaghi consolidation theory analyses the pore water distribution and then calculates the settlement of the soil deposit separately using the effective stress theory. Biot (1955) had a coupled approach of consolidation settlement calculation by adopting the displacement of porous media and pore water pressures as basic variables based on the interaction of pore water and porous media (Lay et.al, 1995). The simplified basic equation for one dimensional solution of the coupled
uz is the soil displacement in z direction (m)
p is the excess pore pressure (kPa)
k is permeability (m/s)
𝛽
is compressibility of pore water
𝜈
is Poisson ratio (dimensionless)
If a soil deposit of thickness H experiences
immediate loading p
o, the consolidation
settlement could be expressed as :
𝑢𝑧=4Π𝑝20𝜂𝐺𝐻
Cv is vertical consolidation coefficient (cm2/s)
Hd is the length of drainage
Numerical modelling of subsidence
The calculation of consolidation settlement using Plaxis 8.2 finite element package is based on the coupled consolidation theory by Biot (1955). The analysis of consolidation involves two steps, the calculation of initial stresses including the hydraulic stress and the second is calculation of consolidation settlement to dissipate excess pore water pressure. Analysis was carried out for selected section along Tanah Mas- Pelabuhan. Comparison of consolidation settlement results were made with calculated results by Terzaghi distance into four sections: section 1(0-400m), section 2 (400-800m), section 3 (800-1200 m), section 4 (1200-1700m).
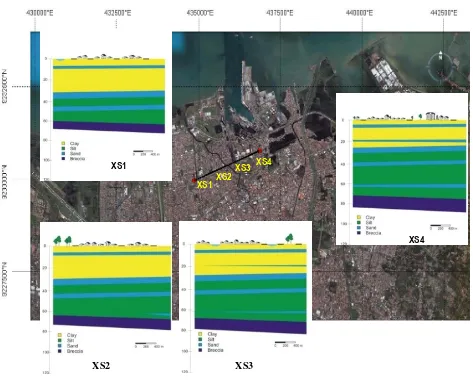
The soil strata along the Tanah Mas-Pelabuhan section consists of
Clay, grey-black, very soft- soft,plastic, N-SPT 2-9, qc 1-10 kg/cm2
Sand, grey, fine, rounded-sub rounded loose, N-SPT 3-5
Clayey silt, brown, firm, N-SPT 18-72
109
Figure 3. Location of Tanah Mas-Pelabuhan (A-A’) and Soil stratification of Tanah Mas-Pelabuhan
(A-A’) section (modified after Marsudi ,2001).
Model parameters
Besides the geometry and soil stratification, the modeling of subsidence requires parameters of the soil geotechnical properties, groundwater level and surface loads.
a.
Geotechnical properties
The sandy clay layer parameters were obtained from geotechnical laboratory tests while the rest were acquired from from land subsidence investigation report published by Direktorat Geologi Tata Lingkungan (Tobing et.al, 2001). The soil elasticity parameters used in the stress– deformation analysis was calculated based on the one-dimensional consolidation test results.
Young’s modulus was computed using the
following equation:
𝐸 = 1+𝜇 (1−2𝜇)
𝑚𝑣(1−𝜇) (11)
Where:
E is Young elasticity modulus (MPa) µ is Poisson ratio
As for non cohesive soil, the elasticity modulus is estimated from N-SPT value (Bowles, 1996) :
E = 0.5 (N-SPT+15) (MPa) (12)
Poisson ratio (ν) for cohesive soil is estimated by
empirical formula from Wroth (1975)
𝜈 = 0.25 + 0.00255 (𝑃𝐼)
Where ν is Poisson ratio and IP is plasticity index.
A
A
’
XS1 XS2
XS3 XS4
XS1
XS2 XS3
XS4
110
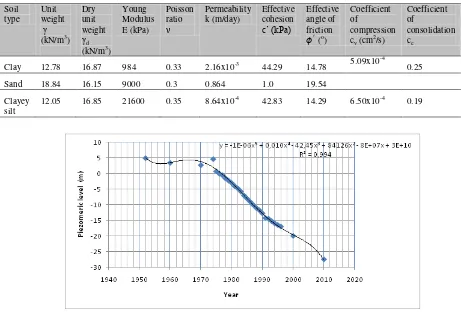
Table 1. Summary of soil geotechnical properties
Soil
Figure 4. Piezometric levels at Pelabuhan area, Semarang from 1952-2010 Poisson ratio () for non cohesive soil is estimated
by empirical formula from Trautmann dan Kulhawy (1987) :
𝜈= 0.1 + 0.3 (𝜙′+ 250)/(450−250) (14)
Where 𝜈 is Poisson ratio and 𝜙′ is effective internal angle of friction.
The summary of soil properties parameters are presented in Table 1.
b.
Groundwater level
Piezometric levels from Pelabuhan area were used in this modeling. Marsudi (2001) collected groundwater levels of confined aquifer of this area from the year 1952-1996. Piezometric level measurement by Direktorat Geologi Teknik during year 2000 showed that the groundwater level had declined to -20 m (Tobing et.al, 2001). Graph of piezometric levels from the year 1952 to the recent measurement by Sudaryanto et.al (2010) was plotted in Figure 4. The graph was fitted with polynomial series of fifth order. Figure 5 showed that over 58 years the groundwater level had declined as much as 32.5 m.
c.
Surface loading
Surface loading is assumed as the sum of loads of buildings (house) and earth fills. Intensive earth filling activities were carried out starting from the year 1980, covering areas of PPRP, Tanah Mas, Bandarharjo, Pelabuhan, Tambaklorog with varying thickness of 1-5 m (Marsudi, 2001).
𝜎 is the overburden pressure (kPa)
𝛾 is the unit weight of earth fills taken as 16.8 kN/m3
h is thickness of earthfills
111 House
Area of house space 9 m2 (assumed)
75% of wall area = 9720 kg/m2 Columns, area 15 x 15 cm = 2250 kg/m2 Floor, thickness of 10 cm = 2160 kg/m2
Plasterboard = 121 kg/m2
Plasterboard hanger = 63 kg/m2
Roof = 700 kg/m2
Total = 14954 kg/m2 Load per m2 = 1661.55 kg/m2
17 kN/m2
Hence total surface load was taken as 60 kN/m2.
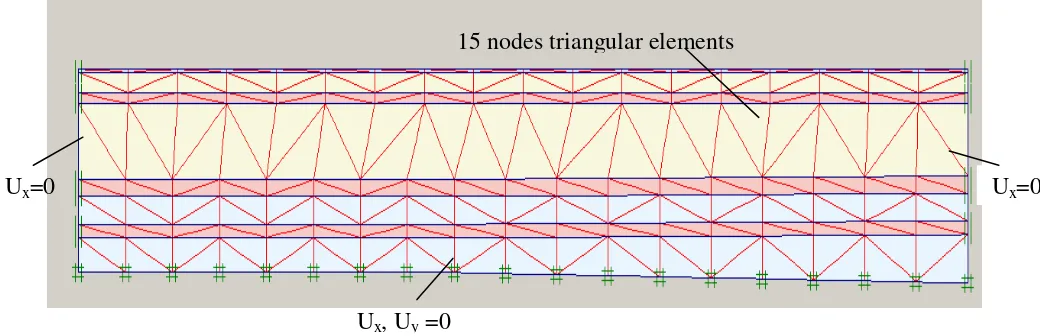
Boundary condition
The following boundary conditions were assumed:
- Stress condition is 2D plane strain
- The geometric mesh elements area triangular
with 15 nodes
- Displacements were zero in both the x and y
directions (Ux, Uy=0) along the bottom of the
geometric mesh (i.e., between the aquifer and the hard stratum). Along the vertical boundary of the geometric mesh (i.e., at both the left and right sides), the soil cannot move in the x direction (Ux =0) but is free to move in the y
direction. Along the exposed ground surface, the soil was free to move in both the x and y directions (Figure 5).
- Initial pore pressure was generated by using
groundwater level of year 1996 (groundwater level -17 m)
- Closed consolidation boundary was applied
along the outer geometric boundary
- Surface load was applied as vertical
distribution load of 60 kN/m2 (Figure 6).
Figure 5. Boundary condition of consolidation modeling
U
x=0
U
x, U
y=0
112
Figure 6. Application of surface load during consolidation modeling
The following modeling scenarios were assumed: A. Changing groundwater levels from the year
2000 (groundwater level -20 m), 2005 (groundwater level -25m) and 2010 (-groundwater level 27.5 m).
B. Changing groundwater levels from the year 2000-2010 as above and application of surface load of 60 kN/m2.
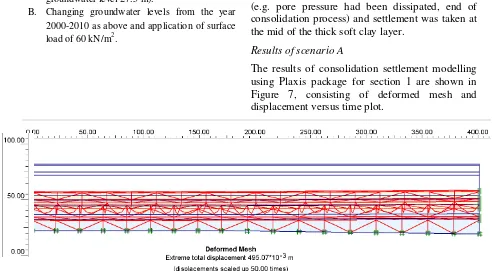
Results of Numerical Modelling
The numerical simulation for the Tanah Mas-Pelabuhan sections was conducted for the period from 1996 until minimum pressure was achieved (e.g. pore pressure had been dissipated, end of consolidation process) and settlement was taken at the mid of the thick soft clay layer.
Results of scenario A
The results of consolidation settlement modelling using Plaxis package for section 1 are shown in Figure 7, consisting of deformed mesh and displacement versus time plot.
Soft clay
Firm silty clay
Loose sand
113 Figure 7. Deformed mesh and displacement (U) versus time plot for section 1 using scenario A
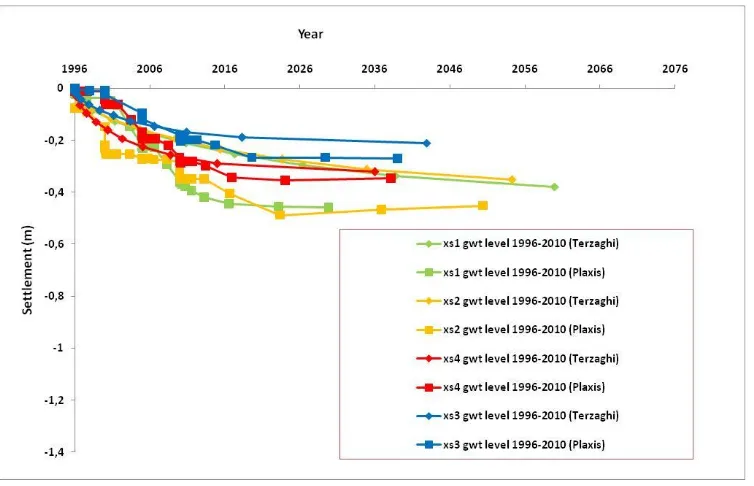
The summary result for all sections and comparison with Terzaghi method is shown in Figure 8.
Figure 8. Results of numerical modeling for scenario A
Figure 8 shows that total settlement due to groundwater drawdown during the year 1996-2010 along section 1-4 ranges between 21-48 cm, the largest settlement at section 1 and 2 and the lowest settlement found in section 4. Settlements calculated using Terzaghi formula and Plaxis appear to be approximately typical with higher settlements computed by Plaxis. The difference is
between 10-12 cm for section 1 and 2 and 2-6 cm for section 3 and 4.
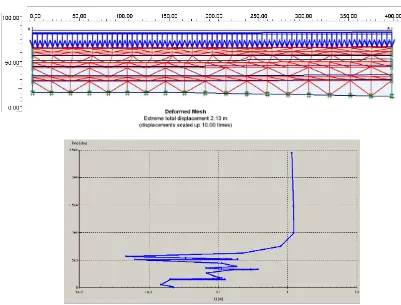
Results of scenario B
114
Figure 9. Deformed mesh and displacement (U) versus time plot for section 1 using scenario B
The summary result for all sections and comparison with Terzaghi method is shown in Figure 11.
115 Figure 10 shows that total settlement due to
groundwater drawdown during the year 1996-2010 plus the application of external load along section 1-4 ranges between 90-120 cm, the largest settlement at section 1 and 2 and the lower settlement found in section 3 and 4. Settlements calculated using Terzaghi formula and Plaxis appear to be approximately identical particularly for section 3 and 4. Settlements calculated by Terzaghi formula and Plaxis for section 2 show typical curves which merge towards the year 2036. Settlement calculated by Plaxis for section 1 is about 20 cm higher than calculated by Terzaghi formula. Provided that the loading parameters do not change, it can be seen that consolidation
settlement is expected to decelerate after the year of 2016 for both scenario A and B.
Verification of numerical modelling results
with the monitoring results
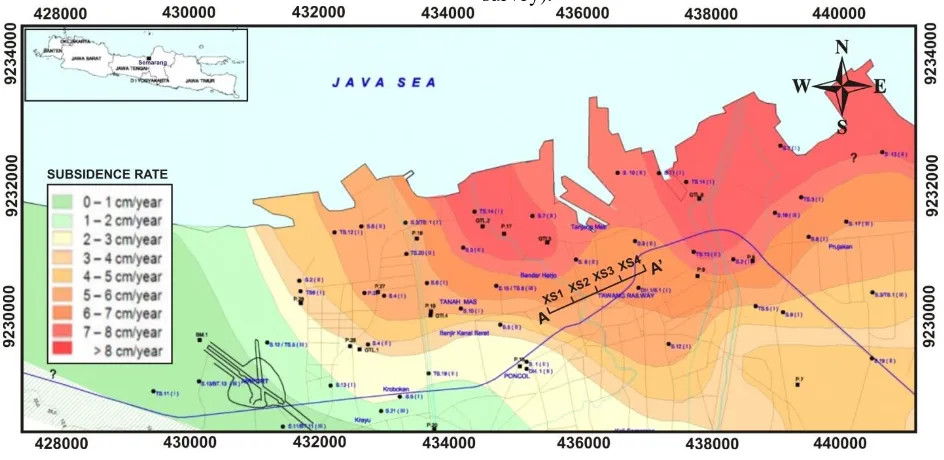
To verify the validity of numerical modeling results, comparisons had been made with subsidence monitoring results by PSI method using SAR images for the period of year 2002-2006 (Kuehn et.al, 2009) and subsidence monitoring results by GPS measurement for the period of 2008-2009 (Abidin et.al, 2010) . The inferred monitoring results and comparison tables for each time period are presented in Figure 11 and Table 2 (PSI survey) and Figure 12 and Table 3 (GPS survey).
Figure 11. Map of PSI derived zones of subsidence rate in Semarang showing selected A-A’ section (modified from Kuehn et.al, 2009)
Table 2. Comparisons of calculated results with subsidence monitoring using PSI method
Section Scenario A (drawdown of groundwater level)
Scenario B (drawdown of groundwater level+ surface load)
Rate of subsidence from monitoring (cm/year) Settlement
during 2002-2006 (cm)
Rate of
subsidence (cm/year)
Settlement during 2002-2006(cm)
Rate of
subsidence (cm/year)
Terzaghi Plaxis Terzaghi Plaxis Terzaghi Plaxis Terzaghi Plaxis
1 4 14 1.0 3.5 8 17 2 4.25 5-6
2 4 4 1.0 1.0 12 19 3 4.75 6-7
3 5 12 1.25 3.0 13 19 3.25 4.75 6-7
116
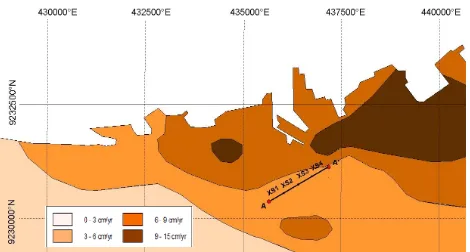
Figure 12. Map of GPS derived zones of subsidence rate in Semarang showing selected A-A’ section (modified from Abidin et.al, 2010)
Table 3. Comparisons of calculated results with subsidence monitoring using GPS method
Section Scenario A (drawdown of groundwater level)
Scenario B (drawdown of groundwater level+ surface load)
Rate of subsidence
from monitoring
(cm/year) Settlement
during 2008-2009 (cm)
Rate of
subsidence (cm/year)
Settlement during 2008-2009 (cm)
Rate of
subsidence (cm/year)
Terzaghi Plaxis Terzaghi Plaxis Terzaghi Plaxis Terzaghi Plaxis
1
1
3
1
3
1
8
1
8
3-62
2
2
2
2
2
3
2
3
3-63
1
3
1
3
2
4
2
4
3-64
2
4
2
4
2
4
2
4
3-6The calculated results using scenario A (drawdown of groundwater level) by Plaxis and Terzaghi formula show much lower settlement rates compared to the monitoring results. Calculated settlement rates in section 1 to 4 during 2002-2006 are 0.75-3.5 cm/year which is lower than the monitoring rates of 5-7 cm/year during that period. While simulated settlement rates during 2008-2009 are1-4 cm/year, slightly below the monitoring rates of 3-6 cm/year.
The calculated results using scenario B (drawdown of groundwater level plus application of surface load) during 2002-2006 by Plaxis show better
agreement of 79-85% to the monitoring results. The settlements calculated for 2008-2009 period are within the range of the monitored range, except for section 1 shows higher rate due to the thickness of soft compressible clay layer at section 1 being higher than in other sections. Calculation using Terzaghi formula is showing lower results for both monitoring period of 2002-2006 and 2008-2009.
DISCUSSION
117 section across Tanah Mas- Pelabuhan shows that
the occurrence of soft, thick, compressible layer at the top part induces consolidation settlement. The exploitation of groundwater from the sandy layer aquifers causes drawdown of groundwater level which accelerates the rate of settlement. Calculation of subsidence in this section shows that settlement due to drawdown of groundwater level (scenario A) accounts for less than 50% of total monitored subsidence. Calculation of rate of subsidence using scenario B (drawdown of groundwater level plus application of external load) generally shows better agreement with monitored subsidence. Comparisons of calculated subsidence and contours of monitored subsidence rates may possibly be different due to the nature of the calculation method used. Numerical simulation was carried out continuously over Tanah Mas-Pelabuhan section, while contours of monitored subsidence rates were extrapolated from scattered monitoring stations. Further study shall examine calculated subsidence at a specific monitored site to obtain more consistent result.
Comparison of settlement computation results with the Terzaghi analytical formula was found to be comparable with reasonably higher settlement computed by Plaxis. One dimensional consolidation theory (Terzaghi, 1925) only accounts for the settlement of clay, omits the settlement of sand layer and does not account for lateral deformation. Plaxis applies Biot consolidation theory (1955) which allows vertical and lateral deformation except at boundary area where deformation is constrained. Also the settlement calculation in Plaxis is worked out for all layers of soil types which explains the settlement calculated by Plaxis generally shows higher results. Plaxis result for section 1 scenario B is notably larger than the Terzaghi result. This is due to the thickness of clay layer in section 1 being the largest and application of external load induces larger horizontal strain. As settlement is the function of the thickness of soil layer and load, larger total strains computed by Plaxis result in larger settlement for section 1 scenario B.
Generally the different rates of subsidence calculated for each section is attributed to the varying thickness of soft compressible layer and or amount of external loads. Variation of subsidence rate would cause differential settlement which would affect the built structures, cracking of foundation and so on. The results of numerical
modeling suggest that drawdown of groundwater level and surface loading accelerates the consolidation of alluvium soil. Land reclamation and loads of building over the study area had imposed additional load to the clay layer and so is the exploitation of groundwater would transfer the effective stress to the clay skeleton. If assumed loads do not change, it is expected that the rate of subsidence shall begin to decelerate after the year of 2016.
CONCLUSION
The findings from land subsidence modeling in the northern part of Semarang city could be summarized as the following. The subsidence in the northern part of Semarang city is quite serious with subsidence rate varying between 1-15 cm/year. The soil strata are composed of thick, compressible soils (e.g. clay and silt alternated with thin layers of sand. The process of land subsidence is mainly governed by consolidation of clay due to application of external load (e.g. buildings, earth fills) and lowering of groundwater table. The results obtained from consolidation settlement numerical modeling of are close to the observed (or monitored) results. The verified numerical modeling method could provide a reasonable tool to estimate future subsidence. The prediction of future subsidence mainly depends on the accuracy of the boundary condition, loading condition and soil properties used in the models.
Uneven settlements were found in the results, most possibly due to non homogeneous soil conditions (e.g.thickness). The amount of subsidence based on numerical modelling is found reasonable. However, the magnitude of the predicted subsidence at a specific location may not be very precise due to limited information on the soil geometry and soil properties. Further studies are required to define more accurately the subsurface condition and geotechnical properties and analyze the consolidation settlement for larger affected area. Information on magnitude, mechanism and quantification of main factors causing land subsidence shall benefit the planning and development of Semarang municipal.
Acknowledgement
118
REFERENCES
Abidin H.Z, Andreas H.,Gamal M., Darmawan D. ,2006. Land Subsidence Characteristics of Bandung Basin between 2000- 2005 as Estimated from GPS surveys. XXIII FIG Congress 2006 Shaping the change. Munich,Germany, 8-13 October 2006. Abidin, H.Z., H. Andreas, R. Djaja, D.Darmawa
and M. Gamal., 2008. “Land subsidence characteristics of Jakarta between 1997 and 2005, as estimated using GPS
surveys”, GPS Solutions, Springer Berlin /
Heidelberg, Vol. 12, No. 1, pp. 23-32. Abidin H.Z, Andreas H., Gumilar I., Sidiq T.P.,
Gamal M., Murdohardono D., Supriyadi, Fukuda Y., 2010. Studying Land Subsidence in Semarang (Indonesia) Using Geodetic Methods.FIG Congress 2010 Facing the Challenges – Building the Capacity.Sydney, Australia, 11-16 April 2010. Nearest-Neighbor Methods, Computers and Geotechnics,Vol. 4, pp. 171-194. Biot, M.A., 1955. Theory of elasticity and
consolidation for a porous anisotropic solid, J.Appl.Phys. 26(2), pp.182-185. Bowles, J. E., 1996. "Foundation analysis and
design", 5th edition, McGraw-Hill, New York, N.Y., U.S.A., 1175 pp.
Chai J-C, Shen S-L, Zhu H-H, Zhang X-L., 2004. Land subsidence due to groundwater drawdown in Shanghai. Geotechnique 54(2):143–147.
Departemen Pekerjaan Umum., 1987. Pedoman Perencanaan Ketahanan Gempa untuk Rumah dan Gedung, SKBI-1.3.5.3.1987. Kuehn, F., Hoffmann-Rothe, A., Albiol, D.,
Cooksley, G., Duro J., Granda, J., Haas, S., Murdohardono, D., 2009. Detection of land subsidence in Semarang, Indonesia using persistent scatterer interferometry.
Proceedings of Asian Association on Remote Sensing 2009. http://www.a-a-r-s.org/acrs/proceeding/ACRS2009/Papers/ Oral%20Presentation/TS33-03.pdf
Lay, S.W and Shieh, J.Y.H., 1995. The step loading model of subsidence induced by groundwater level changes with time. Proceedings of the fifth International Symposium on Land Subsidence, The Hague, October 1995. IAHS Publ.no.235, pp.313-321.
Marsudi., 2001. Prediksi Laju Amblesan Tanah di Dataran Aluvial Semarang Propinsi Jawa Tengah. Disertasi Doktor Bidang Hidrologi- Rekayasa Pertambangan, Institut Teknologi Bandung.
Plaxis BV., 1998. Plaxis Finite Element Code for
Soil and Rock Analysis, user’s manual.
Plaxis BV, Delft, Netherlands.
Semarang City., 2009. Oficial website of Semarang munipality). Address :http://www.semarang.go.id/, access date: March 25, 2011.
Sudaryanto, Delinom, R.M., Suherman D, Lubis R.F, Sukmayadi D, Zaenal., 2010. Hidrologi Daerah Urban dan Pesisir : Studi Kasus Daerah Semarang dan Sekitarnya. Laporan Teknis-tidak diterbitkan, Pusat Penelitian Geoteknologi LIPI. Bandung. Sun H, Grandstaff D, Shagam R., 1999. Land
subsidence due to groundwater withdrawal: Potential damage of subsidence and sea level rise in southern New Jersey, USA. EnvironGeol 37(4):290–296.
Terzaghi, K., 1925. Erdbaumechanik auf bodenphysikalischer Grundlage, Deuticke, Wien.
Thaden, RE, Sumadirdja H, Richards.P.W., 1996. Peta Geologi Lembar Magelang-Semarang, Jawa. Direktorat Geologi, Bandung.
119 Trautmann, C. and F. Kulhawy., 1987. CUFAD -
A Computer program for compression and uplift foundation analysis and design. Report EL-4540-CCM, Vol 16. EPRI, 148 p.