EXPERIMENTS WITH NOTARIES ABOUT
THE SEMIOLOGY OF 3D CADASTRAL MODELS
J. Pouliota, C. Wanga, V. Fuchsb, F. Huberta, M. Bédardc
a Department of Geomatics Sciences, Université Laval, Quebec City, Canada, (jacynthe.pouliot; frederic.hubert) @scg.ulaval.ca and [email protected])
b École supérieure des géomètres et topographes, Le Mans, France, [email protected] c Groupe VRSB, Quebec City, Canada, [email protected]
Commission II, WG II/2
KEY WORDS: 3D symbolization and cartography, semiology, visual variables, user’s requirements, 3D cadastre
ABSTRACT:
Based on the hypothesis that 3D cadastral models are helpful for notaries, this study investigates the performance of visual variables for the visualization of 3D models. The approach undertaken uses face-to-face interviews with notaries involved in co-ownership establishment. A 3D geometric model of a complex condominium building is used as the studied case to which a selection of visual variables is applied. Thirty visual solutions are tested against six notarial visualization tasks and notaries are asked several questions. Based on the preliminary responses, we can now say that colour is the visual variable most appreciated by notaries, regardless of the visualization task. The use of transparency is helpful in many cases, more specifically when reading annotation (official measures). However, confusion arises when too extensive geometry of 3D lots is viewed simultaneously, and unnecessary when the geometry of the lots is fully visible. Moving the position of the geometry of a group of lots (by floor for example) looks also promising. Although this interview-based approach is subjective and empirical, it helps us to better consider the end-user’s interests and take into consideration their professional opinion and requirements. The 30 visual solutions produced during these first experiments constitute a useful foundation for further analysis.
1. INTRODUCTION
Visualizing 3D models on a computer display screen is now part of the regular tasks done by a number of users (Bleisch 2012; Häberling, et al., 2008; Wood et al., 2005). 3D visualization software usually provides tools to change the graphical appearance of 3D models (e.g. changing the colour of the faces, the size of the borderline, etc.). Viewing tools are often generic from the perspective of cartographic design aspects while users are free to change the visual aspects of the 3D model. This customizing approach for viewing needs presents some advantages such as enabling the creation and the combination of custom symbols for a specific purpose, but may also limit the opportunity of having coherent and standardized 3D visual solutions to support decision making (MacEachren and Kraak, 2001; Rogowitz et al., 1996). This situation is estimated more crucial when the application of 3D models is rather novel such as in a cadastral domain where the user-notaries are not experts in 3D viewing or designing software and not aware of the risk of producing a 3D visual solution that is inadequate or even incorrect.
Consequently, supporting the end-users with respect to semiology aspects when viewing 3D model appears to be a necessity. Many works exist on 2D mapping design (Bertin, 1967, Brewer et al., 1997; Garlandini and Fabrikant, 2009) and some appear in 3D modelling (Foss et al., 2005; Häberling et al., 2008; Pegg 2009; Trapp et al., 2010). How the semiology influences decision making is a primary concern in these references. As regards 3D viewing, several questions still require fine-tuning, such as whether or not 2D mapping rules fully apply to 3D. Do standards for good practices to symbolize 3D models exist? Do other specificities relate to 3D model visualization? For example, Pegg (2008) concluded that
viewing angles and illumination are prominent factors in 3D models compared to visual variables. Hardisty (2001) suggested reflectance was another visual variable in the theoretical investigation of 3D visualization and recognized that light sources, cameras and even fog are persuasive visual properties.
Many works in the literature already addressed the advantages of using 3D cadastral models (Aien et al. 2011; Ekbäck 2011; Erba, 2012; Pouliot et al., 2010; Stoter, 2004). Assuming that 3D cadastral models of a condominium may optimize decision making for notarial purposes, this study will assess some visual variables and enhancement techniques to support this process. The study will address this question by estimating whether some of the visual variables (position, colour, texture, value) and the enhancement technique (transparency) perform better for notarial decision making within the context of co-ownership establishment. Assessing 3D visual solutions is done through interviews with civil law notaries; the users targeted for these first experiments. We view this as a valuable approach to gain a better understanding and integrate the end-users' point of view, not that of the 3D model’s designer. In some ways, this approach appears unique in cadastral applications compared to other methods observed in the literature. Moreover, few analyses of visual variables and 3D model integrate professional tasks or users in the assessment. This strategy also has limits that will be discussed in the conclusion.
This study is a follow-up to the preliminary tests conducted last fall with theoretical users, tasks and 3D models (Chen et al., 2012). In the present research, a real case of a complex building was used, with notaries who are currently performing notarial tasks regarding the condominium (e.g. delimitation of property right). The notaries are acting within the context of Quebec civil International Archives of the Photogrammetry, Remote Sensing and Spatial Information Sciences,
law. The ultimate purpose of these research activities is to guide the establishment of 3D cartographic design aspects and to promote good practices in 3D modelling activities applied to non-conventional domains.
The paper is organized as follows. Section 2 presents the experimental setup for the interviews. Section 3 proposes a preliminary analysis of the results. Section 4 provides a conclusion and opens up discussions about future works.
2. EXPERIMENTAL SETUP FOR THE INTERVIEWS
2.1 Visualization tasks
The experimental framework first established a list of 3D visualization tasks deemed to be necessary for notaries in establishing co-ownership limits applied to condominium building. The condominium includes 3D lots that correspond to the minimal administration unit of the Quebec cadastral system to establish property right. This list of 3D visualization tasks will help in structuring the interviews, the questions to be asked, and further analysis. This list was validated together with notaries. Height visualization tasks were identified, while six have served to test the visual variables as:
1.See the geometric limits of the 3D lots
2.Characterize a specific 3D lot according to its official information
3.Locate a specific 3D lot inside the building
4.Distinguish the limits of the 3D lot and the associated building
5.Distinguish the private and common parts of the condo 6.Understand the spatial relationship (mainly the
neighbouring relationship) between 3D lot and its surrounding lots
Some of these tasks will help us to test the suitability of the visual variable for selection purpose (tasks 1, 2, 3) while others will focus on the associative capability of the visual variables in order to identify group of similar objects (tasks 4, 5, 6).
2.2 3D Visual solutions
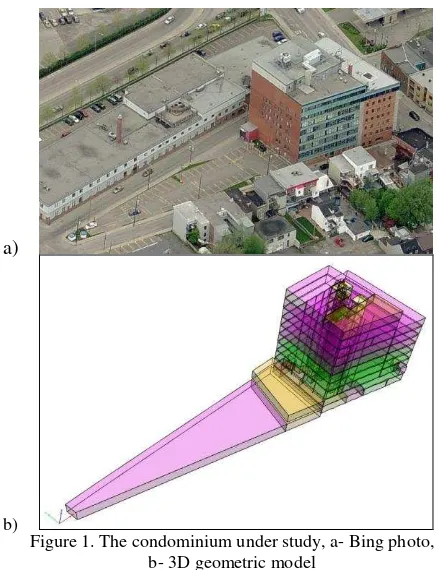
The next step is to determine a set of 3D visual solutions to be tested. Based on the original 3D geometric representation of the condominium created by the Groupe VRSB using AutoCAD, a set of 3D cadastral models of the condominium, named as 3D visual solutions, are produced. Figure 1 shows the building under study that is approximately 30 m in width, 32 m in length, 36 m in height (10 floors), 70 3D lots (20 private units and 50 common units). The 3D model proposes the geometry of the 3D lots and its corresponding annotations (official measures such as the lot number, the length of the boundaries, the surface and the volume).
For each 3D visual solution, a specific visual variable is applied. Since the number of possible combinations of visual variables (possibly seven) and enhancement techniques is quite high, a pre-selection was performed to limit the duration of the experiment and to optimize analysis of the results. The pre-selection takes into account the theoretical performance of each variable (Brewer et al., 1997; Carpendale, 2003; Chen et al., 2012; Fosse et al., 2005; Garlandini and Fabrikant, 2009; Halik, 2012) and a maximum of five 3D visual solutions per task. The visual variables tested in these first experiments are colour (hue) with and without transparency, colour (saturation), position, value with and without transparency and texture with and
without transparency. The transparency was tested in using various levels of opacity (10%, 30% and 60%). The visual variables are applied either to the boundary line, the volume or the annotation (the official measures of the lot). For each task, the appreciation of the typical black and white representation (boundary lines in black and volumes in white) was also tested since this solution is frequently included in the literature and in practice. The final set of tested 3D visual solutions is comprised of 30 cadastral models representing the condominium.
a)
b)
Figure 1. The condominium under study, a- Bing photo, b- 3D geometric model
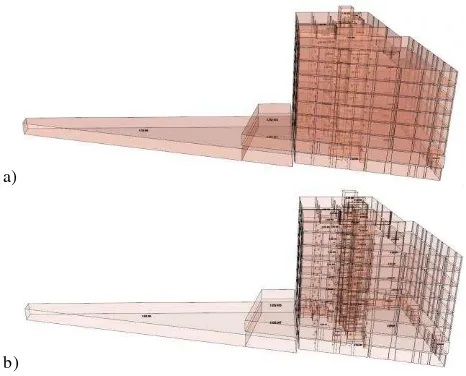
For efficiency purposes in the context of representing a complex building with multiple floors, some 3D visual solutions show only one floor, while others present many floors (depending on the considered task). Figure 2 presents two of the selected visual solutions for task 1 when one floor is tackled. Figure 3 presents two of the selected visual solutions for task 3 when many floors are tackled.
a)
b)
Figure 2. 3D Visual solutions, a- B&W (boundaries in black and volumes in white) and b- monitoring the colour (boundaries in black and volumes with distinct colour) International Archives of the Photogrammetry, Remote Sensing and Spatial Information Sciences,
a)
b)
Figure 3. Visual solutions monitoring the transparency of the volume a- 70% and b- 90%
2.3 Interviews with notaries
The methodology used to perform the visual variable assessment consists of holding face-to-face interviews with a notary, seated in front of the computer, with limited interventions on the part of supervisors. During the interviews, notaries were presented with a proposed 3D cadastral model, for which they had to respond to a series of questions related to visualization tasks. Two categories of questions are prepared.
The first group of questions is based on factual elements such as “How many lots are you able to count?” and the answers can be easily validated. The initial idea of this step of the experiment was to let the notaries play with the 3D model in using 3D visualization software (such as Acrobat 3D PDF). However, since most of the notaries are not familiar with such 3D visualization software and time constraints had to be managed, videos were prepared in which a specific 3D model animation is presented. The video animation guides the notaries in the visualization process by turning the 3D model (vertical or horizontal) upside down, zooming in and out when required, depending on the visualization task. The notaries may stop, rewind and fast forward the video as they wish. Using prebuilt videos of animated 3D models helps us reduce the impact of the 3D visualization software learning process while retaining some benefits of the navigation aspect of 3D model visualization.
The second group of questions examines the preference of viewers between two visual solutions presented side by side. Only snapshots are accessible for this second group of questions. The notaries are free to express any or no preference.
To perform the test with the notaries and since the focus of these tests is only on the visualization aspects, no legend is used in the experiment, and mainly the visual aspect of the 3D model may influence the responses and preferences of the viewers. During the interviews, all of the users’ comments and the times are recorded.
As regards the sampling of notaries for these first tests, two factors have guided our decision: 1) if the notaries already performed co-ownership establishment about the condominium studied; and, 2) if notaries are interested in 3D cadastral modelling. By now, only three notaries have been interviewed,
but more interviews are already scheduled for the coming weeks.
3. ANALYSIS OF RESULTS
Presentation of all of the results extracted from the interviews would be too lengthy to expose and not helpful to appreciate the performance of the visual variables. Instead, we will summarize the results in presenting some trends detected within coherent responses. The following synthesis is prepared for each tested visual variable.
Colour (hue)
With or without transparency, the colour is among the preferred visual solution compared to value and texture for selection purpose. For these first tests, we did not test the importance of specific colour.
Colour (saturation)
Colour (saturation) performed well to allow the association of lots into two groups. For example in task 4 where the administrative and the building limits have to be distinguished the colour (saturation) was appreciate by the notaries.
Value
Value compared to texture was more performing to allow the association of lots intro two groups like in tasks 4 and 5. But the preference indicated by the notaries was not coherent with this conclusion since when comparing side by side the texture were more appreciate. As mentioned, value was less performing compare to colour for selection purpose as in task 1.
Texture
Texture was only tested to enhance the association of lots into two groups and for this purpose; it was not performing although for task 5 it was appreciate by notaries. Some of the notaries mentioned that texture is helpful to represent physical object like the building walls or the stairs.
Position
Changing the position of the geometry and the annotation were tested. Positioning the annotation outside the geometry was not appreciated, neither performing. The annotation should be placed on the line, in the surface or the volume. Presenting floors detached by a constant distance was appreciated to visualize the touching relationship between neighboring lots on the same level, but as expected it was not performing to identify lots that are on top or down.
Transparency
For selection purpose like in tasks 1 and 2, the 40% transparency did not perform well compare to 0% transparency. For instance combining colour and transparency did not improve the results (ended less preferable by the notaries). Nevertheless when associative purpose is required like in tasks 5 and 6, the transparency was helpful and appreciated since it enhances the distinction between groups of object. Similarly, for readability purpose like in task 3, a high degree of transparency (between 70% and 90%) was likely the more appreciate and performing. But the current results could not make any conclusion about what should be the degree to use. More investigations are required.
To conclude this first phase of analysis, we may also discuss the overall performance and preference of visual variables tested so far. The tests show that colour (hue and saturation) applied to International Archives of the Photogrammetry, Remote Sensing and Spatial Information Sciences,
the volume perform well, no matter is the visualization task evaluated. The use of transparency is helpful in some cases, more specifically when reading annotation (official measures). However, confusion arises when too extensive geometry of 3D lots is viewed simultaneously, and unnecessary when the geometry of the lots is fully visible. About the typical black and white representation (boundary lines in black and volumes in white) and regardless the task, .this visual solution did not performed well. Nevertheless this first analysis based on a limited number of tests should be more investigated since the black and white representation is often used in several domain of practice.
4. DISCUSSION AND FUTURE WORKS
Based on the hypothesis that 3D cadastral models are helpful for notaries, this study investigated their appreciation of visual variables for viewing 3D models. The approach undertaken is mainly empirical and based on interviews with notaries involved in co-ownership establishment. This approach helps us to better consider the end-user’s interests and take into consideration their professional opinion and requirement. The approach has the advantages of being oriented to specific visualisation tasks and tested for one domain of application (cadastre).
However, this approach also presents some limitations such as being subjective, dependent on the visual solutions tested and the visualization tasks performed, and the fact that it is currently limited to three interviews. We already scheduled interviews with two other notaries who previously worked with the condominium studied. The difficulty in finding other complex condominiums, with available 3D models, and notaries interested in the 3D modelling process, is a challenge. For information purposes, Quebec City currently has 220 notaries, among whom approximately only 20% are working in co-ownership. If we estimate those notaries potentially interested in 3D modelling to be 30%, the statistical population would then be 15. With a confidence level of 95% and to keep the margin of error below 25%, we would then require at least 8 interviews with notaries.
When selecting a notary for interview, it is important to take into account the impact of whether or not they have previously worked with the condominium, since it may influence the response during the experiments. Performing the experiments with notaries who are unaware of the condominium’s context has already been planned. Testing the 3D visual solutions with inexperienced notaries such as university students could also be a potential avenue to explore for further tests. These students will be the next generation of notaries and initiation to 3D modelling may be an interesting value-added in their training program and as up-and-coming professionals.
Six visualization tasks for notarial purposes were presented and 30 visual solutions were tested in changing colour (hue and saturation) value, texture, position, transparency. The results show that, similar to 2D cartography, colour (hue) is one of the promising solutions for visualisation tasks when selection purpose is required. Transparency and colour (saturation) were performing when association of lots into similar group is concerned. Moving the position of the geometry of objects, as proposed in cartographic generalisation principles, seems promising and more investigation is required. Regardless these preliminary results some visual solutions would require fine-tuning and a larger number of visual solutions would be
required, depending on the task. The 30 visual solutions produced during these first experiments nevertheless form a useful foundation for further analysis.
Furthermore, during these first experiments, two complementary tasks were tested with notaries (understand the overlapping relationship between the building and the land-parcel and contextualize the condo with its environment). Since these complementary tasks were not focusing on visual variables but more about the content, we did not discuss them in this paper. Nevertheless interesting results arise and investigations will have to done.
The use of videos was helpful to monitor the time and the learning process but it also limits us, or the users, to specific animation. 3D-model navigation is thus quite limited and loosely integrated in the test. Additional tests with 3D viewing tools are anticipated.
One other concern is the fact that, for these tests, each visualization task was considered separately. However, with a 3D viewing tool, a user should be able to perform all of these tasks without changing the representation of the 3D lots. A certain combination of tasks would be studied in a subsequent phase. In the same manner, for the time being, the combination of visual variables was not tested.
The premise of this work regarding the fact that 3D models are valuable tools for cadastral applications may also be questioned. As previously indicated, many works in the literature already addressed this topic and this is why we decided to take it as a true assumption. Yet during the interviews with notaries, most of them were still concerned about having a better understanding of the uses for 3D cadastral models. Should we read into this statement on a deeper level and try to demonstrate the real value-added of 3D models for cadastral applications? The subject might still be up for debate.
Other questions remain unanswered such as the study of the visual variables when viewing other kinds of properties such as superficy right or the use of visual variables in combination with legend and semantic information (or integrated with a 3D database management system). The outcomes of these research activities would have to be placed in the context of current practices or standards for 3D visualization or modelling, such as CityGML, BIM or COLLADA.
5. ACKNOWLEDGEMENTS
We would sincerely like to thank the notaries who participated in the interviews and the Groupe VRSB for providing the original datasets of the condominium. We would also like to extend our gratitude to Francois Brochu, notary and professor at Université Laval, and Marc Vasseur, a master’s student, who were both a great help in validating the visual solutions and the visualization tasks. Finally, we express our thanks to the Natural Sciences and Engineering Research Council for founding this research program.
6. REFERENCES
Aien, A., A. Rajabifard, M. Kalantari, & Williamson I., 2011. Aspects of 3D Cadastre-A Case Study in Victoria. in FIG Working Week. Marrakech, Morocco, 18-22 May 2011. Bertin J., 1967. Sémiologie graphique, Paris, Mouton/Gauthier-Villars.
International Archives of the Photogrammetry, Remote Sensing and Spatial Information Sciences,
Bleisch, S. 2012. 3D Geovisualization - Definition and Structures for the Assessment of Usefulness. ISPRS Archives of Photogrammetry, Remote Sensing and the Spatial Information Sciences.
Brewer, C. A., MacEachren, A. M., Pickle, L. W., & Herrmann, D. 1997. Mapping Mortality: Evaluating Color Schemes for Choropleth Maps. Annals of the Association of American Geographers, 87(3), pp. 411–438.
Carpendale, M.S.T., 2003. Considering visual variables as a basis for information visualisation. Dept. of Computer Science, University of Calgary, Canada, Tech. Rep. 2001-693-16. http://dspace.ucalgary.ca/bitstream/1880/45758/2/2001-693-16.pdf
Ekbäck, P., 2011. Towards a Theory of 3D Property Rights - With an Application to Nordic Legislation. In: Nordic Journal of Surveying and Real Estate Research,8 (1), pp. 65-80. Erba, D. A., 2012. Application of 3D Cadastres as a Land Policy Tool, In: Land Lines, the quarterly journal of the Lincoln Institute of Land Policy, April 2012, pp. 8-14.
Fosse, J. M., Veiga, L. A. K., & Sluter, C. R., 2005. Color Hue As A Visual Variable In 3d Interactive Maps. In IEEE International Conference on Commnunications, Vol. 55, Seoul, Korea.
Garlandini, S., & Fabrikant, S., 2009. Evaluating the Effectiveness and Efficiency of Visual Variables for Geographic Information Visualization. Spatial Information Theory, 195– 211.
Häberling, C., Bär, H., & Hurni, L., 2008. Proposed Cartographic Design Principles for 3D Maps: A Contribution to an Extended Cartographic Theory. Cartographica. The International Journal for Geographic Information and Geovisualization, 43(3), pp.175–188.
Halik, Ł., 2012. The analysis of Visual Variables for Use in the cartographic Design of Point Symbols for Mobile Augmented Reality Applications. In Geodesy and Cartography. 61(1), pp. 19–30.
Hardisty, F., 2001. Cartographic Animation in Three Dimensions : Experimenting with the Scene Graph. In the Proceedings of the 20th ICA/ACI International Cartographic Conference, Beijing, P.R.China.
MacEachren, A. M., & Kraak, M.-J., 2001. Research Challenges in Geovisualization. Cartography and Geographic Information Science, 28(1), pp.3–12.
Pegg, D., 2009. Design Issues with 3D Maps and the Need for 3D Cartographic Design Principles. Academic Papers. http://lazarus.elte.hu/cet/academic/pegg.pdf (April 2013). Pouliot, J., T. Roy, G. Fouquet-Asselin, and J. Desgroseilliers, 2010. 3D Cadastre in the province of Quebec: A First Experiment for the Construction of a Volumetric Representation. in Advances in 3D Geo-Information Sciences, (Series: Lecture Notes in Geoinformation and Cartography), Springer-Verlag, Eds: Kolbe, König and Nagel. Berlin, Nov. 3-4, pp.149-162.
Stoter, J., 2004. 3D Cadastre. Netherlands Geodetic Commission (NCG): Publications on Geodesy 57. PhD thesis, Delft University of Technology, the Netherlands.
Stoter, J., & Van Oosterom, P., 2006. 3D Cadastre in an International Context: Legal, Organizational and Technological Aspects. CRC Press, Taylor & Francis Group. Trapp, M., Beesk, C., Pasewaldt, S., & Döllner, J., 2010. Interactive Rendering Techniques for Highlighting in 3D Geovirtual Environments. In the Proceedings of the 5th 3D GeoInfo Conference, XXXVIII, 12669–12669.
Wang, C., Pouliot, J., & Hubert, F., 2012. Visualization Principles in 3D Cadastre : A First Assessment of Visual Variables. In the Proceedings of the 3rd International
Workshop on 3D Cadastres: Developments and Practices, pp. 309–324.
Wood, J., Kirschenbauer, S., Döllner, J., Lopes, A., Bodum, L., 2005. Using 3D in Visualization. In Exploring Geovisualization. ed. / J. Dykes; A. M. MacEachren; M.-J. Kraak. Oxford, UK : Pergamon Press, pp. 295-312.
International Archives of the Photogrammetry, Remote Sensing and Spatial Information Sciences,