DELINEATION OF BUILDING FOOTPRINTS FROM HIGH RESOLUTION SATELLITE
STEREO IMAGERY USING IMAGE MATCHING AND A GIS DATABASE
G. R. Dini, K. Jacobsen, C. Heipke
Institute of Photogrammetry and GeoInformation (IPI) Leibniz Universität Hannover, Germany
Nienburger Str. 1, 30167 Hannover, Germany, [email protected]
KEY WORDS: matching, edges, building, GIS Database, High Resolution, Satellite Images
ABSTRACT
In this paper, a workflow is proposed to delineate building footprints from high resolution satellite stereo images through integration of a Digital Surface Model (DSM), 3D edge matching technique and GIS building polygons. First, Digital Surface Models (DSM) and a normalised DSM are derived by traditional image matching. Three different removal masks are employed to reduce the effects of matching errors, roads and vegetation. We then compare all resulting blobs with the GIS 2D building layer. For blobs without a partner in the database, building outlines are extracted based on 3D edge matching. To do so, edges on epipolar images are first detected individually on each image using the Canny operator. After removing short edges and extracting straight lines, we find the best corresponding lines using various constraints. Finally, the topological relationship of the derived 3D edges is employed to reconstruct the shape of the building and the building footprints using a box-fitting approach. Our experiments on GeoEye-1 stereo images show promising results if buildings are large enough, have simple shape and show good contrast compared to the background.
1. INTRODUCTION
1.1 Motivation
Along with the development of Earth observation, image-based updating of geospatial databases has significantly gained in importance. Updating of building databases using remote sensing imagery supported by automatic photogrammetric techniques is a key point in many applications and has been a focus of research for many years. However, due to the complexity of the task, automatic procedures are still only rarely being applied in real-world projects, justifying the need for additional research and development. In the meantime, the development of very high resolution space borne sensors with a possibility of multiple imaging provides improved opportunities for automatic 3D object extraction such as buildings.
1.2 Problem Description and Objective
In previous work on building change detection from high resolution satellite images (Dini et al., 2012), we subtracted DSMs stemming from different epochs for building updates. This paper also contains a detailed review of the literature, to which we refer the reader of the current paper for further information.
The DSMs were generated using image matching techniques. Our experiments have shown that, although the proposed method could detect building changes, it is not a reliable method in term of delineating building outlines, mainly due to the insufficient resolution of the DSMs. Furthermore, the 3D nature of the buildings results in occlusions and shadows with associated matching errors. As a consequence, blurred building outlines, often with an overestimated size are the result, see also (Alobeid et al., 2010), (Le Bris & Chehata, 2011).
In this paper, we compare blobs from a current, normalised Digital Surface Model (nDSM) derived from stereo images with
building footprints of a, possibly outdated, GIS database to detect changes. In addition, we aim at delineating new building outlines by applying 3D edge matching. Section 2 describes the dataset used in our study as well as the employed pre-processing steps. Section 3 contains a description of our approach. First experimental results along with conclusions are reported in sections 4 and 5, respectively.
2. DATA SOURCES AND PRE-PROCESSINHG
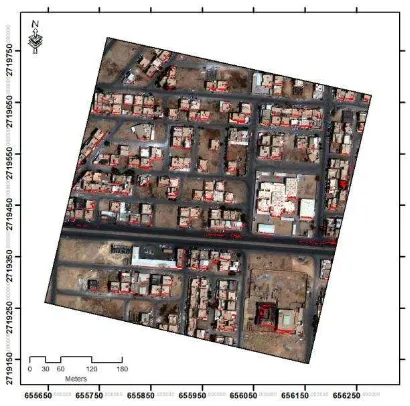
Our experiments are carried out using pan-sharpened RGB stereo image pairs from GeoEye-1 with a ground sampling distance of 0,5m and a base-to-height ratio of 1:1.5, that was acquired on Sept. 15, 2009. The study area is a suburb of Riyadh, the capital city of Saudi Arabia and has a size of550×500m2. Image orientation and epipolar images were computed on the basis of rational polynomial coefficients (RPC). For DSM generation we employed semi-global matching (SGM, Hirschmüller 2008) using the panchromatic channel.
In addition, we have at our disposal a somewhat outdated GIS database. It does not contain all the buildings which can be seen in the images.
3. DETECTION OF BUILDING FOOTPRINTS
3.1 Overview
We propose a method for the detection of footprints of newly constructed buildings based on an old GIS database and a new space borne stereo image pair. After pre-processing (see previous chapter), we classify all resulting blobs into existing and new building candidates. Blobs either correspond to buildings in the GIS layer (in which case the GIS information is confirmed and kept) or they don't (in which case we assume to have found a candidate for a new building, if a number of additional constraints are fulfilled). Note that we do not International Archives of the Photogrammetry, Remote Sensing and Spatial Information Sciences,
consider the possibility for buildings to have been changed or demolished at this stage of our research.
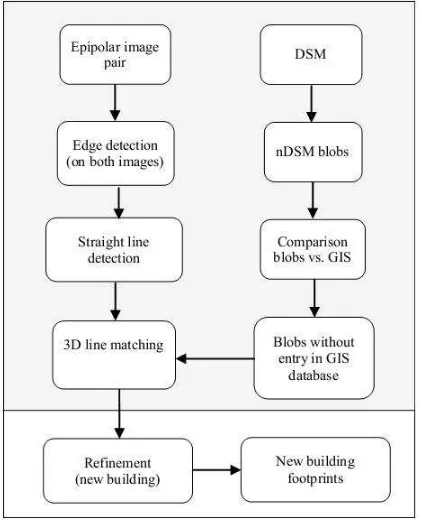
For blobs belonging to hypotheses for new buildings the images are then investigated to extract straight lines. After line matching, the resulting 3D lines are further processed into buildings. The overall concept is shown in Figure 1.
Figure 1. Diagram for detection of footprints of new buildings
3.2 Generation of nDSM blobs and noise removal
For the detection of changes in building footprints, we first compute blobs (local height maxima) in the DSM. We filter the DSM (Niemeyer et al., 2010) to derive a digital terrain model (DTM), and then subtract the DEM from the DSM pixel by pixel, resulting in a nDSM. nDSM values larger than 2,5m are considered to be part of building blobs.
In order to reduce the rate of false alarms we first apply a morphological opening in order to eliminate very small blobs, which cannot possibly represent buildings. Further false alarms can stem from matching errors, buildings standing close to each other and vegetation (in particular trees). In our method the effects of these potential errors are reduced by applying three removal masks:
Matching error mask
Occlusions, shadows and regions with poor texture are well-known sources of matching errors. We employ the left-to-right consistency check to detect mismatches (Hannah, 1989). A pixel is considered mismatched if matching the pixel from the left to the right images, and subsequently back from the right to the left image yields a position difference in the left image channel for our study area. Thus, we did not have the possibility to detect vegetation using the normalized difference vegetation index (NDVI). Alternatively, we constructed a vegetation mask based on a maximum likelihood classification of the pan-sharpened RGB image, using the nDSM as additional channel.
These three masks were then intersected with the blob results, and blobs, which were considered as matching errors, roads and/or vegetation were discarded from further processing.
3.3 Checking for existing buildings
For the detection of changes in building footprints, the remaining nDSM blobs are compared with the building layer of the existing GIS database. We assume that GIS building footprints, which overlap at least to 75% of their extent with one or more blobs, represent correct GIS object. Since we explicitly exclude the possibility of building changes and demolition in our study, we can use the GIS polygon as the building outline for these objects. If available, height information from the GIS database is compared to the average blob height to determine buildings. In order to accurately delineate their outline we make use of the image information. The rationale is twofold: (a) images have a finer resolution and can thus deliver a higher level of detail, and (b) building outlines are clearly visible in images, namely as straight lines. Therefore, extracting straight lines in the stereoscopic image pair and subsequently matching those lines should deliver useful information for delineating the buildings. The actual building reconstruction itself then needs to be performed based on the 3D lines and the blob information in a final step.
We first detect edges in each stereo pair individually using the Canny operator, then these edges are pre-processed by removing short lines (lines shorter than 3m). Inspired by (Lee et al., 2006) for all remaining edge pixels we calculate the twos eigenvalues in a given neighbourhood by applying principal component analysis (PCA). Pixels with one large and one small eigenvalue are accepted as part of a straight line. This method is rather sensitive to the template size and to noise. Nevertheless, an overall investigation on the performance of various methods has revealed that the PCA-based method is still more robust than other approach (e.g. Hough transform). Finally, we use the Douglas-Peucker algorithm to simplify the PCA output and have fit best straight line to the result using end-points (Ok et al., 2012b), (Werner & Zisserman, 2002).
We then apply 3D edge matching based on a several constraints. First we re-project an area around the blob under investigation into image space. Epipolar geometry reduces the search space further; additional geometric constraints related to the expected building shape, and a proximity constraint is applied to find the best corresponding straight lines.
Epipolar constraint
The epipolar constraint is often used in line matching (see e. g. Ok et al. 2012). It yields an area in which the corresponding line should lie. The extent of this area varies according to the maximum allowed parallax. As the end-points of homologous International Archives of the Photogrammetry, Remote Sensing and Spatial Information Sciences,
straight lines are normally not identical in the two images due to variation in illumination, viewing direction etc. we buffer the computed regions similar to (Baillard et al., 1999). This improves the chances that we do not miss homologous line just because of the displacement of end-points.
Further geometric constraints
Similar to (Ok et al., 2012) we reduce the number of possible matches by introducing additional constraints, namely on the
orientation angle, line length, line mid point.
The orientation is a rather stable property of straight lines. On the other hand, the line orientation in image space depends on the line orientation in object space. In our study area, most roof lines are horizontal. Therefore, we can require homologous lines to have the same orientation in the two epipolar images. We use a threshold of 5° for the maximum difference between the orientations of homologous straight lines. Furthermore, we assume the lengths and the midpoint of the two lines to be similar, again using user-determined thresholds.
Proximity constraint
Enforcing the described constraints results in initial line matching candidates which in general are still ambiguous. Additional radiometric constraints, i.e. requiring regions flanking those lines to have similar spectral properties or a high cross correlation coefficient as suggested e.g. by (Ok et al., 2012), does not work in our case, mainly due to the occlusions and the limited GSD of the images. Therefore, we prefer to refine the results in another way, which we call proximity constraint.
Assuming the roofs do not have any detectable roof structure and therefore show homogeneous texture, we argue that lines depicting the building outline are those which have a shortest distance from the building centre - any lines representing shadows or other objects such as roads lie further away from that point. Starting from the centre of gravity of the blob under investigation (which we take to be the building centre) we thus resolve ambiguities by selecting the lines nearest to the building centre as homologous. Note that due to the other geometric constraints, these lines lie on the same side of the building centre (left or right in the epipolar image) and have the same orientation. Distances are computed as Euclidean distance between the building centre and the mid point of the line.
Finally, we fit a 3D box to the results of line matching. For this task we use the algorithm of (Sirmacek et al., 2010) and refer the reader to that reference for further detail. The footprint of that box is considered as the footprint of the new building.
4. RESULTS AND EVALUATION
In this section, we present the experimental results of the described methodology. As we have previously presented results for blob detection and comparison with a GIS database (Dini et al., 2012) in this paper we concentrate on new buildings. We start with the three removal masks discussed in section 3.2.
Matching errors are detected based on subtracting the two disparity maps resulting from left-right and right-left matching, see Figure 2. As expected, our experimental results show that most matching errors lie in areas of occlusion and shadow and in regions with poor texture, e. g. asphalt. However, in some cases vegetation causes similar matching problems.
Figure 2. Mismatch mask, superimposed to one GeoEye image
As asphalt areas cause problems in the matching stage, the road network mask is a good tool to further reduce errors. The GIS road network superimposed to one of the images is shown in Figure 3.
Figure 3. Road mask, superimposed to one GeoEye image
The third mask is generated by supervised maximum likelihood classification (MLC) using he pan-sharpened image and the DSM as additional channel. Two classes, namely vegetation and non-vegetation, are defined via carefully selected training sites.
Based on manually extracted reference data an overall accuracy of about 75% was reached, see also Figure 4 and Table 1. In Table 1 TP (True Positive) refers to the number of vegetation pixels classified correctly, FP (False Positive) is the number of pixels incorrectly detected as vegetation; FN indicates the number of missed vegetation pixels. Although training sites were carefully chosen, a lack of further radiometric information causes a significant value for FP.
Parameter TP FP FN Sum
No. of Pixels 12138 3674 982 16794
Table1. Quantitative evaluation of vegetation classification International Archives of the Photogrammetry, Remote Sensing and Spatial Information Sciences,
Figure 4. Vegetation mask derived from MLC classification, superimposed to one GeoEye image.
After applying the three removal masks to the blobs, the remaining blobs are compared against the GIS building polygons. As mentioned before, polygons which overlap to at least 75% with one or more blobs are considered to be correct. The other blobs represent candidates for new buildings.
Figure 5. GIS polygons (yellow), verified buildings (green), blobs representing new construction (red), superimposed to one
GeoEye image
In figure 5, the yellow polygons represent building outlines of the GIS database, the superimposed green area shows accepted buildings. The blobs in red are classified by our method as new buildings, the corresponding (somewhat extended) areas of change are shown in Figure 6. As can be seen, due to various reasons at this point there are still many false alarms. Although these false alarms do not fundamentally disturb the overall results, since the building outlines are detected using the image information in the next step, we will investigate the problems in order to reduce the false alarm rate in the future.
Some results of edge and line detection can be seen in Figure 7. For line matching the epipolar and geometric constraints are used to reduce the search space. In the yellow box in figure 8 shows how the epipolar constrain works: the straight line in the left image is deleted, because there is no corresponding line in the right image.
Figure 6. Areas of change potentially containing new buildings (red), superimposed to one GeoEye image.
Finally the proximity constraint is applied to eliminate ambiguous matchings. Figure 9 shows some results. Green lines found a proper match, lines which could not be matched are shown in red. In this figure, only the left sample shows acceptable matching performance.
Figure 7. Sample of straight line detection: (left) edge detection using the Canny algorithm and PCA; (right) straight lines after
line simplification
The results obviously indicate that when buildings have more complex structures or there is insufficient contrast for edge extraction and line matching, no homologous lines can be found. However, in more simple cases and for larger buildings 3D edge matching is able to delineate building outlines.
Figure 8. Matching of straight lines in epipolar images; the yellow parallelograms show how the epipolar constrain reduces
matching candidates; the black circles show ambiguous cases (for further explanation see text).
Finally, Figure 10 shows the building outlines that are detected using 3D edge matching (red lines). If at least three sides of a rectangular building footprint are detected completely, box fitting can be used to construct a rectangle.
R
Figure 9. Sample of match (green) and un-match (red) straight lines, first building footprint on left side could be reconstructed
but in the other two cases, only few line are matched.
Up to now, among all new constructions, only four building footprints could be reconstructed at present. Also, one of them is reconstructed using three sides, one of which is too short; therefore the final box is smaller than the real size of building footprint
Figure 10. Outline delineation for new buildings using 3D edge matching.
5. CONCLUSIONS AND FUTURE WORK
In this paper we have described an approach for automatically detecting building footprints using stereoscopic high resolution satellite images supported by a GIS database. We have presented the results of GIS building polygon verification using blobs derived from a nDSM as well as line matching and 3D box fitting to delineate the outlines of new buildings. Our experimental results deliver promising results for buildings provided that these are sufficiently large, have a simple rectangular shape and good radiometric contrast compared to surrounding objects. On the other hand, for complex buildings in built-up areas, our approach has more problems, especially when building outlines cannot be clearly detected in both epipolar images. Although a more refined building reconstruction approach will improve the results to some
degree, at first priority a finer ground sampling distance than the 0,5m is needed to obtain better results.
In can be concluded that while our last work (Dini et al., 2012), the subtraction of two DSMs derived from SGM, can be used as an alarm system for building change detection, it is not an efficient tool for delineation of building outlines. In contrast, line matching and 3D box fitting can delineate building outlines provided that they have a good radiometric contrast with an
The authors gratefully acknowledge the financial support of the German Academic Exchange Service (DAAD) for the project A/08/97951. We are also grateful to Dr. Sirmacek and Dr. Ok for technical support, providing software and valuable discussions. The images were provided by the Ministry of Municipal and Rural Affairs, The Kingdom of Saudi Arabia.
6. REFERENCES
Alobeid, A., Jacobsen, K. & Heipke, C., 2010. Comparison of Matching Algorithms for DSM Generation in Urban Areas from IKONOS Imagery. Photogrammetric Engineering and Remote Sensing, 76(9), pp.1041-50.
Baillard, C., Schmid, C., Zisserman, A. & Fitzgibbon, A., 1999. Automatic Line Matching and 3D Reconstruction of Buildings from Multiple Views. In IntArchPhRS vol. 32 (Part 3-2W5), 69–80.
Dini, G.R. et al., 2012. 3D Building Change Detection Using High Resolution Stereo Images and a GIS Database. In 22nd ISPRS Congress, Melbourne, IntArchPhRS vol. XXIX-B7,pp.. 299-304, 2012.
Hannah, M.J., 1989. A System for Digitial Stereo Image Matching. Photogrammetric Engineering and Remote Sensing, 55(12), pp.1765-70.
Hirschmueller, H., 2008. Stereo Processing by Semiglobal Matching and Mutual Information. IEEE Transactions on Pattern Analysis and Machine Intelligence, 30(2), pp.328-41.
Le Bris, A. & Chehata, N., 2011. Change Detection in a Topographic Building Database Using Submetric Satellite Images. In: Stilla et al. ed. PIA11. International Archives of Photogrammetry, Remote Sensing and Spatial Information Sciences 38 (3/W22).
Lee, Y.-S., Koo, H.-S. & Jeong, C.-S., 2006. A Straight Line Detection Using Principal Component Analysis. Pattern Recognition Letters, 27, no. 14, pp.1744-54.
Niemeyer, J., Rottensteiner, F., Kühn, F. & Soergel, U., 2010. Extraktion Geologisch Relevanter Strukturen auf Rügen in Laserscanner-Daten. In DGPF Jahrestagung, 298-307.
Sirmacek, B., dAngelo, P. & Reinartz, P., 2010. Detecting Complex Building Shapes in Panchromatic Satellite Images for Digital Elevation Model Enhancement. In ISPRS Istanbul Workshop 2010 on Modeling of optical airborne and spaceborne Sensors, IntArchPhRS Vol. XXXVIII, part 1/W4.
Werner, T. & Zisserman, A., 2002. New Techniques for Automated Architectural Reconstruction from Photographs. In European Conference on Computer Vision., 2002.