ORTHO IMAGE AND DTM GENERATION WITH INTELLIGENT METHODS
H. Bagheri a *, S. Sadeghian ba Dep. of surveying engineering Tafresh University, Tafresh, IRAN - [email protected]
b Geomatics College of National Cartographic Center (NCC), Tehran, IRAN - [email protected]
Commission WG I/4, WG II/4
KEY WORDS: Geospatial information, Geometric modelling, Height interpolation, Genetic Algorithm, Artificial Neural Network
ABSTRACT:
Nowadays the artificial intelligent algorithms has considered in GIS and remote sensing. Genetic algorithm and artificial neural network are two intelligent methods that are used for optimizing of image processing programs such as edge extraction and etc. these algorithms are very useful for solving of complex program. In this paper, the ability and application of genetic algorithm and artificial neural network in geospatial production process like geometric modelling of satellite images for ortho photo generation and height interpolation in raster Digital Terrain Model production process is discussed.
In first, the geometric potential of Ikonos-2 and Worldview-2 with rational functions, 2D & 3D polynomials were tested. Also comprehensive experiments have been carried out to evaluate the viability of the genetic algorithm for optimization of rational function, 2D & 3D polynomials. Considering the quality of Ground Control Points, the accuracy (RMSE) with genetic algorithm and 3D polynomials method for Ikonos-2 Geo image was 0.508 pixel sizes and the accuracy (RMSE) with GA algorithm and rational function method for Worldview-2 image was 0.930 pixel sizes. For more another optimization artificial intelligent methods, neural networks were used. With the use of perceptron network in Worldview-2 image, a result of 0.84 pixel sizes with 4 neurons in middle layer was gained. The final conclusion was that with artificial intelligent algorithms it is possible to optimize the existing models and have better results than usual ones. Finally the artificial intelligence methods, like genetic algorithms as well as neural networks, were examined on sample data for optimizing interpolation and for generating Digital Terrain Models. The results then were compared with existing conventional methods and it appeared that these methods have a high capacity in heights interpolation and that using these networks for interpolating and optimizing the weighting methods based on inverse distance leads to a high accurate estimation of heights.
* Corresponding author. Tafresh university, Dep. Of surveying & civil engineering, IRAN, Tell (+98 862) 6227430 1. INTRODUCTION
With the successful launch and deployment of Ikonos-2 satellite in September 1999, and QuickBird-2 in 2001, GeoEye-1 in 2008, WorldView-2 in 2009, the era of commercial high resolution earth observation satellites for spatial information extraction from them began.
Nowadays the high resolution satellite images are one of the most important sources for geospatial information system. Successful exploitation of the high accuracy ortho-photo from high resolution systems depends on a comprehensive mathematical modelling of the imaging sensor. An orbital parameter model can be applied to stereo space imagery in order to determine exterior orientation parameters. Unfortunately the precise ancillary data (position, velocity vectors and angular rates) of the satellite platform have not been provided with IKONOS-2 and Worldview-2 imagery; therefore alternative ways of camera modelling need to be employed. Recently, several 2D and 3D approaches have been reported to tackle this issue (Fraser et al., 2002a, Sadeghian et al., 2001b, Sadeghian & Valadan, 2011). They do not require interior orientation parameters or orbit ephemeris information. The image to object space transformation solution is based only upon Ground Control Points (GCPs). This is an advantage for processing the new high resolution satellite imagery (HRSI).
Maximum Three-dimensional modelling of the Earth is one of the most important tools for studying in various fields of geology, meteorology, civil engineering, environmental engineering, and numerous engineering projects that have many applications in the Geospatial Information System (GIS) (Mesnard, 2013). GIS can generally be used to create the Digital Train Modelling (DTM) to display topography and synthetic changes and all environmental parameters such as temperature, air pollution, etc (Li et al., 2004). One of the most significant parameters in GIS is the topography elevation of the Earth, which can be visualized in 3D digital form to represent the Digital Elevation Model (DEM). In other words, DEM continuously differentiates the surface elevation of the Earth, which is directly proportional to the plane position (x,y) (Abdul-Rahman & Pilouk, 2008). Initially, 3D models were created physically from plastic, sand, clay, etc. (Li et al., 2004). Today, however, computers are used to display the Earths’ continuous surfaces in a digital form. One of the most important issues in the field of digital modelling is to generate the DEM with high quality and precision and keeping minimum costs. To estimate a continuous surface, due to the limited number of samples and the necessity of reproducing altitude points, the mathematical interpolation functions are used to estimate the elevation of midpoints (Abdul-Rahman & Pilouk, 2008). Interpolation methods are used to determine unknown altitudes
of midpoints from the samples and as a result, the coordinated
points are reproduced and the digitally formed Earths’
continuous surfaces can be visualized. Since any interpolation has mainly errors, those errors can be expanded through the calculations and processes. The results from interpolation are achieved and the Standard Deviation (SD) of the facts is not acceptable. Such errors transfer inaccurate assessments in the executable projects and convey the financial losses and even their life threatening results (Mitas & Mitasova, 1999). Therefore, one of the challenges in this method is to find an appropriate way in which the data source not only consists of accuracy and distribution of sample points but also, contains
geomorphological characteristic of the Earth’s Surface. The method in question for interpolation and the estimation of the
middle points’ height, will affect the quality and the accuracy of
DEM (Li, 1992a).Numerous methods for the interpolation have been proposed, which shows different results influenced by the
environment’s conditions and data input. Usually, the optimal
method of interpolation depends on the Root Mean Square Error (RMSE) of the output. In most studies the comparison of interpolation methods and the selection of the optimal methods are used to achieve higher accuracy (Li & Heap, 2011, Wagnera & et al., 2012)
In this paper the geometric potential of Ikonos-2 and Worldview-2 with rational functions, 2D & 3D polynomials were tested. Also comprehensive experiments have been carried out to evaluate the viability of the genetic algorithm for optimization of rational function, 2D & 3D polynomials. Another optimization artificial intelligent method, neural networks were used. Also Artificial Intelligent (AI) techniques such as NN and GA were examined to optimize the interpolation methods and the creation of DEM on the samples. At the end, the results of the estimated heights from the intelligent techniques and the usual methods of interpolation are compared.
2. GENETIC ALGORITHM
In 1960, Rechenberg presented the basic idea of evolutionary algorithms, where GA can be derived from. This is, in fact, a computerized search method, which is based on the optimizations algorithms, genes and chromosomes, founded in Michigan University by Professor Holland and then further developed.
In this algorithm, due to being derived from nature, stochastic search processes are used for optimization and learning problems. Overall operations of this algorithm are; fitting, selecting, combining and mutating (Haupt, 2011).
3. ARTIFICIAL NEURAL NETWORK
Artificial Neural Networks (ANN) is moulded based either on the performance of the human brain and its functionality or its actions can be interpreted according to the human conduct (Picton, P.2000). Investigations show that this network has the ability of learning, reminding, forgetting, concluding, pattern-recognition, classification of information and many other brain functions. NN is essentially made up of simple processing units called neurons. ANN structures are in the form of layers, which consists of input layer, output layer and one or more intermediate layers. Each layer contains several neurons that are connected by a network, which has different weights
4. ORIENTATION MODELS FOR SATELLITE IMAGE
In the following discussion, non- rigorous models such as RF, 2D & 3D polynomials method are introduced as potential
approximate sensor models to substitute for the Orbital parameter model of sensor.
Rational Function: Under the model, an image coordinate is determined from a ratio of two polynomial functions, in which the image (x,y) and ground coordinates (X,Y,Z) have all been
The RF method maps three-dimensional ground coordinates to image space for all types of sensors, such as frame, pushbroom, whiskbroom and SAR systems, 2D & 3D polynomials are specialized forms of the RF model, and we consider these models.
2D & 3D Polynomials: These models describe the relation between image and object independent of sensor geometry with the following general equation: coordinates and x, y are image coordinates. In 2D polynomial, Z variable have been removed.
These means modelling is only based on mathematical functions that can be solved by well-distributed GCPs. Term selection is the most crucial stage in using RF, 2D & 3D polynomials terms so that their parameters can be determined by GCPs to obtain appropriate accuracy. This stage usually performed in a trial and error process. The use of intelligent methods for this purpose seems to be good substitute to optimize RF, 2D & 3D polynomial models according to GCPs (Valadan et al., 2007).
5. APPLICATION OF GA AND ANN IN GEOMETRIC MODELLING OF SATELLITE IMAGE
5.1 GA for Non-rigorous model Optimization
First step for using non-rigorous models such as 2D & 3D polynomials and RF is determination of optimum form and effective terms of these methods for relationship between train and image spaces. Optimum form of polynomials and RF depends to imaging geometry, topography of the area, number and distribution of Ground Control Points (GCPs).
GA is used to evaluate the effect of the presence or absence of various terms in genetic as well as control points that consists of two parts. One of these parts is for the optimization of the process including control points to find the optimal chromosome. This is referred to as GA Check Points (GACPs). The second part is the independent checkpoint, where the polynomial functions are used to find the most effective functions. For this purpose, a singular binary chromosome in the form of a series of zeros and ones is used. The digit zero indicates non-interference and the digit one indicates the interference. In the process of GA, optimal chromosomes that
show the best polynomial term obtained. Coefficients of the terms are determined by the least squares method during this process. In this study, RF and 2D & 3D polynomials are examined. For the GA optimization, firstly the chromosomes must be formed and an initial population created. Each chromosome is made up of variables that are essentially the polynomial coefficients, which is interpreted as gene. Gene 1 represents in the desired term of polynomial and gene 0 represents the interference term in the polynomial. The first algorithm optimization process consists of an initial population of chromosomes and the coefficients that can be calculated by control points through the least squares method and using checkpoints to determine the remaining residue. So by employing control points, checkpoints and the dependent variable (RMSE), optimal chromosomes are formed. After finishing the optimal processes, the other checkpoints, which have no interference in the process optimization, the obtained chromosomes will be evaluated. In other words, the process of determining proper coefficients for polynomial with algorithm is used to evaluate the final chromosome, known as Independent Check points (ICPs).
5.2 Using Neural Networks in Geometric modelling of satellite image
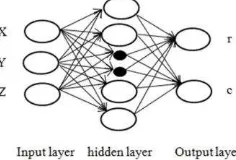
Geometric image of satellite images based on ANN uses the Perceptron network, which consists of three layers; an input layer, an intermediate layer and an output layer. Structure and network topology is shown in Figure 1. Three neurons in the input layer are components of X, Y, Z, terrain coordinates and the output layer of neuron is component of x and y, image coordinates of points.
Figure 1. Network Perceptron with a Hidden Layer for the geometric modelling of satellite images
Training is based on the Marquarlt-Levenberg method. In the network learning process, the control points are used for training and a series of checkpoints for validation and for testing/evaluating; independent checkpoints are used for the perceptron network with a hidden layer (Saati et al., 2008). The
error signal based on the RMSE is created and the sum of weight is used to achieve the minimum RMSE.
5.3 Case Studies
For assessment of results from optimization of RF, 2D & 3D polynomials by GA, two different types of satellite images (2 cases study) was used. In following, the characterizations of case studies and images have been expressed:
Case study 1: the Worldview-2 panchromatic images employed covered a 17 x 14 km area of north-west Tehran city in the centre of Iran. It was acquired on 9 September 2010 with a 16.6° off-nadir angle.
In this investigation, the elevation within the Worldview-2 test area ranged from 1200 m to 2100 m. For optimization by GA has been used from 30 GCPs, 12 GACPs (CHC-1 points) and 16 ICPs (CHC-2 points). The results of optimized models by GA have been compared with conventional form of them in ICPs.
Case study 2: for second case study, the Geo Ikonos-2 panchromatic image was used. The Geo Ikonos-2 image covered 15x11 km area of Hamadan city in Iran. It was acquired on 7 October 2007 with a 20.4° off-nadir angle. In this investigation, the elevation within the Geo Ikonos-2 test area ranged from 1700 m to 1900 m. In this case study 52 GCPs, 15 GACP (CHC-1points) and 12 ICPs (CHC-2 points) are used. In both case studies the GCPs/ICPs for the tests were extracted from NCC-product 3D digital maps, which employed a UTM projection on the WGS84 datum. In case study 1, 2 the mapping scale was 1:2000, 1:1000 respectively with the compilation have been carried out using 1:4000 scale aerial photographs. The selected GCPs/ICPs in the imagery were distinct features such as building and pools corners, and wall and roads crossings, etc. The image coordinates of the GCPs/ICPs were monoscopically measured using the PCI software system.
5.4 Results
For optimization of geometric modelling has been used a binary GA coded algorithm with Matlab 7.8 software. Number of genes in any chromosome is number of polynomial term in 2D & 3D polynomials and RF models. Every model in varying degree of polynomial is optimized by binary GA code. First degree polynomials of models have been excluded from the optimization process due to the low number of variables. In GA process rate of mutation is 0.15, total population is 700 and every population has 20 chromosomes. Since GA use a random process for optimizing and every run, results change, the best result (minimum RMSE) has been expressed in table 1.1, 1.2
Conventional form RMSE (pixel size) Optimized by GA
RMSE (pixel size) Num.
of terms Model
RMS in CHC-2 RMS in
CHC-1 RMS in
ICP (CHC-2) RMS in
GACP (CHC-1)
1.01 1.34
3.59 5
12 2th degree-2D polynomial
1.12 1.31
1.03 1.25
20 3th degree-2D polynomial
1.03 1.82
1.00 1.18
30 4th degree-2D polynomial
1.00 1.27
0.96 1.02
20 2th degree-3D polynomial
1.95 6.00
0.95 0.98
40 3th degree-3D polynomial
2558 6865
0.98 1.09
70 4th degree-3D polynomial
1.7 6.38
0.93 1.02
29 2th degree-RF
78 34
0.95 0.96
59 3th degree-RF
Table 1.1 Result of Optimization of 2D Polynomial, 3D Polynomial, RF model by GA for Worldview-2 image
Conventional form
Table 1.2 Result of Optimization of 2D Polynomial, 3D Polynomial, RF model by GA for Geo Ikonos-2 image
Worldview-2 image, by evaluation of results is characterized that 2D conventional polynomials have high accuracy than optimized form of it in the second degree. In the higher degree 3D polynomial and RF model, 3th& 4th degree 3D polynomial and 2th & 3th degree RF model, number of variables increase and GA can be useful. Accuracy of optimized 3th degree 3D polynomial and 2th degree RF model is higher than conventional form of them. In conventional form of these models, RMSE is higher than 1 pixel size. In conventional form of 4th degree 3D polynomials and 2th & 3th degree rational, we encounter with a non-regularized inverse problem and it causes that RMSE in CHC-2 points (ICPs) will be unreasonable. The reasons of non-regularization in inverse problem are:
i) Dependencies between the coefficients with increasing number of them in.
ii) Effect of distribution and number of GCPs in dependency between variables.
For regularization of inverse problem is needed to find an optimum regularization parameter that this work is very difficult. By using GA, we can resolve non-regularized inverse problem without need to find optimum regularized parameter. In GA process, the solutions with high costs are excluded, therefore non-regularized solutions is removed from cycle. RMSE in Optimized RF model by GA 0.93 pixel size while RMSE for conventional RF model is 1.7 pixel sizes. In Geo Ikonos-2 image, results of optimization 2D & 3D polynomials and RF model have been expressed in table 1.2 too.
These results show that GA optimize the non-rigorous models like 2D & 3D polynomials and RF model especially when increasing degree of polynomials in models. In Geo Ikonos-2 image, the best result achieved by 4th degree 3D polynomial optimized by GA that RMSE was 0.508 pixel sizes.
In summary these results show GA is very useful and efficient for geometric modelling in Worldview-2 and Geo Ikonos-2 satellite panchromatic images.
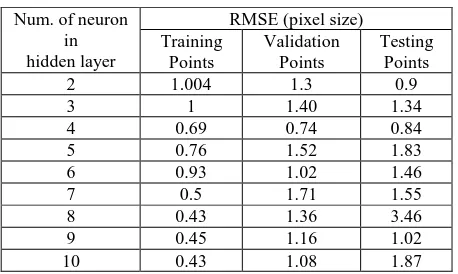
The ANN method was used for geometric modelling of Worldview-2 satellite image only. In ANN method following settings has been used:
Num. of training epochs: 1000, The lower limit of gradient: 1.00e-10, The upper limit of gradient: 1.00, Num. of ground control points: 31, Num. of validation points: 12, Num. of testing points: 15, 0.001<µ< 1.00e+10.
For different number of neurons in hidden layer, the following results have been obtained. The results show for different number of neurons in hidden layer, the RMSE of control, validation and testing points change.
With 1 neuron in hidden layer didn’t achieve appropriate result
and is removed from table 2. The best result with minimum RMSE in testing points achieved with 4 neurons in hidden layer that value of RMSE is 0.84 pixel sizes. Therefore ANN method is able for geometric modelling of satellite images.
RMSE (pixel size)
Table 2. Results of geometric modelling of satellite images with artificial neural network method. 2004, Yang examined different methods for interpolation according to the accuracy and applicability by using Surfer 8.0 software. These methods can be divided into different criteria (Abdul-Rahman & Pilouk, 2008). For example, interpolation methods based on surface coverage divided into local and global criteria. In the global methods, the height of all control points are used to estimate the heights for the unknown points,
but in the local methods, calculation of unknown points’ heights
are derived from the height of the neighbours’ points. In this research, the Inverse Distance Weighting method of interpolation is used to estimate the heights at the unknown points within the local methods, which are explained in the following:
Inverse Distance Weighting Method: In Inverse Distance Weighting (IDW) method, the height information of neighbouring points according to the distance of unknown points and used based of weight. Weight is a function of the distance from the unknown point and hence closer points have higher weights. For height calculation, the following equation is used:
In this equation, p is the speed reducer weight control rate according to distance, where it is equal to 2, di is the distance from unknown point to well-known point and zi represents the height of point i (Mesnard, 2013, Lu & Wong, 2008).
7. APPLICATON OF GA AND ANN IN HEIGHT INTERPOLATION
7.1 Using GA in Optimization of Inverse Distance Weighting Method
GA, control and check points can be used to optimize the magnitude of weight and consequently proper weight is achieved. In this article, from the control points and the series of checkpoint (1) as the GACPs can be used to evaluate the strength of optimization. Finally, the strength obtained from GA is substituted in the IDW equation and as a result the accuracy of the algorithm from the series of checkpoint (2) as the independent checkpoints obtained through the optimization process with GA (ICPs) are examined and evaluated.
7.2 Using ANN in Height Interpolation
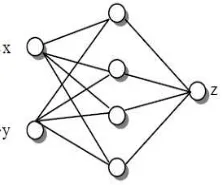
Interpolation of elevations based on ANN uses the Perceptron network, which consists of three layers; an input layer, an intermediate layer and an output layer. Structure and network topology is shown in Figure 2. Two neurons in the input layer are components of x and y and the output layer of neuron is component of z. Training is based on the gradient method. In the network learning process in both data points for training and a set of checkpoints; checkpoint (1) are areas of validation and checkpoint (2) is the independent checkpoint, these are used for testing and evaluating the precision interpolation networks. The error signal based on the RMSE is created and the sum of weight is used to achieve the minimum RMSE.
Figure 2. Network Perceptron with a Hidden Layer for the Interpolation Heights
7.3 Data Assessment and Evaluation Criteria
In order to evaluate smart and ordinary interpolation methods, two parts are commonly used. Part one is the existing software AutoCAD Civil 2D Land Desktop 2009 and part two is the acquiring data for mapping 1:2000 in Port Khamir, which is located in Hormozgan State, south of Iran. In both parts, numbers of points are used as the control points and two points are considered as the checkpoints. The points in both parts are shown in the Table 3. Using control points and interpolation methods, the heights of the checkpoints (1) and (2) are obtained and it is compared with the actual height. Finally, the extent of errors that exist in the calculated elevations through standard interpolation methods can be determined by using RMSE rate.
7.4 Results
IDW interpolation method is used for changing the power of inverse distance and both data sets have been tested and presented in Table 4:
Table 3. Area Profile 1, 2
Table 4. Results Obtained from IDW Method
Inverse Distance
Power
RMSE from First Series (m)
RMSE from Second Series (m) CHC(1) CHC(2) CHC(1) CHC(2)
1 2.940 3.489 0.902 0.956
2 2.003 2.417 0.779 0.854
3 1.565 1.859 0.693 0.792
Table 5. Results from IDW Optimisation Method with GA
As shown in Table 4, the RMSE rate with different powers of inverse distance on two sets of series, the checkpoint values is
obtained in metres. In both data sets minimum RMSE values are obtain, which is greater to the power of 3.
Using GA, control points and checkpoints (1) can be optimised for each set of examined test points that are obtained. The results can be checked against checkpoints (2) where it is independent to the optimisation process. In this case, the optimisation methods like IDW has a set of control points and a series of checkpoint (1) in the algorithm process used to extract the relevant terms and the results are collected and evaluated against the checkpoint (2). Tables 5 compare the results that are achieved by using GA with the IDW method.
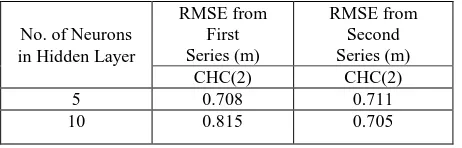
In NN interpolation, the control points are used for training and a series of checkpoints (1) for validation and for testing/evaluating; checkpoints (2) are used for the perceptron network with a hidden layer of 5 neurons and 10 neurons, considering the first period size and with momentum 0.7Ns, the following results have been obtained (table 6).
In order to compare and evaluate different methods of interpolation, the results of the current methods and AI techniques are collected from the RMSE through the series of checkpoint (2).
Elevation Changes (m)
No. of Control Points
No. of Checkpoint (1)
No. of Checkpoint (2)
Regional Dimensions
Area Profile 1 16 123 28 26 250 x 275
Area Profile 2 6 75 18 18 450 x 300
Indices Optimization
First Series Checkpoint
Second Series Checkpoint
2.67 2.964
RMSE (m) GACP ICP GACP GACP
0.662 0.978 0.466 0.684
The reason for this is that the AI techniques at the series of checkpoint (1) in the optimisation process of interpolation parameters and for the network validation in GA can be used.
No. of Neurons in Hidden Layer
RMSE from First Series (m)
RMSE from Second Series (m)
CHC(2) CHC(2)
5 0.708 0.711
10 0.815 0.705
Table 6. Results of Interpolation using ANN
Therefore, to ensure that the results of the optimisation process are valid, a series of checkpoint (2) is used as the independent checkpoints. Consequently, the RMSE rates obtained from the conventional interpolation methods and AI techniques are compared with a series of checkpoint (2). In the first region, AI techniques results in better accuracy rather than conventional methods. However, in the second region, AI techniques produce better accuracy, but little accuracy difference exists in respect to conventional methods. The AI techniques within both regions, best accuracy exists within ANN and weighted optimisation based on the inverse distance with respect to GA and their accuracies are equivalent.
8. CONCLUSION
In this paper application of intelligent methods like GA and ANN for geospatial information extraction was investigated. In first, GA and ANN algorithm were used for geometric modelling of satellite image. For this purpose 2 case studies linked 2 different satellite images was used. One of the images was Worldview-2 satellite image that is basic image. Basic imagery products are designed for users with advanced image processing capabilities and no geometric correction has been applied to the image before and so all geometric errors are present on the image. In case study 1, with the use of perceptron network, a result of 0.84 pixels with 4 neurons in middle layer was gained for Worldview-2 image and the final conclusion was that with GA and ANN algorithms it is possible to optimize the existing models and have better results than usual ones. In conventional form of 2D & 3D polynomials and RF model, with increasing polynomial variables we encounter to non-regularization problem while in GA optimization process, the solutions with high costs are excluded, therefore non-regularized solutions is removed from cycle and another is need to regularization. Another image was IKonos-2 Geo image. Geo image products are designed with a modest absolute geometric accuracy. Therefore some geometric errors are removed from the image before. In this study was used only GA for optimization of 2D & 3D polynomials and RF models. these results show that use of GA optimize the non-rigorous models like 2D & 3D polynomials and RF model especially when increasing degree of polynomials in models.
In second research, ability of GA and ANN for height interpolation in raster DTM production process was discussed. In the evaluation of the results, it is concluded that the use of AI techniques for height interpolation is effective and has a higher level of accuracy compared to conventional methods, especially in areas with high elevation. In order to GA is used and optimal weighting parameters is achieved by IDW method. ANN is able to determine an appropriate weight to indicate the best estimated elevation in unknown altitude regions.
9. REFRENCES
Abdul-Rahman, A. & Pilouk, M. (2008). Spatial Data Modelling for 3D GIS. USA: Springer.
Fraser, C.S., Baltsavias, E. & Gruen, A. (2002a). Processing of Ikonos imagery for submeter 3D positioning and building extraction. ISPRS Journal of Photogrammetry & Remote Sensing, 56, 177-194.
Haupt, R.L. & Haupt, S.E. (2011). Practical Genetic Algorithm. (3rd Ed.). John Wiley & Sons.
Li, Z.L. (1992a). Variation of the accuracy of digital terrain models with sampling interval. Photogrammetric Record, 14(79),113–128.
Li, J., Heap, A.D. (2011). A review of comparative studies of spatial interpolation methods in environmental sciences: Performance and impact factors. Ecological Informatics,Vol. 6, Issues 3–4, pp. 228–241.
Li, Z., Zhu, Q. & Gold, C. (2004). Digital Terrain Modeling Principles and Methology. CRC Press.
[47] Lu, G.Y. & Wong, D.W. (2008). An Adaptive Inverse-distance Weighting Spatial Interpolation Technique. Computers & Geosciences Journal, 34, Issue 9,1044-1055.
Mesnard, L.de. (2013). Pollution models and inverse distance weighting: Some critical remarks. Computers & Geosciences, Vol. 52, pp. 459–469.
Mitas L. & Mitasova H., (1999). Spatial Interpolation, Geographic Information Systems, Principles, techniques, management and applications, pp. 481-492, New York: Wiley.
OGC (Open GIS Consortium) (1999). The Open GIS Abstract Specification-Topic 7: The Earth Imagery Case, URL: http://www.opengis.org/public/abstract/99-107.pdf, (last date accessed:4 March 2002).
Picton, P. (2000). Neural Networks. Palgrave Macmillan press.
Saati, M., Amini, J. & Sadeghian, S. (2008). Generation of orthoimage from high resolution DEM and high resolution image, Scientia Iranica, Vol. 4, No. 4.
Sadeghian, S., Valadan Zoej, M.J., Delavar, M.R. & Abootalebi, A. (2001b). Precision rectification of high resolution satellite imagery without ephemeris data, International Journal of Applied Earth Observation and Geoinformation (JAG), 3(4), 366-371.
Sadeghian S., Valadan Zouj M.J. (2011). A comprehensive study of mapping potential for Ikonos Geo Image, SMPR 2011 International conference, Tehran, Iran
Valadan Zoej, M.J., Mokhtarzadeh, M., Mansourian, A., Ebadi, H. & Sadeghian, S. (2007). Rational function optimization using genetic algorithm. International Journal of Applied Earth Observation and Geoinformation, vol. 9, 403-413.
[32] Wagnera, P.D., Fienera, P., Wilkena, F., Kumarc., S. & Schneidera, K. (2012). Comparison and evaluation of spatial interpolation schemes for daily rainfall in data scarce regions. Journal of Hydrology,Vol., 464–465, pp. 388–400.