WETLAND ASSESSMENT USING UNMANNED AERIAL VEHICLE (UAV)
PHOTOGRAMMETRY
M. A. Boon a,*, R. Greenfielda, S. Tesfamichael b
a Department of Zoology University of Johannesburg, PO Box 524 Auckland Park, 2006, South Africa.- [email protected] b
Department of Geography, Environmental Management and Energy Studies University of Johannesburg Auckland Park, South Africa - [email protected]
KEY WORDS: Unmanned Arial Vehicle Photogrammetry, Remote sensing, 3D point clouds and surface models, Wetland delineation and classification, Wetland health assessment
ABSTRACT:
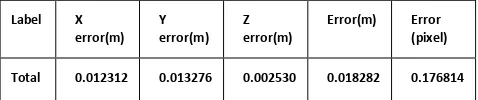
The use of Unmanned Arial Vehicle (UAV) photogrammetry is a valuable tool to enhance our understanding of wetlands. Accurate planning derived from this technological advancement allows for more effective management and conservation of wetland areas. This paper presents results of a study that aimed at investigating the use of UAV photogrammetry as a tool to enhance the assessment of wetland ecosystems. The UAV images were collected during a single flight within 2½ hours over a 100 ha area at the Kameelzynkraal farm, Gauteng Province, South Africa. An AKS Y-6 MKII multi-rotor UAV and a digital camera on a motion compensated gimbal mount were utilised for the survey. Twenty ground control points (GCPs) were surveyed using a Trimble GPS to achieve geometrical precision and georeferencing accuracy. Structure-from-Motion (SfM) computer vision techniques were used to derive ultra-high resolution point clouds, orthophotos and 3D models from the multi-view photos. The geometric accuracy of the data based on the 20 GCP’s were 0.018 m for the overall, 0.0025 m for the vertical root mean squared error (RMSE) and an over all root mean square reprojection error of 0.18 pixel. The UAV products were then edited and subsequently analysed, interpreted and key attributes extracted using a selection of tools/ software applications to enhance the wetland assessment. The results exceeded our expectations and provided a valuable and accurate enhancement to the wetland delineation, classification and health assessment which even with detailed field studies would have been difficult to achieve.
1. INTRODUCTION
The understanding of aquatic ecosystems such as wetlands requires that they be examined and understood from an equally wide range of perspectives for example their interface between terrestrial and aquatic environments (Ellery et al., 2009). Ecosystems such as wetlands are often complex because of the way people use wetlands and the different benefits that people receive from these ecosystems (Kotze et al., 2009). Remote sensing provides critical data to delineate, explain and predict changes in wetland ecosystems especially where a high spatial resolution is needed (Zweig et al., 2015). The advent of photogrammetry using UAV has proved a cost effective and efficient alternative to traditional remote sensing techniques (Shabazi et al., 2014). The technology has been applied successfully for mining (Peterman and Mesarič, 2012), ecological applications (Anderson and Gatson, 2013) and other constantly changing environments such as rivers (Rathinam et al., 2007, Ahmad et al., 2013, Flener et al., 2013, Ouédraogo et al., 2014). UAV photography can provide high spatial details needed by scientists (Li et al., 2010, Shahbazi et al., 2014) and is not constrained by orbital times or flight schedules (Zweig et al., 2015). Progress in computer vision and computing power has led to the advancement of UAV photogrammetry. This includes key advancements such as operational solutions for 3D data acquisition based on structure-from-motion photogrammetry, also called structure-from-motion-multi-view stereo (James and Robson 2012, Westoby et al., 2012, Fonstad et al., 2013). James and Robson (2012) studied the straight forward reconstruction of 3D surfaces and topography with a camera and achieved centimeter-level accuracy.
UAV photogrammetry can generate ultra-high-resolution digital elevation models (DEMs) which are amongst the most important spatial information tools to investigate geomorphology and hydrology (Ouédraogo et al., 2014). High- resolution orthophotos derived through low-altitude UAV photogrammetry can also generate information of physiological and ecological characteristics of plant communities such as texture and color (Li et al., 2010). Complex wetland vegetation information at a community scale can be identified (Li et al., 2010, Lechner et al., 2012), delineated and classified (Marcaccio et al., 2015, Zweig et al., 2015). However, wetlands present a different challenge to remote sensing application compared to other ecosystems that have received a great deal of attention in the remote sensing community. This paper presents results of a study aimed at investigating the use of UAV photogrammetry as a tool to enhance the assessment of wetland ecosystems.
1.1 Aim
The aim of this study was to acquire high resolution three dimensional (3D) models and orthophotos from UAV photogrammetry to enhance wetland delineation, classification and the WET-Health assessment of geomorphology, hydrology and vegetation. The second aim was to assess if the use of UAV photogrammetry is a rapid technique that can be used to enhance the wetland delineation (DWAF, 2008), classification (Kotze et al., 2005) and WET-Health assessment (Macfarlane et al., 2009).
* Corresponding author
This contribution has been peer-reviewed.
2. STUDY AREA
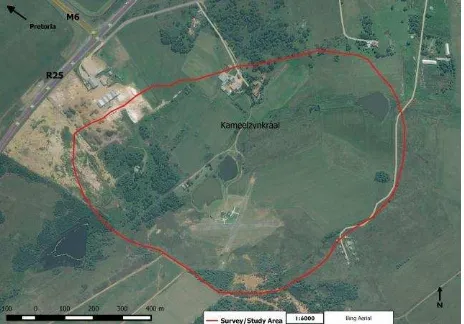
The study area is located on the Kameelzynkraal farm to the east of Pretoria in the Kungwini Local Municipal area, Gauteng Province, South Africa. The 100 ha wetland study area spans just over 1 km, starting just below an earthen dam on the south western boundary of the Cors-Air model aircraft airfield east of the R25 road just south of the M6 intersection up until to the dam wall of another earthen dam on a neighbouring farm in a north eastern direction (Fig. 1).
Figure 1. The Cors-Air study area to the east of Pretoria, Gauteng Province.
The Cors-Air study area can be described as a channelled valley-bottom wetland system. Large sections of the wetland were transformed due to infilling, agriculture, sand mining, excavation of trenches/drains, construction of roads, infrastructure and earthen dams. The system still represents typical characteristics of a wetland such as wetland soils and vegetation. The known water source of the wetland is surface runoff from the catchment stretching just over 2 km upstream, lateral surface inputs and fountains.
3. MATERIALS AND METHODS
The methodology can be divided into four phases: Phase 1 includes a baseline wetland study which includes wetland delineation, classification and WET-Health assessment. This phase also includes UAV flight planning which include calculation of study area, number of strips required, pixel size, photo scale, flying height and percentage of overlapping and preparation of the final flight plan.
Phase 2 includes the establishment of Ground Control Points (GCPs) and the setup of a Trimble positioning system and ground control base. This phase also includes the UAV image collection with a small multi-rotor UAV and digital camera on a motion compensated gimbal mount.
Phase 3 includes Structure-from-Motion (SfM) computer vision techniques to derive ultra-high resolution orthophotos and 3D models from multi-view aerial photography and generated point cloud.
Phase 4 includes analysis, interpretation and extraction of the necessary attributes from the UAV products to enhance the wetland delineation, classification and WET-Health assessment (UAV wetland assessment) and comparison with baseline
wetland assessment. Figure 2 presents the methodology in a structured flow diagram.
Figure 2. Flow diagram of methodology.
3.1 Preliminary study and planning
The baseline wetland study was completed using the delineation method documented by the Department of Water Affairs and Forestry in their document “Updated manual for identification and delineation of wetlands and riparian areas” (DWAF, 2008). Identification of the wetland was based on the terrain unit, soil form and wetness including vegetation as an indicator. The classification was completed using the classification system developed for the South African National Wetlands Inventory (SANBI, 2009), which is based on the principles of the hydro- geomorphic (HGM) approach to wetland classification, which encompass three key elements described by Kotze et al., (2005). The three key elements include geomorphic setting, water source and hydrodynamics.
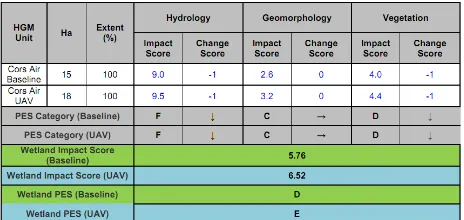
The methodology “WET-Health” was used to assess the health of the wetland unit, where health is a measure of the deviation of a wetland’s structure and function from its natural reference condition (Macfarlane et al., 2009). An HGM unit is analysed for changes in the three primary modules namely; hydrology (activities affecting water supply and timing as well as water distribution and retention within the wetland), geomorphology (presence of indicators of excessive sediment inputs and/or outputs), and vegetation (changes in vegetation composition and structure due to site transformation or disturbance). The magnitude of each impact in the HGM is calculated from both the extent and intensity of the activity. The impacts of all the activities in the HGM unit are combined to calculate the Present Ecological Status (PES) score for each module. This score provides an understanding of the current condition of the wetland. The intensity of the impact is measured on a scale of 0- 10, with a score of 0 representing no impact or deviation from natural, and a score of 10 representing complete transformation from natural (Macfarlane et al., 2009). A level two WET-Health assessment (detailed on-site evaluation), including a desktop study and a field assessment were performed to determine the wetland health of the study area.
the adjacent slopes in order to capture the landscape setting and impacts from the adjacent land uses. The UAV flight lines (number of strips) were calculated with DJI Ground Station software and the flight lines spaced between 60-70 m apart which equated to an 80% overlap to ensure accurate 3D model reconstruction. The flying height determined for the UAV survey was 120 m above ground level (AGL). A NIKON D3200 (28 mm) digital camera was used for the UAV survey to collect 20 megapixel resolution photographs. Camera focal length was set to “Infinity Focus” and the shutter speed to 1/800 s.
3.2 On site preparation and data acquisition
A Trimble (SPS985 GNSS GPS) site positioning system was setup on site and referenced with the two nearest national trigonometrical beacons. Ground control markers were then positioned across the site and at the boundaries of the UAV survey area/study area including next to the watercourse at different elevations (20 GCPs spaced over the 100 ha) to achieve geometrical precision and georeferencing accuracy.
An AKS Y-6 MKII multi-rotor UAV and the NIKON D3200 digital camera on a motion compensated gimbal mount were utilised for the collection of the images. The UAV was equipped with autopilot and navigation–grade GPS. The camera took a photograph every 1-2 s, triggered by the on- board flight controller. An on-board GPS was used to record the flight path which was synchronised with the camera before the flight. The flight was undertaken in autopilot mode through the use of the DJI Ground Station application with a live radio link which allowed real-time position information. Approximately 1200 photographs were captured to cover the study area. The photographs were then visually assessed on the basis of quality, viewing angle including overlap in order to remove any blurred and under or over-exposed images from further processing and analysis. The approximate coordinates were then assigned to the photographs based on the synchronised GPS flight path using GPicSync software. The georeferecing results were then exported into a Google Earth KMZ for quick inspection of the adequacy of the completed flight lines, image overlap and approximate coordinates before leaving the study area.
3.3 3D point cloud generation
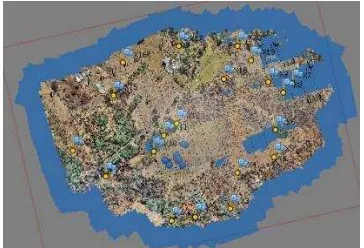
The completely automated computer vision SfM pipeline provided by Agisoft PhotoScan Professional Version 1.1 commercial software package was used. PhotoScan requires an input consisting of a set of images and then going automatically through the steps of feature identification, matching and bundle adjustment to reconstruct the camera positions (Fig. 3) and terrain features. The image matching was completed with the Photoscan accuracy set to high and generic pair selection. A sparse point cloud was created (Fig. 4) from 989 images through this initial bundle adjustment. This sparse point cloud included the position and orientation of each camera station and the XYZ/3D coordinates of all image features. The GCPs determined with the Trimble were then imported into Photoscan. The photos in this model were used to identify the 20 GCPs and recompute bundle adjustment to achieve geometrical precision and georeferencing accuracy.
Figure 3. Camera positions and image overlaps. The legend on the right represents the number of images in which a point
appears.
Figure 4. Sparse point cloud with an overlay of ground control points/markers.
A dense point cloud set to high quality was then built based on multi-view stereopsis (MVS) for the full study extent. Dense point clouds were further built in high reconstruction quality for a smaller spatial extent which covered the wetland area (42 ha/248 images) and low reconstruction quality for the full extent (100 ha/989 images). This was done to reduce the size of the data to facilitate easier visualisation and analyses of the 3D products. Noise filtering was undertaken within Photoscan to manually remove point spikes (especially over large surfaces with water) and irregular points (points located outside spatial limits). The edited dense point cloud dataset was then directly used for mesh generation in order to have a surface with all the terrain features (DEM). The dense point clouds were then imported into PhotoScan again to complete the automatic division of all the points into two classes - ground points and the rest. A dense point cloud with only ground and low points was obtained which was then exported as a digital terrain model (DTM) after mesh generation removing all aspects that are above ground such as the buildings and vegetation. The Height Field algorithmic method was applied for planar type surfaces for the mesh generation. This algorithm is best suited for aerial photography as it requires lower amount of memory and larger data sets can be processed. Interpolation was also enabled in order to assist cover some holes automatically. The results were exported in various formats including point clouds (ASPRS LAS), orthophotos (GeoTIFF, Google Earth KMZ), DEMs and DTMs (GeoTIFF elevation) from classified point clouds.
3.4 Analysis, data classification and interpretation
This step of the methodology includes editing, analysis, interpretation and extraction of necessary attributes from the UAV products. The wetland delineation, classification and
This contribution has been peer-reviewed.
WET-Health assessment was executed using the UAV derived products to determine the degree the UAV products can contribute towards wetland assessment. The results were then compared with the baseline wetland assessment. The UAV survey was only completed for the functional wetland area/study area and adjacent side slopes, therefore catchment indicators were excluded from the UAV wetland assessment.
The data quality and quantity was assessed for the images, orthophoto and 3D Model generation trough automatic image quality estimation feature and accuracy report generated by PhotoScan. The high resolution orthophotos (HROs) were analysed and interpreted using the QGIS 2.2.0 application and Global Mapper v17 (Blue Marble Geographics, 2015) for the GeoTIFF and Google Earth was used for the KMZ formats. The KMZ formats were exported in maximum resolution from Photoscan as Google Earth can import large files quickly. The GeoTIFF orthophotos was also overlayed as a texture in combination with the DEMs within Quick Terrain Modeller (QTM) 805 (Applied Imagery, 2015) software for visualisation and interpretation. QTM were chosen and used as the key with water) and irregular points (points located outside spatial limits) that were not removed by the initial editing undertaken with PhotoScan. This quick and precise editing ensured that accurate surface analysis such as slope, elevation profile and 3D analysis could be performed on these 3D models. QTM model statistics function, visualisation tools, 3D analysis mensuration tool, contour line function, profile analysis tool, cross section generation and analysis tool, AGL analyst tool, flood analysis tool, volume determination tool and the grid statistics calculation tool (statistical analysis) were used to complete the UAV wetland assessment.
4. RESULTS AND DISCUSSION
Fieldwork for the baseline wetland study was undertaken on the 16th and 23rd of May 2015. Ground control for the UAV survey greater than other SfM and UAV photogrammetry studies such as Hugenholtz et al. (2013), Dandois and Ellis (2013), Lucieer et al. (2014) and Ouédraogo et al. (2014). Hugenholtz et al. (2013) also compared UAV RMSE with airborne LiDAR RMSE datasets and reported better accuracy for the former.
The number of points for the smaller spatial extent point cloud (high reconstruction quality) resulted in 261 427 437 points and an average of 692.7/m2 point density. The number of points for
the low reconstruction full spatial extent point cloud resulted in 12 489 256 points and an average of 11.8/m2 point density.
A 0.018 m ground resolution orthophoto (including other lower resolution orthophotos) and a 0.038 m point cloud including surface model (DEM and a DTM after classification) were derived from the smaller spatial extent point cloud and aerial photographs respectively (high reconstruction quality). A 0.29 m point cloud and surface model (DEM and a DTM after
Table 1. Overall spatial accuracy (m) of the UAV derived data.
4.1 Wetland delineation and classification
Limited research has been undertaken using UAV photogrammetry derived data specifically for the delineation and classification of wetlands. The application of UAV photogrammetry in research on the natural environment only received attention in the last few decades (Shabazi, 2014). This research studied the broader characteristic attributes of a wetland to meet the requirements of the wetland delineation (DWAF, 2008) and classification (Kotze et al., 2005). Existing UAV photogrammetry literature such as Li et al. (2010), Thamm et al. (2013), Marcaccio et al. (2015) and Zweig et al. (2015) mostly focussed on wetland vegetation classification. The findings of this study are comparable to the results of these studies in terms of identification and mapping of dominant which captured micro-topography of Antarctic moss beds and derived surface water drainage model and Westoby et al. (2012) that captured complex topography and Gonçalves and Hernriques (2015) for topographic monitoring of coastal areas. Ahmad et al. (2013) achieved an accuracy of less than ±1 m for slope mapping and ±0.280 m for stream mapping. Ouédraogo et al. (2014) generated high resolution and accurate DEMs of agricultural watersheds. We applied similar approaches and methods for this study and accurately determined the terrain indicator and geomorphic setting of the wetland.
We investigated the use of UAV point clouds and surface models in combination with field studies to enhance the overall delineation. Through the high spatial resolution and vertical accuracy we achieved, it was possible to determine very fine scale features which is short in length and height such as the wetland vegetation patterns, small landscape profile changes including information from secondary products such as local watersheds/drainage and flood simulation which is not possible for example with a 1.0 m LiDAR derived DEM (with a vertical resolution of 0.15 m). Areas of saturation and wetland soil wetness can also not be determined directly using LiDAR products such as point clouds and surface models but by the determination of the topographic position in the landscape from these products which provide an indication where soils are likely to be saturated (Gillrich and Lichvar, 2014). The high spatial resolution UAV point clouds obtained in this research were also successfully used for these purposes. Figure 5 indicate a 0.29 m ground pixel resolution DTM of the study area and 2.5 m contours. Visual observation of the DTM showed valuable high resolution information of the landscape and the position of the wetland within the landscape.
Figure 5. A 0.29 m ground pixel resolution DTM of the study area with QTM height colouration and 2.5 m contours
A slope/profile analysis was calculated (Fig.6) using the 0.29 m DTM, resulting in a slope of 1.013° or 1.77% compared to a average of 2.4% determined using Google Earth (baseline study). The DTM slope analysis indicate an elevation above sea-level of 1546 to 1566 m which indicate a height difference of only 22.5 m in contrary to determination done in the baseline wetland study which indicate a difference of 29 m (1550 – 1579 m a.m.s.l).
Figure 6. The average slope (profile analysis) calculated for the study area with QTM is 1.013° or 1.77 % slope (Applied
Imagery, 2015)
Figure 7 shows the importance of the point cloud (small extent with 0.038 m scale). The figure also indicates the baseline delineation (red line). Limited auger samples were taken for the
baseline wetland assessment especially in the northern side of the wetland. The point cloud provided valuable information with regards to the low lying and flat areas including the position of the channel and areas where water accumulates. This section of the wetland was particularly problematic with regards to delineation due to the extensive transformation and associated degradation. The fence line visible in the point cloud is also the division between the intensity of the land use between the two sections.
Fence line
Figure 7. Point cloud (small extent 0.038 m) with height coloration and intensity enabled. The red line indicates the
baseline delineation.
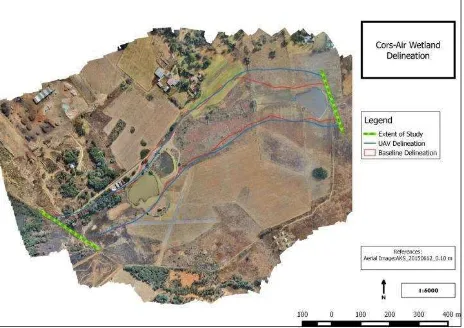
The wetland delineation was updated using the information that was derived from the UAV products. The Cors-Air study area was still classified as a channelled valley-bottom although the delineated area of the wetland increased with 3 ha through the accurate identification of the terrain, areas of saturation, water accumulation and the specific hydrodynamics of the wetland. The high resolution 3D visualisation of the entire wetland provided a bird’s eye view that one cannot achieve physically in the field. This view allows delineators to “see landscape scale patterns created by the locations of indicators relative to one another” (Gillrich and Lichvar, 2014) but these products can and may not replace field delineation and should be used as an enhancement. Figure 8 indicate the UAV derived wetland delineation and the baseline wetland delineation on the 10 cm orthophoto..
Figure 7. Wetland areas delineated. Baseline and UAV wetland delineation displayed on the 10 cm orthophoto.
4.2 WET-Health Assessment (ecological status)
This study used WET-Health (Macfarlane et al., 2009) which is a widely accepted wetland health assessment tool in South
This contribution has been peer-reviewed.
Africa for the application of the UAV products. The powerful and accurate visual analysis of the 3D point clouds and surface models using QTM were applied to enhance the wetland delineation and classification (previous section) but also the WET-Health assessment (this section). This visual analysis was completed in combination with the visual analysis of the HROs. Gillrich and Lichvar (2014) confirmed tools found in LiDAR software such as QTM can be used for the direct measurement of the height and depth of features such as the channel bank and bed using point clouds or surface models. The accurate 3D measurement including volume determination from UAV data was successfully done in a study by Stöcker et al. (2015) who enhanced the accuracy by adding close range photogrammetry due to the difficulty to reconstruct very steep gullies which were not present in our study area. The high spatial resolution and vertical accuracy we achieved made it possible to complete accurate measurements from the UAV point clouds and surface models using QTM. These measurements were confirmed through field verification. Even narrow features such as small gullies and drains including possible obstructions which are normally not accurately presented in LiDAR data (Gillrich and Lichvar, 2014) were represented accurately using the UAV derived point clouds and surface models. A limitation of UAV SfM photogrammetry though is that it is unable to reconstruct surfaces located underneath trees while LiDAR is capable of achieving this (James et al., 2007). The visual analysis of HROs, point clouds and DTMs provided the opportunity to clearly visualise the extent to which dams and roads interrupt flows (Fig. 8). Through the 3D visualisation one could for example determine the position of the dams within the wetland, the degree of seepage trough the dam walls, the obstruction they cause and the position and extent of other associated features such as overflow canals.
Figure 8. The DEM (0.038 m) with a visual overview of the UAV delineation and the location of some of the dams and
roads and the interruption these features may cause.
The determination of surface roughness from the UAV point cloud agreed with the work by Zlinszky et al. (2012) who used LiDAR point cloud intensity and height information to classify wetland vegetation (reeds) in different classes and determined the health of the wetland vegetation. The research reported in this study used the QTM statistical analysis tool (grid statistics) to calculate the intensity (minimum and deviation) and above ground level (AGL) analysis to further assist with the determination of intact wetland vegetation and associated roughness to enhance the WET-Health assessment further. The remaining intact hydrophilic vegetation sections were delineated in the DEM (0.038 m). This delineation was then further visualised for verification by including the 10 cm
orthophoto as a texture over the DEM. The delineation was then transferred to the point cloud. The QTM AGL analyst tool was used to auto calculate the ground estimate from the point clouds. The point clouds now displayed the above ground level (AGL) height to determine height of wetland vegetation as indicated in Figure 9.
Figure 9. Above ground level (AGL) analysis of the surface roughness using the QTM AGL analyst tool.
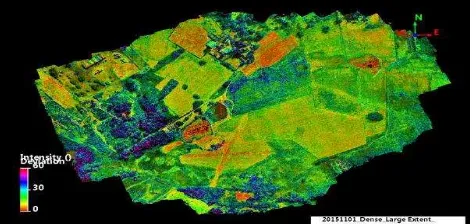
We also found strong correlations from the point cloud intensity maps created with QTM to assist with the assessment of extents of anthropogenic impacts such as infilling, deposition and vegetation disturbance classes within the wetland. This was also confirmed by Gillrich and Lichvar (2014) that point clouds and surface model (LiDAR) data are useful for decision making to point out areas where anthropogenic disturbances took place. Areas with a low deviation score 0-10 (orange to yellow/green colour) included areas which were and is currently still subjected to anthropogenic disturbance (Fig. 10). The two earthen dams with orange colour should be ignored due to reconstruction errors of these two features. It is important to note that the other end of the deviation intensity scores include the blue colour which indicates intact wetland areas and alien tree stands such as black wattle which is also a disturbance class (although these sections include more purple and pink) therefore the need to visualise these calculations in conjunction with the HROs for confirmation.
Figure 10. QTM intensity deviation point cloud.
Table 2. Summary of present wetland health based on the Wet- Health assessment (baseline and UAV)
5. CONCLUSION
This is the first study to assess UAV photogrammetry as a tool for wetland delineation and health assessment in South Africa. The results suggest that UAV photogrammetry can significantly enhance wetland delineation and classification but also be a valuable contribution to WET-Health assessment. The UAV products which are inexpensive can be acquired relatively easily and in a short period of time with the recent technological advancements. An important breakthrough with this research was that the UAV products have been taken a step further by visualising the data in detail and analysing them with various tools, thereby extracting valuable information for decision making. The UAV products provided a valuable enhancement to the wetland delineation and classification which would have been difficult to achieve using field studies. UAV photogrammetry was successfully applied to determine the landscape setting (terrain and geomorphic), obtain precise slope profiles, assisted with the identification of areas of saturation and water accumulation, mapping of hydrophilic vegetation including surface water sources and surface hydrodynamic analysis. UAV photogrammetry further enhanced the WET- Health assessment allowing wetland practitioners to better understand the degradation of the study area where all the wetland indictors were not that apparent by providing accurate data that can assist with decision making.
Detailed wetland analysis involves substantial knowledge and experience and remotely-sensed data is normally also the starting point for a wetland assessment, although availability of high resolution imagery, surface models or even point clouds is limited in South Africa. The precision and quality of the UAV products is unparalleled, compared to more conventional remote sensing tools such as satellite imagery that has been used widely for assessment of wetland ecosystems. UAV photogrammetry may provide some of the much needed answers for hydrological and geomorphological questions and to detect even small changes trough repetitive surveys and thereby be a tool used to do precision monitoring and planning of wetland rehabilitation interventions. Regulatory obstacles can be a limitation although the Civil Aviation Authority (CAA) regulated the use of Remotely Piloted Aircraft System (RPAS) in South Africa on the 1st of June 2015. In order to undertake any aerial work with a UAV one needs to be at least in the possession of a Remotely Pilot License (RPL) and a RPAS operator certificate.
ACKNOWLEDGEMENTS
We would like to thank Aerial Kopter Solutions (AKS) and the RPAS Training Academy (PTY) Ltd who provided the equipment, resources and expertise to complete the surveying
for this project including for partially funding the conference attendance. University of Johannesburg (UJ) Department of Geography, Environmental Management and Energy Studies for the use of their computer to process this large dataset and partially funding the conference attendance and the UJ Zoology Department that made it possible to undertake this research.
REFERENCES
Applied Imagery, 2015. Quick Terrain Modeller 8.0.5. Silver Spring, MD: Johns Hopkins Applied Physics Laboratory.
Ahmad, A., Tahar, K., Udin, W., Hashim, K., Darwin, N., Room, M., Hamid, N., Azhar, N., Azmi, S., 2013. Digital Aerial Imagery of Unmanned Aerial Vehicle for Various Applications. 2013 IEEE International Conference on Control System, Computing and Engineering Penang Malaysia, pp. 535-540.
Anderson, K.., and Gaston, K.J., 2013. Lightweight unmanned aerial vehicles will revolutionize spatial ecology. Frontiers in Ecology and the Environment 11(3),pp. 138–146.
Blue Marble Geographics, 2015. Global Mapper v17. 77 Water Street, Hallowell, Maine 04347 USA
Department of Water Affairs., 2008. Updated Manual for the Identification and Delineation of Wetlands and Riparian areas. Department of Water Affairs and Forestry, Pretoria.
Dandois, J.P., and Ellis, E.C., 2013. High spatial resolution three-dimensional mapping of vegetation spectral dynamics using computer vision. Remote Sensing of Environment 136 (2013), pp. 259-276.
Ellery, W., Grenfell, M., Grenfell, S., Kotze, D., McCarrthy, T., Tooth, S., Grundling, P., Beckedahl, H., Le Maitre, D., and Ramsay, L., 2009 Wet-Origins: Controls on the distribution and dynamics of wetlands in South Africa. Water Research Commission, Pretoria. WRC Report No TT 334/09
Flener, C., Vaaja, M., Jaakkola, A., Krooks, A., Kaatinen, H., KukKo, A., Kasvi, E., Hyyppa, H., Hyyppa, J., and Alho, P., 2013. Seamless Mapping of River Channels at High Resolution Using Mobile LiDAR and UAV-Photography. Remote Sens.2013 (5), pp.:6382-6407.
Fonstad, M., Dietrich, J., Coourville, B., Jensen, J., and Carbonneau, P,. 2013. Topographic structure from motion: a new development in photogrammetric measurement. Earth Surface Processes and Landforms, 38, pp. 421-430
Gillrich, J., and Lichvar, R., 2014. Use of LiDAR to Assist in Delineating Waters of the United States, Including Wetlands. US Army Corps of Engineers Cold Regions Research and Engineering Laboratory. ERDC/CRREL TR-14-3
Gonçalves, J.A., and Hernriques, R., 2015. UAV photogrammetry for topographic monitoring of coastal areas. ISPRS Journal of Photogrammetry and Remote Sensing, 104 (2015) pp. 101-111.
Hugenholtz, C.H., Whitehead, K., Brown, O.W., Barchyn, T.E., Moorman, B.J., LeCliar, A., Riddell, K., and Hamilton, T., 2013. Geomorphological mapping with a small unmanned aircraft system (sUAS): Feature detection and accuracy
This contribution has been peer-reviewed.
assessment of a photogram metrically-derived terrain model. Geomorphology 194 (2013), pp. 16-24.
James. L., Watson, D., and Hansen, W., 2007. Using LiDAR data to map gullies and headwater streams under forest canopy: South Carolina, USA. Catena, 71, pp.132-144.
James, R., and Robson, S., 2012. Straight forward reconstruction of 3D surfaces and topography with a camera: accuracy and geoscience application. Journal of Geophysical Research, 117.
Kotze, D.C., Marneweck, G.C., Batchelor, A.L., Lindley, D.S., and Collins, N.B., 2005. Wetland –Assess. A rapid assessment procedure for describing wetland benefits. First Draft. Mondi Wetlands Project.
Lechner. A., Fletcher. A., Johansen, K., and Erskine, P., 2012. Characterising Upland Swamps Using Object-Based Classification Methods and Hyper-Spatial Resolution Imagery Derived from An Unmanned Aerial Vehicle. ISPRS Annals of the Photogrammetry, Remote Sensing and Spatial Information Sciences, Melbourne, Australia Vol. 1-4, pp. 101-106.
Li, N., Zhou, D., Duan, Z., Wang, S., and Cui, Y., 2010 Application of unmanned airship image system and processing techniques for identifying of fresh water wetlands at a community scale. In: Proceedings of IEEE 18th Geoinformatics International Conference. Beijing:IEEE.
Lucieer, A., Turner, D., King, D., and Robinson, S., 2013. Using an Unmanned Aerial Vehicle (UAV) to capture micro- topography of Antarctic moss beds. International Journal of Applied Earth Observation and Geoinformation, 27, pp. 53-62.
Macfarlane., D.M., Kotze, D.C., Ellery, W.N., Walters, D., Koopman, V., Goodman, P., and Goge, C., 2009. WET-Health: A technique for rapidly assessing wetland health. Water Research Commission, Pretoria. WRC Report No TT 340/09
Marcaccio, J., Markle, C., and Chow-Fraser, P., 2015. Unmanned aerial vehicles produces high-resolution, seasonally- relevant imagery for classifying wetland vegetation. International Archives of the Photogrammetry, Remote Sensing and Spatial Information Sciences, Toronto, Canada, Vol. XL- 1/W4, pp. 249-256
Ouédraogo, M., Degré, A., Debouche, C., and Lisein, J., 2014. The evaluation of unmanned aerial system-based photogrammetry and terrestrial laser scanning to generate DEMs of agricultural watersheds. Geomorphology 214, pp. 229-355
Peterman, V., and Mesarič, M., 2012. Land Survey from Unmanned Aerial Vehicle. International Archives of the Photogrammetry, Remote Sensing and Spatial Information Sciences, Melbourne, Australia, Vol. XXXIX-B1, , pp. 447- 451.
Rathinam, S., Almeida, S., Kim, Z., Jackson, S., Tinka, A., Grossman, W., and Sengupta, R., 2007. “Autonomous Searching and Tracking of a River Using an UAV.” In: Proceedings of American Control Conference, New York: IEEE, pp. 359–364.
SANBI, 2009. Further Development of a Proposed National Wetland Classification System for South Africa. Primary
Project Report. Prepared by the Freshwater Consulting Group (FCG) for the South African National Biodiversity Institute (SANBI).
Shahbazi, M., Théau, J., and Ménard, P., 2014. Recent applications of unmanned aerial imagery in natural resource management. GIScience & Remote Sensing, 2014, pp. 1-27
Stöcker, C., Eltner, A., and Karrasch, P., 2015. Measuring gullies by synergetic application of UAV and close range photogrammetry – A case study from Andalusia, Spain. Catena 132 (2015), pp.1-11
Thamm, H.P., Menz, G., Becker, M., Kuria, D.N., Misana, S., and Kohn, D., 2013. The Use of UAS for Assessing Agricultural Systems in an Wetland in Tanzania in the Dry- and Wet-season for Sustainable Agriculture and Providing Ground Truth for TERRA-SAR X Data. Archives of the Photogrammetry, Remote Sensing and Spatial Information Sciences, Rockstock, Germany Vol. XL-1/W2, 2013 UAV- g2013, pp. 401-406.
Westoby, M., Brasingon, J., Glasser, N., Hambrey, M., and Reynolds, J., 2012.’Structure from-Motion’ photogrammetry: a low-cost, effective tool for geoscience applications. Geomorphology, 179, pp. 300-314.
Zlinszky, A., Mücke, W., Lehner, H., Briese, C., and Pfeifer, N., 2012. Categorizing Wetland Vegetation by Airborne Laser Scanning on Lake Balaton and Kis-Balaton, Hungary. Remote Sens, 4, pp. 1617- 1650.