EFFECT OF THE X5.4 CLASS SOLAR FLARE EVENT OF SOLAR CYCLE 24 ON THE
GPS SIGNAL RECEPTION IN PENINSULAR MALAYSIA
Sholehah Ismaila, *,T. A.Musab, W. A. W. Arisb, G. Gopirc,
aMalaysia Space Agency (ANGKASA), Ministry of Science, Technology and Innovation, 42700 Banting, Selangor,
Malaysia – [email protected]
bDepartment of Geoinformation, Faculty of Geoinformation and Real Estate, Universiti Teknologi Malaysia, 81310
UTM, Johor – [email protected] & [email protected]
c
Department of Applied Physics, Faculty of Science and Technology, 43600 UKM Bangi, Selangor - [email protected]
KEY WORDS: Solar Flare, GPS, MyRTKnet, Total Electron Content, Ionospheric Delay.
ABSTRACT:
In this paper, we examine the effect of solar flare event on the Global Positioning System (GPS) signal reception in Peninsular Malaysia during the X5.4 class solar flare on 7th March 2012, 00:24 UT at active region AR1429. GPS data from six MyRTKnet stations that cover the northern, southern, western and eastern regions of Peninsular Malaysia were used, namely Langkawi (Kedah), Bandar Baharu (Pulau Pinang), Pekan (Pahang), Mersing (Johor), Tanjung Pengelih (Johor) and Malacca (Malacca). The total electron content (TEC) was estimated based on the single layer ionospheric model. Next, the ionospheric delay for each GPS frequency of L1 (1575.42 MHz), L2 (1227.60 MHz) and L5 (1176.45 MHz) was then calculated. The results show that solar flare event can influence the GPS signal reception in Peninsular Malaysia where the X5.4 class solar flare shows significant effect of the ionospheric delay within the range of 9 m – 20 m. These research findings will significantly contribute to space weather study and its effects on space-based positioning system such as the GPS.
* Corresponding author
1. INTRODUCTION
1.1 Solar cycle 24
Solar cycle 24 started in 2009 and is expected to complete its 11 years cycle in 2019. After a long silent from any activities since 2007, first solar flare class M2.3 was occurred on 19 January 2010 which was followed by a geomagnetic storm on April 2010 and has been active throughout the year of 2011 until 2015. High energy electrons released from Sun during solar flare event can disrupt the GPS signal by reducing the strength and accuracy of the signal(Yeu et al., 2013). The solar flare on December 2006 occurred during solar minimum for cycle 23 was strong enough to disrupt the GPS signal for more than 10 minutes (Afraimovich et al., 2008; Graham, 2011; Kunches, 2007; Oberst, 2006; Yasukevich et al., 2008). According to Afraimovich et al. (2008), Carrano et al. (2009), Gary (2011), Langley (2007) and Yasukevich et al. (2008), high-level phase slips and count emission were detected on the GPS data. They also reported that the carrier-noise ratio (C/No) has dropped to 25 dB and the vertical and horizontal peak positioning error increased to as high as 20 m to 60 m.
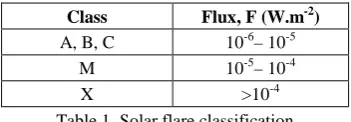
A solar flare is a big sudden explosion phenomena that happen on the Sun surface for a short time of period (a few minutes to a few hours) and released high energy electron particles (Carrano et al., 2009; Garcia et al., 2007; Intan Izafina Idris, 2013).The flare can be classified into 5 classes: A, B, C, M and X, according to the flux measured by Geostationary Operational Enviromental Satellite (GOES) satellite and each class has 10 categories starting from 0 to 9. The wavelength range of x-ray
flux is between 0.05 nm to 0.8 nm and can be divided into 2 which are long x-ray (0.1 nm – 0.8 nm) and short x-ray (0.05 nm - 0.4 nm) (NOAA, 2007). Table 1 shows the list of solar flare class according to their energy range (Intan Izafina, 2013; Akmaev, 2008; Hanslmeier, 2007).
Class Flux, F (W.m-2) A, B, C 10-6– 10-5
M 10-5– 10-4
X >10-4
Table 1. Solar flare classification
Meanwhile, Figure 1 shows the distribution of the solar flare events for solar cycle 24 from 2008 until July 2015.Throughout that period, 2012 recorded the most solar flare event with 137 occurrences. There were no solar flare activities recorded in year of 2009 which was the year of the “Quiet Sun” or in non-active states.
Solar flare can disrupt the GPS and other navigational systems by reducing the signal accuracy. In this paper, we examine the effect of solar flare event for solar cycle 24 on the GPS signal reception in Peninsular Malaysia.
1.2 X5.4 Class Solar Flare
The X5.4 class solar flare on 7th March 2012, 00:24 UT has occurred on the active sunspot region AR1429 (Figure 2). This flare was the second biggest event for the cycle 24 which occurred along with the coronal mass ejection (CME) and disbursed a G3 scale of geomagnetic storm (NOAA, 2007; SolarHam, 2014; WDC, 2007).
Figure 2. Image of solar flare X5.4 occurred at active region AR1429 on 7th March 2012 at 00:24 UT.© Solar flare Image
Copyright 2011, NASA.
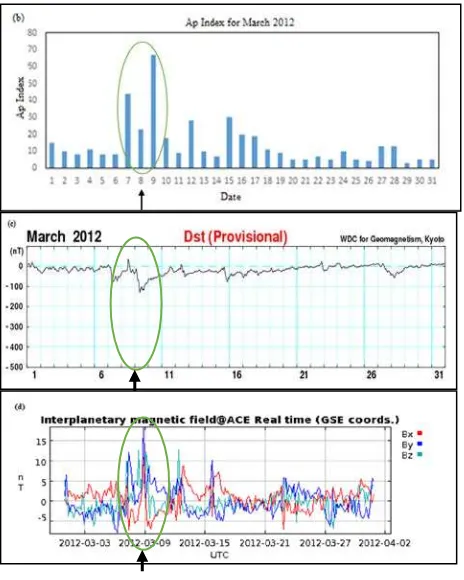
Figure 3 shows the Kp index, Ap index, Dst index and interplanetary magnetic field (IMF) index on March 2012 during solar flare X5.4. According to Figure 3(a), an apparent geomagnetic activity happened during the event where the Kp index varies between 1 to 8. The highest Kp = 8 was recorded on 9 March 2012 at 06:00UT, 2 days after the event appearance. The reason of this activity is because it takes around 1 to 2 days or less for the charge particles and electrons that released from the Sun to reach the Earth, depending on the solar flare strength. In addition, Figure 3(b) shows the highest Ap index was recorded on 9th March 2012 with 67 nT, while on 7th March
2012 the index value only 44 nT. The moderate geomagnetic storm occurred on that day with the maximum absolute Dst value 131 nT (-131 nT) (Figure 3 (c)) and the IMF graph shows the Bz magnetic field component move towards negative value of -4 nT (Figure 3 (d)).
Figure 3. Geomagnetic index for March 2012. (a) Kp index. © SPIDR Image Copyright 2010, (b) Ap index. © SPIDR Image Copyright 2010, (c) Dst index. © WDC Image Copyright 2007 and (d) IMF index. © SPIDR Image Copyright 2010. The graphs show the same pattern or changes when the geomagnetic storm was detected occurred on 9th March 2012, 2 days after the
appearance of X5.4 flare until 10th March 2012.
2. METHODOLOGY
This study was carried out using Malaysian Real-time Kinematic Network (MyRTKnet) dual-frequencies GPS (f1 = 1575.42 MHz and f2 = 1227.60 MHz). The MyRTKnet is a GPS network established by Department of Survey and Mapping Malaysia (DSMM) to support the maintenance of the nation’s geodetic reference system as well as other space-based positioning applications. In this study, six (6) MyRTKnet stations in Peninsular Malaysia have been used which covers northern, southern, eastern and western region (Figure 4). Meanwhile, details of each station were listed in Table 2.
Location Location Code
Latitude Longitude
Langkawi, Kedah
LGKW 6°19'42.60"N 99°51'4.68"E
Bandar Baharu, Pulau Pinang
BABH 5°8'48.12"N 100°29'37.32"E
Pekan, Pahang
PEKN 3°29'33.36"N 103°23'22.90"E
Mersing, Johor
MERS 2°27'12.60"N 103°49'43.68"E
Pengerang, Johor
TGPG 1°22'2.64"N 104° 6'29.88"E
Bandar Melaka, Melaka
JUML 2°12'42.48"N 102°15'21.96"E
Table 2. MyRTKnet GPS receiver stations coordinate and code
The GPS data from each station was utilized for nine (9) consecutive days – three (3) days before the flare event, during the flare event and five (5) days after the flare event. Next, the total electron content (TEC) was estimated based on the single layer ionosphere model (SLIM) with zenith angle around 15° - 20° to avoid multipath error on the GPS signal. The TEC calculation has been done by using two different software packages which are GPS_TEC software (Seemala, 2014) and Bernese software version 5.0 for comparison purposes.
3. RESULTS AND DISCUSSION
3.1 Total Electron Content (TEC)
The calculated TEC value for all MyRTKnet stations using the GPS_TEC and the Bernese were plotted in Figure 5 and Figure 6, respectively. Results from both figures indicate significant variation of TEC value during the X5.4 class solar flare event. The TEC value recorded an increment between 24% - 50% during the event compared to the calm day, i.e., a day without any sun activities. The results also indicate that MyRTKnet stations at the southern Peninsular Malaysia experienced the highest TEC value. In addition, results from the Bernese software consistently give higher value of TEC compared than GPS_TEC.
Figure 5. The variation of TEC (in TECU) changes during flare X5.4 for all selected MyRTKnet stations from 3rd – 12th March
2012 using GPS_TEC.
Figure 6. The variation of TEC (in TECU) changes during flare X5.4 for all selected MyRTKnet stations from 3rd – 12th March
2012 using Bernese.
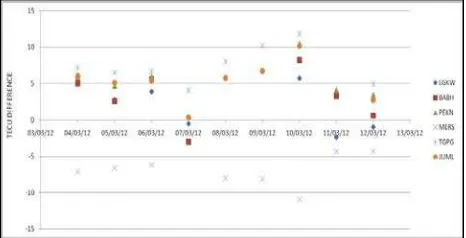
Figure 7 shows difference of the TEC value between GPS_TEC and Bernese. This difference could be related to the receiver code bias correction problem within the GPS-TEC software. Incorrect calculation of the receiver biases will produce an error on the TEC output. In addition, the GPS_TEC software unable to calculate TEC value for certain stations. For example, there were no TEC values on 7 March 2012 for MERS station, 8 and 9 March 2012 for LGKW and BABH stations and 11 March 2012 for TGPG and JUML stations (see Figure 5). Accordingly, only the Bernese results were considered in the next analysis on the effect of ionospheric delay to GPS signals.
Figure 7. TEC value difference between GPS_TEC and Bernese software.
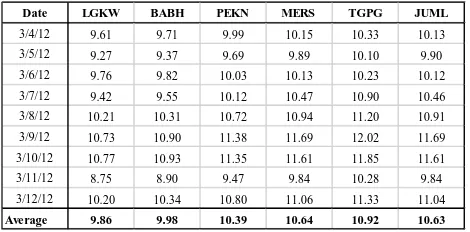
3.2 Ionospheric Delay, Iz
Ionospheric delay, Iz, was calculated by using the TEC value to
measure the error on the GPS signal for disruption detection caused by the solar flare event. The Iz was measured in meter
for all GPS frequencies L1, L2 and L5. During the event, the Iz
Date LGKW BABH PEKN MERS TGPG JUML
3/4/12 9.61 9.71 9.99 10.15 10.33 10.13
3/5/12 9.27 9.37 9.69 9.89 10.10 9.90
3/6/12 9.76 9.82 10.03 10.13 10.23 10.12
3/7/12 9.42 9.55 10.12 10.47 10.90 10.46
3/8/12 10.21 10.31 10.72 10.94 11.20 10.91
3/9/12 10.73 10.90 11.38 11.69 12.02 11.69
3/10/12 10.77 10.93 11.35 11.61 11.85 11.61
3/11/12 8.75 8.90 9.47 9.84 10.28 9.84
3/12/12 10.20 10.34 10.80 11.06 11.33 11.04
Average 9.86 9.98 10.39 10.64 10.92 10.63
Table 3. Ionospheric delay for all MyRTKnet stations at frequency, L1= 1575.42 MHz.
Table 4 is shown the Iz on L2 frequency (1227.60 MHz) for all
stations. From the table, the average of the Iz is between 16.24
m – 17.98 m. Meanwhile, the average value for L5 frequency (1176.45 MHz) is between 17.68 m – 19.57 m (Table 5).
Date LGKW BABH PEKN MERS TGPG JUML
3/4/12 15.83 15.99 16.45 16.71 17.01 16.69
3/5/12 15.27 15.43 15.96 16.29 16.63 16.31
3/6/12 16.07 16.18 16.53 16.69 16.85 16.66
3/7/12 15.51 15.72 16.66 17.25 17.94 17.22
3/8/12 16.82 16.98 17.65 18.02 18.45 17.97
3/9/12 17.68 17.94 18.75 19.25 19.79 19.25
3/10/12 17.73 18.00 18.69 19.12 19.52 19.12
3/11/12 14.41 14.65 15.59 16.21 16.93 16.21
3/12/12 16.79 17.03 17.78 18.21 18.67 18.18
Average 16.24 16.44 17.12 17.53 17.98 17.51
Table 4. Ionospheric delay for all MyRTKnet stations at frequency, L2= 1227.60 MHz.
Date LGKW BABH PEKN MERS TGPG JUML
3/4/12 17.24 17.41 17.91 18.20 18.52 18.17
3/5/12 16.63 16.80 17.38 17.73 18.11 17.76
3/6/12 17.50 17.62 17.99 18.17 18.34 18.14
3/7/12 16.89 17.12 18.14 18.78 19.54 18.75
3/8/12 18.32 18.49 19.22 19.63 20.09 19.57
3/9/12 19.25 19.54 20.41 20.96 21.55 20.96
3/10/12 19.31 19.60 20.35 20.82 21.26 20.82
3/11/12 15.69 15.96 16.98 17.65 18.43 17.65
3/12/12 18.29 18.55 19.36 19.83 20.32 19.80
Average 17.68 17.90 18.64 19.09 19.57 19.07
Table 5. Ionospheric delay for all MyRTKnet stations at frequency, L5= 1176.45 MHz.
According to the results in Tables 3-5, the ionospheric delay during the X5.4 flare have exceeded more than 15 m delay especially for L2 and L5. We can conclude that GPS signal during the X5.4 on 7 March 2012 flare has been disturbed especially on the low frequency radio wave. The reason is because the charge particles from solar flare have affected the ionospheric layer density especially in equatorial region like Malaysia.
4. CONCLUSION
From the result of this study, we can conclude that during the solar flare X5.4 class on 7th March 2012, the GPS signals as recorded by the MyRTKnet stations in Peninsular Malaysia have been affected due to a significant changes on TEC
variation around 53 - 74 TECU. The effect was different between each station depending on the locations, i.e., MyRTKnet stations at southern area were more affected compared to other station.
The ionospheric delay due to this flare event had reached up to 10m for the GPS L1 frequency and more than 15m for the GPS L2 and L5 frequencies. These delays will reduce the GPS accuracy and affected the users especially in the critical applications. Even though the X5.4 flare was not the biggest flare on solar cycle 24, but, it can also disturbed the GPS signals due to the geomagnetic storm scale G3 which was produced by this event when it reached the Earth.
ACKNOWLEDGEMENTS
Special thanks to Department of Survey and Mapping Malaysia (DSMM) for providing MyRTKnet data in this study.
REFERENCES
Afraimovich, E.L., Demyanov, V.V., Gary, D.E., Ishin, A.B. & Smolkov, G.Ya. 2008. Failure of GPS functioning caused by extreme solar radio events.
solar.njit.edu/preprint/afraimovich1361.pdf. (28th August 2015).
Akmaev, R. 2008. Global D-region Absorption Prediction Documentation. NOAA / Space Weather Prediction Center. http://www.swpc.noaa.gov/drap/dregion_absorption_documenta tion.html. (14th August 2011).
Carrano, C.S, Bridwood, C.T. & Groves K.M. 2009. Impacts of the December 2006 solar radio bursts on the performance of GPS. In: Radio Science. Vol. 44. pp. 1-12.
Garciá-Rigo, A., Hernández-Pajares, M., Juan, J.M. & Sanz, J. 2007. Solar flare detection system based on global positioning system data: First results. In: Advances in Space Research. Vol. 39, pp. 889 – 895.
El-Rabbany, A. 2006. Introduction to GPS: The Global Positioning System. Second Edition. London: Artech House, Inc.
Graham, A. 2011. Recent solar flares may disrupt your GPS. CNN.edition.cnn.com/2011/TECH/mobile/08/05/solar.flare.gps (28th August 2015).
Hanslmeier, A. 2007. The Sun and Space Weather. Netherlands: Springer.
Intan Izafina, I., 2013. Variasi jumlah kandungan elektron terhadap kejadian gangguan ionosfera bergerak berskala besar di kawasan khatulistiwa latitud tinggi dan kawasan khatulistiwa. Tesis Sarjana, Fakulti Kejuruteraan dan Alam Bina, Universiti Kebangsaan Malaysia.
Kunches, J. 2007. GNSS and space weather making the least out of solar max. In: Inside GNSS, pp. 30-36.
Mahamarowi Omar. 2015. Matahari Bintang Istimewa. Kuala Lumpur: Dewan Bahasa dan Pustaka.
1996-2003. In: Prosiding 32nd International Cosmic Ray Conference, pp. 135-138.
Misra, P. & Enge, P. 2006. Global Positioning System: Signal, Measurements and Performance. Second Edition. United Stated of America: Ganga-Jamuna Press.
NASA. 2011. Solar Flare Image. http://www.nasa.gov. (23rd December 2015).
NOAA. 2007. Space Weather Prediction Center. http://www.swpc.noaa.gov. (18th August 2015).
Oberst, T. 2006. Cornel University: Solar flares could seriously
disrupt GPS receivers. EurekAlert.
http://www.eurekalert.org/pub_releases/2006-09/cuns-sfc092606.php (28th August 2015).
Seemala, G. 2014. Rinex GPS-TEC program. Indian Institute of Geomagnetism (IIG), Navi Mumbai, India http://seemala.blogspot.com (28th August 2015).
SolarHam by Amateur Radio Station VE3EN. www.solarham.net. (8th Oktober 2014).
SPIDR. 2010. Space Physics Interactive Data Resource. http://spidr.ngdc.noaa.hov/spidr. (15th October 2015).
WDC (World Data Center), Geomagnetic Index. 2007. http://swdcwww.kugi.kyoto-u.ac.jp/ (18th September 2015).
Yasukevich Yu, V. Afraimovich, E.L., Ishin, A.B. & Smolkov, G.Ya. 2008. Powerful solar radio bursts as a potential threat to GPS functioning.
http://www.ursi.org/proceedings/procGA08/papers/GP206pl.pd f. (28th August 2015).