INTEGRATION OF IMAGES AND LIDAR POINT CLOUDS FOR BUILDING FAÇADE
TEXTURING
L. C. Chena, *, L. L. Chanb and W. C. Chang c
a
Center for Space and Remote Sensing Research, National Central University, Taiwan - [email protected] b Dept. of Civil Engineering, National Central University, Taiwan - [email protected]
c
Dept. of Civil Engineering, National Central University, Taiwan - [email protected]
Commission II, WG II/6
KEY WORDS: Façade Texture, GLCM, Image, Lidar, Occlusion, Photorealistic Building Model
ABSTRACT:
This paper proposes a model-based method for texture mapping using close-range images and Lidar point clouds. Lidar point clouds are used to aid occlusion detection. For occluded areas, we compensate the occlusion by different view-angle images. Considering the authenticity of façade with repeated patterns under different illumination conditions, a selection of optimum pattern is suggested. In the selection, both geometric shape and texture are analyzed. The grey level co-occurrence matrix analysis is applied for the selection of the optimal façades texture to generate of photorealistic building models. Experimental results show that the proposed method provides high fidelity textures in the generation of photorealistic building models. It is demonstrated that the proposed method is also practical in the selection of the optimal texture.
* Corresponding author
1. INTRODUCTION
Regarding façade textures, building models can be divided into three categories: block, generic, and photorealistic models. Block models provide the geometric shape of buildings without façade texture. The difference between the generic model and photorealistic model is that the textures are acquired from a material gallery (Parish and Müller, 2001; Müller et al., 2006) and the real images, respectively. The photorealistic models are conducive to virtual reality because of their realistic and immersive appearances. Thus, texture mapping for building façades has become an important work for the generation of photorealistic building models.
Building textures may be derived from close-range images (Laycock and Day, 2006; Tsai and Lin, 2007) or aerial images (Frueh et al., 2004; Wu et al., 2007). Compared to aerial images, close-range images provide a wealth of façade information with high spatial resolution for texture mapping. However, the façade may be occluded by other objects, such as trees, cars, and so on, in image acquisition. Those occluded parts would cause the façade images unreal. In this reason, it’s a major process to detect and compensate occlusion parts. Lidar point clouds with accurate 3D information provide a good way for occlusion detection. For occluded areas, one may compensate the occlusion by different view-angle images.
The façades of a building are usually with regularly distributed structure, window, terrace and sill for instance. Those repetitive structures form regular patterns in images. However, the repetitive structures could produce different appearances of image patterns due to different illumination, sun shadows, for instance. To make the appearance of the same pattern be consistent, we propose to use an optimum illuminated pattern for each repetitive structure on texture mapping. Thus, this
paper proposes a model-based method for texture mapping using close-range images and Lidar point clouds. Considering the authenticity of façade with repeated patterns under different illumination conditions, a selection of optimum pattern is implemented to yield a realistic model.
2. METEODOLOGY
In this study, we combine three kinds of data, building model, Lidar point clouds, and close range images. Building model provides self-defined coordinate system with building façade information. Lidar point clouds are used to aid occlusion detection. Close range images come with spectral information and there texture characters are used to identify façades. The major works contain four parts: (1) data registration, (2) optimal image sorting, (3) occlusion detection and compensation, and (4) optimal texture selection and mapping.
2.1 Data Registration
In the first part, three data sets among building models, images, and Lidar point clouds, are co-registered to a working coordinate system. Based on the building models, three-dimensional conformal transformation and bundle adjustment are employed to register Lidar point clouds and images, respectively.
2.2 Optimal Image Sorting
In this step, we analyze images with respect to spatial resolution for a working façade, and select a master image and set the priority for alternatives. For these images which cover a working facade, we compute the spatial resolution base on the length of façade’s boundaries. The one with the best spatial The International Archives of the Photogrammetry, Remote Sensing and Spatial Information Sciences, Volume XLI-B2, 2016
XXIII ISPRS Congress, 12–19 July 2016, Prague, Czech Republic
This contribution has been peer-reviewed.
resolution is chosen as the master image. The remaining images are sorted by the corresponding resolution.
2.3 Occlusion Detection and Compensation
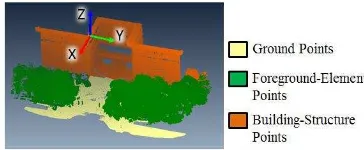
The occlusion detection includes the detection of self-occlusion and foreground-occlusion areas. Self-occlusion is detected through Z-buffer algorithm. And we detect the foreground-occlusion in images by the comparison of building models and Lidar point clouds. We classify the LIDAR points in three categories: ground point, foreground-element point and building-structure point, as shown as Figure 1. Then, the collinearity condition equations are employed to back-project those foreground-element points onto each image. The areas of foreground-occlusion can be detected. At the last step, we compensate the occluded areas in the master image by alternative images in line with optimal image sorting. Thus, we obtain the master image with minimal occlusion.
Figure 1. The classification of Lidar point clouds classification
2.4 Optimal Texture Selection and Mapping
For those building façades with repeated patterns under different illumination conditions, we select the optimal façade texture for the similar repeated patterns. In the selection, both geometric information and texture are analyzed. The geometric information contains the shape and size of the patch in object space, as shown as Figure 2. It’s used to pick up the similar patterns initially. For each group of initial similar pattern, we analyze the grey level co-occurrence matrix (GLCM) (Haralick et al., 1973) and the intensity to determine final similar pattern groups and select the optimal façade texture. In reality, there may be additional objects on building facades, air conditioner for example. Those non-main objects may influence the optimal façade texture selection. Therefore, segmentation is employed in this study, and we only take the majority into account. We calculate the average value of GLCM analysis for each group. Considering the visual effects, the optimal façade texture is selected based on that the GLCM analysis near to the average value with high image brightness. At the last part, façade texture mapping is employed to generate the photorealistic models.
Figure 2. The illustration of initial similar patterns classification
3. EXPERIMENTS
The test site locates in National Central University of Taiwan. The test model is with several repeated patterns, shown in Figure 3. The datasets contain eleven close-range images, as shown in Figure 4, and LIDAR point clouds. Information related to the test data is given in Table 1.
Figure 3. The building model
Figure 4. The test images
LIDAR Point Clouds Imagery
Senson: RIEGL VZ-400 Station: 2
Density: about 600 pts/m2
Senson: Canon EOS 5D Mark II Image size: 5616 x 3744 pixels Pixel Size: 0.0064 mm Focal length: 24.5658 mm Table 1. Information Related to Test Data
Figure 5 lists the selected master images for three façades. The last façade is occluded by a tree in the master image. The results of occlusion detection are shown in Figure 6. We compensate the occluded areas in the master image by alternative images in line with sorting for optimal texture selection.
Table 2 demonstrates the number of selected optimal textures in the experiment. In the geometric information classification, the façades are initially divided into seven categories. The second column in Table 2 indicates the number of patches for each category. After the GLCM and intensity analysis, we separate the initial group into two similar pattern sets in Category-1 and Category-2.
(a) façade 1 (b) façade 2 (c) façade 3
Figure 5. The master images
The International Archives of the Photogrammetry, Remote Sensing and Spatial Information Sciences, Volume XLI-B2, 2016 XXIII ISPRS Congress, 12–19 July 2016, Prague, Czech Republic
This contribution has been peer-reviewed.
(a) master image (b) alternative image 1
(c) alternative image 2 (d) alternative image 3
Figure 6. The results of occlusion detection for façade 3
Category from
geometric shape No. Patches
No. Selected Textures
1 41 2
2 32 2
3 23 1
4 16 1
5 12 1
6 4 1
7 1 1
Table 2. The results of optimal texture selection
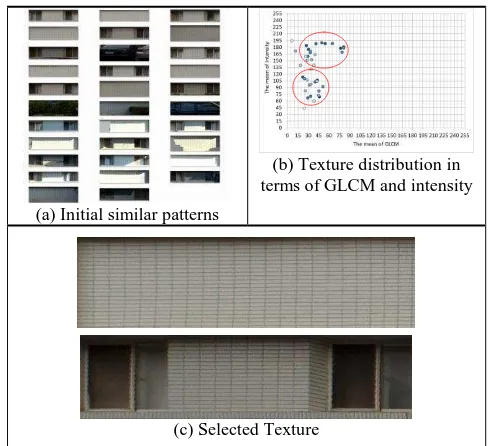
Figure 7~9 show the results of optimal texture selection via texture analysis for Category-1 to Category-3. According to the initial similar patterns in Figure 7 and Figure 8, it is observed that there are two types of similar patterns: pure brick wall and window structure. The texture distribution is also presented two groups significantly in the plots of Category-1 and Category-2. Few patches contain a car, because the acquisition time is different for close-range images and Lidar point clouds. But, it does not affect the final selection. There is only one type of similar pattern in Category-3. The distribution of texture plot is also closer than Category-1 and Category-2.
(a) Initial similar patterns
(b) Texture distribution in terms of GLCM and intensity
(c) Selected Texture
Figure 7. The results of optimal texture selection (Category-1)
(a) Initial similar patterns
(b) Texture distribution in terms of GLCM and intensity
(c) Selected Texture
Figure 8. The results of optimal texture selection (Category-2)
(a) Initial similar patterns (b) Texture distribution in terms of GLCM and intensity
(c) Selected Texture
Figure 9. The results of optimal texture selection (Category-3)
Figure 10 shows the results of texture mapping in different processing stages. Figure 10(a) shows the results of direct draping the corresponding images on the model without any further works. Tree and car patterns are, thus, retained on the building façade 3. Figure 10(b) illustrates the results by the compensation of hidden areas using different angle images. Notice that fragmented pieces appear due to different illumination forming an awkward look. In addition, car patterns still exist on the façade. The occlusion detection was incomplete since that the acquisition time is different between images and Lidar data. There were cars in image shooting, but they were away in Lidar scanning. And Figure 10(c) is the outcome after façade texture selection. It’s observed that the visual effect is significantly improved.
The International Archives of the Photogrammetry, Remote Sensing and Spatial Information Sciences, Volume XLI-B2, 2016 XXIII ISPRS Congress, 12–19 July 2016, Prague, Czech Republic
This contribution has been peer-reviewed.
(a) Direct draping
(b) Occlusion compensated patches
(c) Selected textures
Figure 10. The Results of Texture Mapping
4. CONCLUSIONS
In this investigation, we have proposed a façade texture mapping method by integrating close-range images and LIDAR point clouds. In addition, both geometric information and texture analysis were employed to select the optimal façade texture for the similar repeated structures. Experimental results show that the proposed method provides high fidelity textures in the generation of photorealistic building models. It is demonstrated that the proposed method is also practical in the selection of the optimal texture.
ACKNOWLEDGEMENTS
This investigation was partially supported by the Ministry of Science and Technology of Taiwan under Projects No. MOST104-2119-M-008-023t.
REFERENCES
Frueh, C., Sammon, R., and Avideh, Z., 2004. Automated texture mapping of 3D city models with oblique aerial imagery. Proceedings of 2nd International Symposium on 3D data
processing, Visualization, and Transmission, pp. 396-403.
Haralick, R. M., Shanmugan, K., and Dinstein, I., 1973. Texture Features for Image Classification, IEEE Trans. Sys. Man Cyber, 3(6), pp. 610-621.
Laycock, R.G., and Day, A.M., 2006. Image registration in a coarse three-dimensional virtual environment, Computer Graphic Forum, 25(1), pp. 69-82.
Müller, P., Wonka, P., Haegler, S., Ulmer, A., Gool, L.V., 2006. Procedural modeling of buildings. ACM Trans. on Graphics, 25 (3), pp. 614–623.
Parish, Y.I.H., Müller, P., 2001. Procedural modeling of cities. In: Proceedings of the 28th Annual Conference on Computer Graphics and Interactive Techniques. SIGGRAPH’01. ACM, New York, NY, USA, pp. 301–308.
Tsai, F., and Lin, H.C., 2007. Polygon-based texture mapping for cyber city 3D building models. International Journal of Geographical Information Science, 21(9), pp. 965-981.
Wu, J., Zhou, G., Ding, F.L., and Liu, Z., 2007. Automatic retrieval of optimal texture from aerial video for photo-realistic 3D visualization of street environment. Proceedings of the fourth International Conference on Image and Graphics, pp.943-947.
The International Archives of the Photogrammetry, Remote Sensing and Spatial Information Sciences, Volume XLI-B2, 2016 XXIII ISPRS Congress, 12–19 July 2016, Prague, Czech Republic
This contribution has been peer-reviewed.