Lampiran 1
LEMBAR PERSETUJUAN MENJADI RESPONDEN
(INFORMED CONSENT)
Kepada
Yth : Responden
Di Tempat
Dengan Hormat,
Saya mahasiswi S3 Program Studi Kesehatan Masyarakat USU Medan
Nama : Megawati
NIM : 118111005
Bermaksud akan melaksanakan penelitian tentang ”Peran Asuhan
Keperawatan Dalam Penyembuhan Luka Diabetes Mellitus dengan Gangren di
RSUD Dr.Pirngadi Medan.
Adapun segala informasi yang bapak/ibu berikan akan dijamin
kerahasiaannya dan saya bertanggung jawab apabila informasi yang diberikan
merugikan bapak/ibu, maka dari itu bapak/ibu tidak perlu mencantumkan nama
atau identitas lainnya.
Sehubungan dengan hal tersebut, apabila bapak/ibu setuju untuk ikut serta
dalam penelitian ini dimohon untuk menandatangani kolom yang telah disediakan.
Atas kesediaan dan kerjasamanya saya ucapkan terima kasih.
Responden
Peneliti
(
) ( Megawati )
NIM. 118111005
Lampiran 2
KUESIONER PENELITIAN
PERANAN ASUHAN KEPERAWATAN DALAM PENYEMBUHAN
LUKA DIABETES MELLITUS DENGAN GANGREN DI RSUD
Dr. PIRNGADI MEDAN
Petunjuk Pengisian :
1.
Bacalah pertanyaan dengan baik, kemudian isilah pilihannya.
2.
Beri tanda “
√” jawaban yang anda pilih.
3.
Hasil isian adalah rahasia dan tidak boleh dipublikasikan/sebarluaskan
untuk tujuan lain.
I.
Data Responden
1.
Inisial Responden
: …………...
2.
Umur
: …………...
3.
Jenis kelamin
: Laki-laki Perempuan
4.
Psikologis
: Baik Tidak baik
5.
Sosial
: Baik Tidak baik
6. Pendidikan
: SD SLTP SLTA P.Tinggi
7. Penghasil perbulan
: < Rp. < Rp. 1.800.000
≥ Rp. 1.800.000
II.
Pertanyaan
No.
Pertanyaan
Dilakukan
Diet
Ya
Tidak
1.
Apakah anda selalu menuruti keinginan/nafsu makan
tanpa mengindahkan aturan makan yang telah ditetapkan.
2.
Apakah anda makan nasi pada saat pagi, siang & malam
dengan porsi 1 piring.
3.
Apakah anda tidak mau mengikuti petunjuk tentang
jadwal & aturan makan
4.
Apakah hanya pada siang hari saja anda makan dengan
nasi + lauk pauk
5.
Apakah
keluarga turut mendukung
anda dalam
perencanaan makan yang telah ditetapkan.
Keterangan :
3 – 5 : Terpenuhi
0 – 2 : Tidak terpenuhi
Olahraga Fisik
Ya
Tidak
1.
Menurut anda, apakah lahraga itu penting bagi penderita
diabetes mellitus.
2.
Apakah anda mau untuk memulai latihan olahraga fisik
dengan berjalan-jalan disekitar rumah selama 30 menit.
3.
Apakah latihan olahraga fisik harus dilakukan secara
teratur
4.
Apakah anda setiap hari melakukan olahraga fisik
5.
Apakah jenis latihan olahraga fisik anda
Keterangan :
3 – 5 : Teratur
0 – 2 : Tidak teratur
No.
Pertanyaan
Dilakukan
Perawatan Luka Gangren
Ya
Tidak
1.
Apakah anda tahu cara perawatan luka pada penderita
Diabetes mellitus.
2.
Apakah anda tahu bahwa luka pada penderita Diabetes
mellitus sukar untuk disembuhkan dan cenderung
meninggalkan bekas atau putus.
3.
Apakah
petugas
kesehatan
memberitahukan
cara
perawatan luka lanjutan di rumah
4.
Menurut anda apabila luka gangren dirawat dengan baik
dan benar maka pasti akan sembuh.
5.
Apakah pengobatan luka gangren anda menggunakan
obat antiseptik atau desinfektan.
Keterangan :
3 – 5 : Baik
0 – 2 : Tidak Baik
No.
Pertanyaan
Dilakukan
Pemberian Insulin
Ya
Tidak
1.
Apakah setiap hari mendapatkan terapi insulin.
2.
Apakah terapi insulin yang anda lakukan mempunyai
waktu yang teratur.
3.
Yang dikatakan terapi insulin dengan pemberian suntikan
apakah sama dengan pemberian oral.
4.
Apakah anda tahu lokasi penyuntikan insulin.
5.
Apakah anda teratur mengkonsumsi jenis obat insulin
berupa oral.
Keterangan :
3 – 5 : Baik
0 – 2 : Tidak Baik
Faktor Psikologis
No.
Pernyataan
Ya
Tidak
1.
Saya kesulitan untuk menjalankan diet DM seperti yang
dianjurkan dokter
2.
Saya dapat mengendalikan keluarga ketika saya
membutuhkan bantuan untuk mengikuti diet DM
3.
Saya percaya bahwa diet DM dapat membantu
mencegah saya menderita komplikasi penyakit.
4.
Saya percaya bahwa diet DM dapat membantu saya
mengontrol penyakit diabetes
5.
Mengontrol BB adalah sesuatu yang harus dijalankan,
tidak peduli betapapun sulitnya.
6.
Saya percaya bahwa mengkonsumsi obat DM dapat
membantu mencegah saya menderita komplikasi
penyakit
7.
Mengkonsumsi obat DM adalah sesuatu yang harus
dilakukan, tidak peduli betapapun sulitnya.
8.
Saya yakin bahwa mengkonsumsi obat DM dapat
membantu saya mengontrol penyakit diabetes
9.
Saya percaya bahwa mengkonsumsi obat DM dapat
membantu saya merasa lebih baik
Keterangan :
5 – 9 : Baik
0 – 4 : Tidak Baik
Faktor Sosial
Pertanyaan dibawah ini adalah mengenai seberapa besar dukungan yang
Bapak/Ibu dapatkan dari orang-orang yang ada disekitar Bapak/ Ibu. Sejauh
mana dukungan yang disebutkan dibawah ini tersedia saat Bapak/ Ibu. Sejauh
mana dukungan yang disebutkan dibawah ini tersedia saat Bapak/ Ibu
membutuhkannya?
No.
Pernyataan
Ya
Tidak
1.
Saya banyak menerima dukungan dari teman-teman
untuk penyembuhan luka gangren saya
2.
Tetangga saya selalu menyarankan agar saya tetap
menjalani proses penyembuhan luka gangren dengan
disiplin
3.
Keperdulian sanak saudara membuat saya terus
bersemangat menjalani proses penyembuhan luka
gangren
4.
Dukungan semangat yang saya terima dari orang lain
membuat saya tidak pernah putus asa menjalani proses
penyembuhan luka gangrene
5.
Pihak lain yang tidak saya kenal juga sering membuat
dukungan
semangat
selama
menjalani
proses
penyembuhan luka gangren
6.
Saya tidak pernah merasa ditinggalkan selama proses
penyembuhan berkat adanya dukungan sosial dari
berbagai pihak.
Keterangan :
4 – 6 : Baik
0 – 3 : Tidak Baik
Lampiran Jenis Olahraga Fisik yang Dianjurkan
No
Kelompok
Umur
Jk_k Jogging Berenang
Senam
Kelompok
Bersepeda
Output Hasil Penelitian
jogging * kelompok Crosstabulation
kelompok
Total Intervensi Kontrol
jogging Ya Count 20 11 31
% within jogging 64.5% 35.5% 100.0% % within kelompok 100.0% 100.0% 100.0%
% of Total 64.5% 35.5% 100.0%
Total Count 20 11 31
% within jogging 64.5% 35.5% 100.0% % within kelompok 100.0% 100.0% 100.0%
% of Total 64.5% 35.5% 100.0%
berenang * kelompok Crosstabulation
kelompok
Total Intervensi Kontrol
berenang Tidak Count 19 11 30
% within berenang 63.3% 36.7% 100.0% % within kelompok 95.0% 100.0% 96.8%
% of Total 61.3% 35.5% 96.8%
Ya Count 1 0 1
% within berenang 100.0% .0% 100.0%
% within kelompok 5.0% .0% 3.2%
% of Total 3.2% .0% 3.2%
Total Count 20 11 31
% within berenang 64.5% 35.5% 100.0% % within kelompok 100.0% 100.0% 100.0%
% of Total 64.5% 35.5% 100.0%
senamkelompok * kelompok Crosstabulation
kelompok
Total Intervensi Kontrol
senamkelompok Tidak Count 16 7 23
bersepeda * kelompok Crosstabulation
kelompok
Total Intervensi Kontrol
Lampiran 4
HASIL OUTPUT PENELITIAN
umur_k * kelompok
Crosstab
kelompok
Total Intervensi Kontrol
umur_k 18-45 tahun Count 6 8 14
a. 0 cells (,0%) have expected count less than 5. The minimum expected count is 7,00. b. The standardized statistic is ,166.
jk_k * kelompok
Crosstab
kelompok
Total Intervensi Kontrol
jk_k Laki-laki Count 7 13 20
Continuity Correctionb 1.875 1 .171
Likelihood Ratio 2.731 1 .098 .170 .085
a. 0 cells (,0%) have expected count less than 5. The minimum expected count is 10,00. b. Computed only for a 2x2 table
c. The standardized statistic is -1,629.
pd_k * kelompok
Crosstab
kelompok
Total Intervensi Kontrol
pd_k Tinggi Count 11 5 16
Continuity Correctionb 2.131 1 .144
Likelihood Ratio 3.127 1 .077 .143 .072
a. 0 cells (,0%) have expected count less than 5. The minimum expected count is 8,00. b. Computed only for a 2x2 table
c. The standardized statistic is 1,737.
hasil_k * kelompok
Crosstab
kelompok
Total Intervensi Kontrol
hasil_k Tinggi Count 10 13 23
Continuity Correctionb .282 1 .595
Likelihood Ratio .636 1 .425 .596 .298
a. 0 cells (,0%) have expected count less than 5. The minimum expected count is 11,50. b. Computed only for a 2x2 table
c. The standardized statistic is -,790.
psi_k * kelompok
Crosstab
kelompok
Total Intervensi Kontrol
psi_k Baik Count 17 12 29
Continuity Correctionb 1.068 1 .301
Likelihood Ratio 1.676 1 .195 .301 .151
a. 0 cells (,0%) have expected count less than 5. The minimum expected count is 14,50. b. Computed only for a 2x2 table
c. The standardized statistic is 1,281.
sos_k * kelompok
Crosstab
kelompok
Total Intervensi Kontrol
sos_k Baik Count 17 11 28
Continuity Correctionb 1.674 1 .196
Likelihood Ratio 2.427 1 .119 .195 .098
a. 0 cells (,0%) have expected count less than 5. The minimum expected count is 14,00. b. Computed only for a 2x2 table
c. The standardized statistic is 1,540.
d1 * kelompok Crosstabulation
kelompok
Total Intervensi Kontrol
d1 Tidak Count 2 4 6
d2 * kelompok Crosstabulation
kelompok
Total Intervensi Kontrol
d3 * kelompok Crosstabulation
kelompok
Total Intervensi Kontrol
d3 Tidak Count 7 17 24
d4 * kelompok Crosstabulation
kelompok
Total Intervensi Kontrol
d5 * kelompok Crosstabulation
kelompok
Total Intervensi Kontrol
d5 Tidak Count 8 14 22
ofi1 * kelompok Crosstabulation
kelompok
Total Intervensi Kontrol
ofi2 * kelompok Crosstabulation
kelompok
Total Intervensi Kontrol
ofi2 Tidak Count 10 19 29
ofi3 * kelompok Crosstabulation
kelompok
Total Intervensi Kontrol
ofi4 * kelompok Crosstabulation
kelompok
Total Intervensi Kontrol
ofi4 Tidak Count 10 19 29
ofi5 * kelompok Crosstabulation
kelompok
Total Intervensi Kontrol
pl1 * kelompok Crosstabulation
kelompok
Total Intervensi Kontrol
pl1 Tidak Count 5 5 10
pl2 * kelompok Crosstabulation
kelompok
Total Intervensi Kontrol
pl3 * kelompok Crosstabulation
kelompok
Total Intervensi Kontrol
pl3 Tidak Count 9 11 20
pl4 * kelompok Crosstabulation
kelompok
Total Intervensi Kontrol
pl5 * kelompok Crosstabulation
kelompok
Total Intervensi Kontrol
pl5 Tidak Count 5 9 14
pi1 * kelompok Crosstabulation
kelompok
Total Intervensi Kontrol
pi2 * kelompok Crosstabulation
kelompok
Total Intervensi Kontrol
pi2 Tidak Count 12 13 25
pi3 * kelompok Crosstabulation
kelompok
Total Intervensi Kontrol
pi4 * kelompok Crosstabulation
kelompok
Total Intervensi Kontrol
pi4 Tidak Count 11 16 27
pi5 * kelompok Crosstabulation
kelompok
Total Intervensi Kontrol
p1 * kelompok Crosstabulation
kelompok
Total Intervensi Kontrol
p1 Tidak Count 2 2 4
p2 * kelompok Crosstabulation
kelompok
Total Intervensi Kontrol
p3 * kelompok Crosstabulation
kelompok
Total Intervensi Kontrol
p3 Tidak Count 21 21 42
p4 * kelompok Crosstabulation
kelompok
Total Intervensi Kontrol
p5 * kelompok Crosstabulation
kelompok
Total Intervensi Kontrol
p5 Tidak Count 4 14 18
p6 * kelompok Crosstabulation
kelompok
Total Intervensi Kontrol
p7 * kelompok Crosstabulation
kelompok
Total Intervensi Kontrol
p7 Tidak Count 17 17 34
p8 * kelompok Crosstabulation
kelompok
Total Intervensi Kontrol
p9 * kelompok Crosstabulation
kelompok
Total Intervensi Kontrol
p9 Tidak Count 15 10 25
s1 * kelompok Crosstabulation
kelompok
Total Intervensi Kontrol
s2 * kelompok Crosstabulation
kelompok
Total Intervensi Kontrol
s2 Tidak Count 8 13 21
s3 * kelompok Crosstabulation
kelompok
Total Intervensi Kontrol
s4 * kelompok Crosstabulation
kelompok
Total Intervensi Kontrol
s4 Tidak Count 12 12 24
s5 * kelompok Crosstabulation
kelompok
Total Intervensi Kontrol
s6 * kelompok Crosstabulation
kelompok
Total Intervensi Kontrol
s6 Tidak Count 13 15 28
% within s6 46.4% 53.6% 100.0%
% within kelompok 43.3% 50.0% 46.7%
% of Total 21.7% 25.0% 46.7%
Ya Count 17 15 32
% within s6 53.1% 46.9% 100.0%
% within kelompok 56.7% 50.0% 53.3%
% of Total 28.3% 25.0% 53.3%
Total Count 30 30 60
% within s6 50.0% 50.0% 100.0%
% within kelompok 100.0% 100.0% 100.0%
% of Total 50.0% 50.0% 100.0%
diet_pre * kelompok
Crosstab
kelompok
Total Intervensi Kontrol
diet_pre Terpenuhi Count 12 14 26
Continuity Correctionb .068 1 .794
Likelihood Ratio .272 1 .602 .795 .397
a. 0 cells (,0%) have expected count less than 5. The minimum expected count is 13,00. b. Computed only for a 2x2 table
c. The standardized statistic is -,517.
diet_post * kelompok
Crosstab
kelompok
Total Intervensi Kontrol
diet_post Terpenuhi Count 24 11 35
Continuity Correctionb 9.874 1 .002
Likelihood Ratio 12.050 1 .001 .001 .001
a. 0 cells (,0%) have expected count less than 5. The minimum expected count is 12,50. b. Computed only for a 2x2 table
c. The standardized statistic is 3,376.
ofi_pre * kelompok
Crosstab
kelompok
Total Intervensi Kontrol
ofi_pre Teratur Count 19 14 33
Continuity Correctionb 1.077 1 .299
Likelihood Ratio 1.692 1 .193 .299 .150
a. 0 cells (,0%) have expected count less than 5. The minimum expected count is 13,50. b. Computed only for a 2x2 table
c. The standardized statistic is 1,287.
ofi_post * kelompok
Crosstab
kelompok
Total Intervensi Kontrol
ofi_post Teratur Count 23 10 33
Continuity Correctionb 9.697 1 .002
Likelihood Ratio 11.789 1 .001 .002 .001
a. 0 cells (,0%) have expected count less than 5. The minimum expected count is 13,50. b. Computed only for a 2x2 table
c. The standardized statistic is 3,345.
pl_pre * kelompok
Crosstab
kelompok
Total Intervensi Kontrol
pl_pre Baik Count 1 6 7
Continuity Correctionb 2.588 1 .108
Likelihood Ratio 4.435 1 .035 .103 .051
a. 2 cells (50,0%) have expected count less than 5. The minimum expected count is 3,50. b. Computed only for a 2x2 table
c. The standardized statistic is -1,994.
pl_post * kelompok
Crosstab
kelompok
Total Intervensi Kontrol
pl_post Baik Count 23 10 33
Continuity Correctionb 9.697 1 .002
Likelihood Ratio 11.789 1 .001 .002 .001
a. 0 cells (,0%) have expected count less than 5. The minimum expected count is 13,50. b. Computed only for a 2x2 table
c. The standardized statistic is 3,345.
pi_pre * kelompok
Crosstab
kelompok
Total Intervensi Kontrol
pi_pre Baik Count 1 2 3
Continuity Correctionb .000 1 1.000
Likelihood Ratio .357 1 .550 1.000 .500
a. 2 cells (50,0%) have expected count less than 5. The minimum expected count is 1,50. b. Computed only for a 2x2 table
c. The standardized statistic is -,587.
pi_post * kelompok
Crosstab
kelompok
Total Intervensi Kontrol
pi_post Baik Count 24 11 35
Continuity Correctionb 9.874 1 .002
Likelihood Ratio 12.050 1 .001 .001 .001
a. 0 cells (,0%) have expected count less than 5. The minimum expected count is 12,50. b. Computed only for a 2x2 table
c. The standardized statistic is 3,376.
kgd_pree * kelompok
Crosstab
kelompok
Total Intervensi Kontrol
kgd_pree Baik Count 1 3 4
Continuity Correctionb .268 1 .605
Likelihood Ratio 1.118 1 .290 .612 .306
a. 2 cells (50,0%) have expected count less than 5. The minimum expected count is 2,00. b. Computed only for a 2x2 table
c. The standardized statistic is -1,026.
kgd_post * kelompok
Crosstab
kelompok
Total Intervensi Kontrol
kgd_post Baik Count 26 14 40
Continuity Correctionb 9.075 1 .003
Likelihood Ratio 11.366 1 .001 .002 .001
a. 0 cells (,0%) have expected count less than 5. The minimum expected count is 10,00. b. Computed only for a 2x2 table
c. The standardized statistic is 3,259.
uklu_pre * kelompok
Crosstab
kelompok
Total Intervensi Kontrol
uklu_pre Baik Count 11 9 20
Continuity Correctionb .075 1 .784
Likelihood Ratio .300 1 .584 .785 .392
a. 0 cells (,0%) have expected count less than 5. The minimum expected count is 10,00. b. Computed only for a 2x2 table
c. The standardized statistic is ,543.
uklu_post * kelompok
Crosstab
kelompok
Total Intervensi Kontrol
uklu_post Baik Count 26 7 33
Continuity Correctionb 21.818 1 .000
Likelihood Ratio 26.420 1 .000 .000 .000
a. 0 cells (,0%) have expected count less than 5. The minimum expected count is 13,50. b. Computed only for a 2x2 table
c. The standardized statistic is 4,889.
penyluka_pre * kelompok
Crosstab
kelompok
Total Intervensi Kontrol
penyluka_pre Baik Count 2 1 3
Continuity Correctionb .000 1 1.000
Likelihood Ratio .357 1 .550 1.000 .500
a. 2 cells (50,0%) have expected count less than 5. The minimum expected count is 1,50. b. Computed only for a 2x2 table
c. The standardized statistic is ,587.
penyluka_post * kelompok
Crosstab
kelompok
Total Intervensi Kontrol
penyluka_post Baik Count 6 0 6
Continuity Correctionb 4.630 1 .031
Likelihood Ratio 8.986 1 .003 .024 .012
a. 2 cells (50,0%) have expected count less than 5. The minimum expected count is 3,00. b. Computed only for a 2x2 table
c. The standardized statistic is 2,560.
ANALISIS BIVARIAT
diet_k * Pluka_k
Crosstab
Continuity Correctionb 9.876 1 .002
Likelihood Ratio 12.409 1 .000 .001 .001
a. 0 cells (,0%) have expected count less than 5. The minimum expected count is 10,42. b. Computed only for a 2x2 table
c. The standardized statistic is 3,380.
Risk Estimate
Value
95% Confidence Interval
Lower Upper Odds Ratio for diet_k (Terpenuhi
/ Tidak terpenuhi)
7.875 2.222 27.906
For cohort Pluka_k = Baik 3.750 1.468 9.581 For cohort Pluka_k = Buruk .476 .307 .740
N of Valid Cases 60
ofi_k * Pluka_k
Continuity Correctionb 8.560 1 .003
Likelihood Ratio 10.553 1 .001 .002 .002
a. 0 cells (,0%) have expected count less than 5. The minimum expected count is 12,08. b. Computed only for a 2x2 table
c. The standardized statistic is 3,161.
Risk Estimate
Value
95% Confidence Interval
Lower Upper Odds Ratio for ofi_k (Teratur /
pl_k * Pluka_k
Continuity Correctionb 6.182 1 .013
Likelihood Ratio 8.311 1 .004 .006 .005
a. 0 cells (,0%) have expected count less than 5. The minimum expected count is 7,92. b. Computed only for a 2x2 table
c. The standardized statistic is 2,745.
Risk Estimate
Value
95% Confidence Interval
pi_k * Pluka_k
Continuity Correctionb 9.876 1 .002
Likelihood Ratio 12.409 1 .000 .001 .001
a. 0 cells (,0%) have expected count less than 5. The minimum expected count is 10,42. b. Computed only for a 2x2 table
c. The standardized statistic is 3,380.
Risk Estimate
Value
95% Confidence Interval
Kelompok Intervensi
diet_k * Pluka_k
Crosstab
sided) Point Probability
Pearson Chi-Square .170a 1 .680 1.000 .520
Continuity Correctionb .000 1 1.000
Likelihood Ratio .165 1 .685 1.000 .520
Fisher's Exact Test .645 .520
Linear-by-Linear Association .165c 1 .685 1.000 .520 .345
N of Valid Cases 30
a. 2 cells (50,0%) have expected count less than 5. The minimum expected count is 1,60. b. Computed only for a 2x2 table
c. The standardized statistic is ,406.
ofi_k * Pluka_k
sided) Point Probability
Pearson Chi-Square 1.364a 1 .243 .384 .230
Continuity Correctionb .533 1 .465
Likelihood Ratio 1.319 1 .251 .384 .230
Fisher's Exact Test .384 .230
Linear-by-Linear Association 1.318c 1 .251 .384 .230 .174
N of Valid Cases 30
a. 1 cells (25,0%) have expected count less than 5. The minimum expected count is 2,67. b. Computed only for a 2x2 table
c. The standardized statistic is 1,148.
pl_k * Pluka_k
sided) Point Probability
Pearson Chi-Square .545a 1 .460 .589 .405
Continuity Correctionb .034 1 .854
Likelihood Ratio .511 1 .475 .589 .405
Fisher's Exact Test .589 .405
Linear-by-Linear Association .527c 1 .468 .589 .405 .303
N of Valid Cases 30
a. 2 cells (50,0%) have expected count less than 5. The minimum expected count is 1,33. b. Computed only for a 2x2 table
c. The standardized statistic is ,726.
pi_k * Pluka_k
sided) Point Probability
Pearson Chi-Square 3.037a 1 .081 .158 .103
Continuity Correctionb 1.628 1 .202
Likelihood Ratio 2.842 1 .092 .158 .103
Fisher's Exact Test .158 .103
Linear-by-Linear Association 2.936c 1 .087 .158 .103 .087
N of Valid Cases 30
a. 1 cells (25,0%) have expected count less than 5. The minimum expected count is 2,13. b. Computed only for a 2x2 table
c. The standardized statistic is 1,713.
Kelompok Kontrol
diet_k * Pluka_k
Crosstab
sided) Point Probability
Pearson Chi-Square 5.758a 1 .016 .041 .041
Continuity Correctionb 3.126 1 .077
Likelihood Ratio 6.614 1 .010 .041 .041
Fisher's Exact Test .041 .041
Linear-by-Linear Association 5.566c 1 .018 .041 .041 .041
N of Valid Cases 30
a. 2 cells (50,0%) have expected count less than 5. The minimum expected count is 1,10. b. Computed only for a 2x2 table
c. The standardized statistic is 2,359.
ofi_k * Pluka_k
sided) Point Probability
Pearson Chi-Square 5.758a 1 .016 .041 .041
Continuity Correctionb 3.126 1 .077
Likelihood Ratio 6.614 1 .010 .041 .041
Fisher's Exact Test .041 .041
Linear-by-Linear Association 5.566c 1 .018 .041 .041 .041
N of Valid Cases 30
a. 2 cells (50,0%) have expected count less than 5. The minimum expected count is 1,10. b. Computed only for a 2x2 table
c. The standardized statistic is 2,359.
pl_k * Pluka_k
sided) Point Probability
Pearson Chi-Square 2.917a 1 .088 .228 .138
Continuity Correctionb 1.205 1 .272
Likelihood Ratio 4.062 1 .044 .228 .138
Fisher's Exact Test .228 .138
Linear-by-Linear Association 2.819c 1 .093 .228 .138 .138
N of Valid Cases 30
a. 2 cells (50,0%) have expected count less than 5. The minimum expected count is 1,40. b. Computed only for a 2x2 table
c. The standardized statistic is 1,679.
pi_k * Pluka_k
sided) Point Probability
Pearson Chi-Square 4.359a 1 .037 .070 .070
Continuity Correctionb 2.172 1 .141
Likelihood Ratio 5.460 1 .019 .070 .070
Fisher's Exact Test .070 .070
Linear-by-Linear Association 4.214c 1 .040 .070 .070 .070
N of Valid Cases 30
a. 2 cells (50,0%) have expected count less than 5. The minimum expected count is 1,30. b. Computed only for a 2x2 table
c. The standardized statistic is 2,053.
ANALISIS MULTIVARIAT
Logistic Regression
Case Processing Summary
Unweighted Casesa N Percent
Selected Cases Included in Analysis 60 100.0
Missing Cases 0 .0
Total 60 100.0
Unselected Cases 0 .0
Total 60 100.0
a. If weight is in effect, see classification table for the total number of cases.
Dependent Variable Encoding
Original
Value Internal Value
Baik 0
Buruk 1
Block 1: Method = Backward Stepwise (Likelihood Ratio)
Omnibus Tests of Model Coefficients
Chi-square df Sig.
a. A negative Chi-squares value indicates that the Chi-squares value has decreased from the previous step.
Model Summary
Step -2 Log likelihood
Cox & Snell R
a. Estimation terminated at iteration number 5 because parameter estimates changed by less than ,001.
Classification Tablea
Overall Percentage 81.7
Step 2 Pluka_k Baik 16 9 64.0
Buruk 4 31 88.6
Overall Percentage 78.3
a. The cut value is ,500
Variables in the Equation
B S.E. Wald df Sig. Exp(B) a. Variable(s) entered on step 1: diet_k, ofi_k, pl_k, pi_k.
Model if Term Removed
Variables not in the Equation
Score df Sig.
Step 2a Variables pl_k 2.429 1 .119
Overall Statistics 2.429 1 .119
a. Variable(s) removed on step 2: pl_k.
KELOMPOK INTERVENSI
Logistic Regression
Case Processing Summary
Unweighted Casesa N Percent
Selected Cases Included in Analysis 30 100.0
Missing Cases 0 .0
Total 30 100.0
Unselected Cases 0 .0
Total 30 100.0
a. If weight is in effect, see classification table for the total number of cases.
Dependent Variable Encoding
Original
Value Internal Value
Baik 0
Buruk 1
Variables not in the Equation
Score df Sig.
Step 0 Variables ofi_k 1.364 1 .243
pi_k 3.037 1 .081
Overall Statistics 4.196 2 .123
Block 1: Method = Backward Stepwise (Likelihood Ratio)
Omnibus Tests of Model Coefficients
Chi-square df Sig.
a. A negative Chi-squares value indicates that the Chi-squares value has decreased from the previous step.
Model Summary
Step -2 Log likelihood
Cox & Snell R
a. Estimation terminated at iteration number 4 because parameter estimates changed by less than ,001.
Classification Tablea
Overall Percentage 76.7
Step 2 Pluka_k Baik 18 4 81.8
Buruk 4 4 50.0
Overall Percentage 73.3
a. The cut value is ,500
Variables in the Equation
B S.E. Wald df Sig. Exp(B)
a. Variable(s) entered on step 1: ofi_k, pi_k.
Model if Term Removed
KELOMPOK KONTROL
Logistic Regression
Case Processing Summary
Unweighted Casesa N Percent
Selected Cases Included in Analysis 30 100.0
Missing Cases 0 .0
Total 30 100.0
Unselected Cases 0 .0
Total 30 100.0
a. If weight is in effect, see classification table for the total number of cases.
Dependent Variable Encoding
Original
Value Internal Value
Baik 0
Buruk 1
Variables not in the Equation
Score df Sig.
Step 0 Variables diet_k 5.758 1 .016
ofi_k 5.758 1 .016
pl_k 2.917 1 .088
pi_k 4.359 1 .037
Overall Statistics 10.180 4 .037
Block 1: Method = Backward Stepwise (Likelihood Ratio)
Omnibus Tests of Model Coefficients
Chi-square df Sig.
Step 1 Step 15.006 4 .005
Block 15.006 4 .005
Model 15.006 4 .005
Step 2a Step .000 1 1.000
Block 15.006 3 .002
Model 15.006 3 .002
Step 3a Step -2.231 1 .135
Block 12.775 2 .002
Model 12.775 2 .002
a. A negative Chi-squares value indicates that the Chi-squares value has decreased from the previous step.
Model Summary
Step -2 Log likelihood
Cox & Snell R Square
Nagelkerke R Square
1 4.499a .394 .823
2 4.499a .394 .823
3 6.730a .347 .725
a. Estimation terminated at iteration number 20 because maximum iterations has been reached. Final solution cannot be found.
Classification Tablea
Observed
Predicted
Pluka_k
Percentage Correct Baik Buruk
Step 1 Pluka_k Baik 3 0 100.0
Buruk 1 26 96.3
Overall Percentage 96.7
Step 2 Pluka_k Baik 3 0 100.0
Buruk 1 26 96.3
Overall Percentage 96.7
Step 3 Pluka_k Baik 3 0 100.0
Buruk 2 25 92.6
Overall Percentage 93.3
a. The cut value is ,500
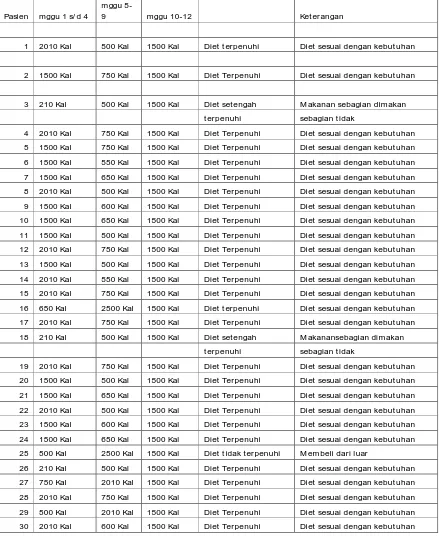
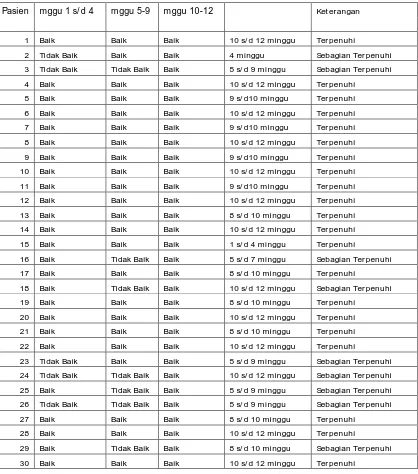
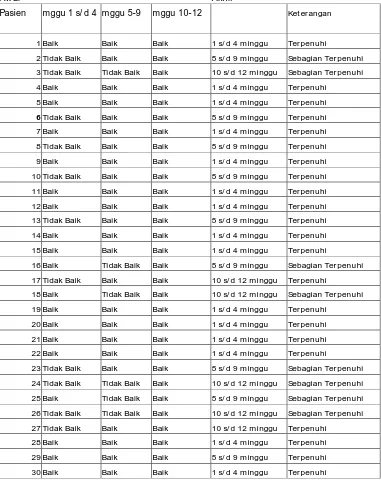
Tabel Hasil Intervensi Diet Aw al dan Akhir Perlakuan pada Pasien Luka Gangren Penderita DM Kelompok Intervensi
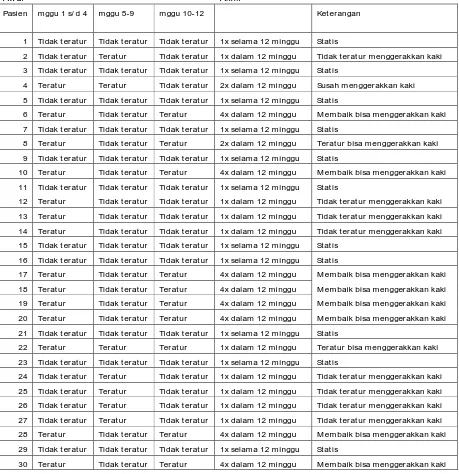
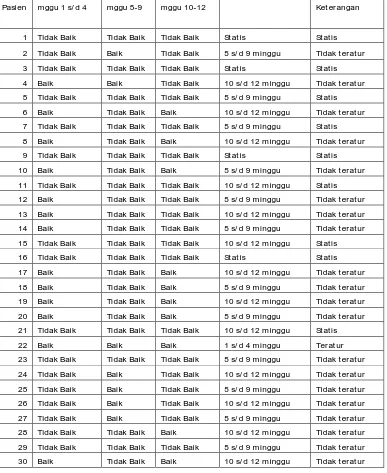
Tabel Hasil Olahraga Aw al dan Akhir Pada Pasien Luka Gangren Penderita DM Kelompok Kontrol
Ket erangan Pem berian Olahraga Aw al dan Akhir Perlakuan
pada Pasien Luka Gangren Penderit a DM Kelompok Kasus
Senam kaki dilakukan pada posisi berdiri, duduk dan tidur manfaatnya :
- Membantu memperbaiki peredaran darah yang terganggu dan memperkuat otot-otot kaki, otot
betis dan paha.
- Mengatasi adanya keterbatasan gerak sendiri
- Mencegah terjadinya kelainan bentuk pada kaki
Gerakan senam kaki dibetes yang dapat dilakukan oleh pasien DM secara teratur dengan
sendiri atau bersama-sama :
1. Jika dilakukan dalam posisi duduk maka posisikan pasien duduk tegak diatas bangku
2. Dengan meletakkan tumit dilantai, jari-jari kedua belas kaki diluruskan keatas lalu
dibengkokkan kembali ke bawah seperti cakar ayam sebanyak 10 kali.
3. Dengan meletakkan tumit salah satu kaki dilantai, angka ujung telapak kaki keatas. Pada kaki
lainnya, hari-jari kaki diletakkan di lantai dengan tumit kaki diangkatkan ke atas. Cara ini dilakukan
bersamaan pada kaki kiri dan kanan secara bergantian dan diulangi sebanyak 10 kali.
4. Tumit kaki diletakkan di lantai. Bagian ujung kaki diangkat ke atas dan buat gerakan memutar
kearah samping dengan pergerakan pada kaki sebanyak 10 kali.
Lalu turunkan kembali ke lantai dan gerakan ke tengah
5. Jari-jari kaki diletakkan di lantai. Tumit diangkat dan buat gerakan memutar dengan
pergerakan kaki sebanyak 10 kali.
6. Angkat salah satu lutut kaki, dan luruskan. Gerakkan jari-jari ke depan turunkan kembali
secara bergantian ke kiri dan ke kanan. Ulangi sebanyak 10 kali ke arah wajah
lalu turunkan kembali ke lantai.
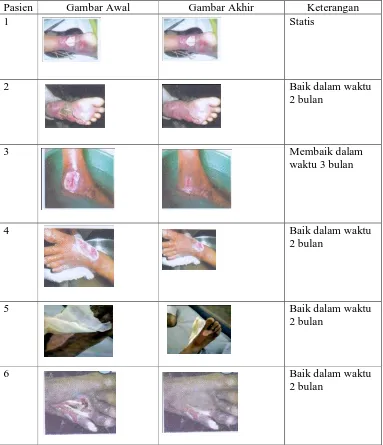
Pasien mggu 1 s/ d 4 mggu 5-9 mggu 10-12 Ket erangan
26 St adium 3 St adium 2 St adium 2 St adium 1 M em baik
27 St adium 2 St adium 2 St adium 2 St adium 2 St at is
28 St adium 3 St adium 3 St adium 3 St adium 1 Baik
29 St adium 2 St adium 2 St adium 2 St adium 2 St at is
30 St adium 3 St adium 3 St adium 3 St adium 3 St at is
Cat at an :
1. Hasil pengukuran luka St adium 1,2,3,4,5 Naik : t idak baik
Dilihat st adium mulai 1 – 5 yait u :
(dengan goa), penet rasi dalam,
oat eo, ileit is, pyart hr osis, abses
plant ar at au infeksi
hingga t endon. Gangren sebagian,
menyebar hingga jari kaki, kulit
sekit arnya selulit is, gangren
lembab/ kering. Seluruh kaki dalam
kondisi nekrot ik/ gangr en.
Hasil pengukuran luka jika kembali ke st adium 0
Turun : baik apabila kondisi
luka kulit kembali normal, t anda-t anda
insf eksi t idak t erjadi
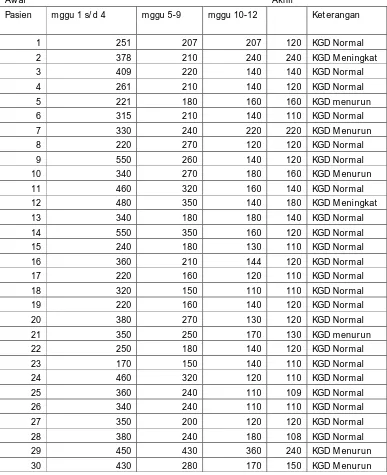
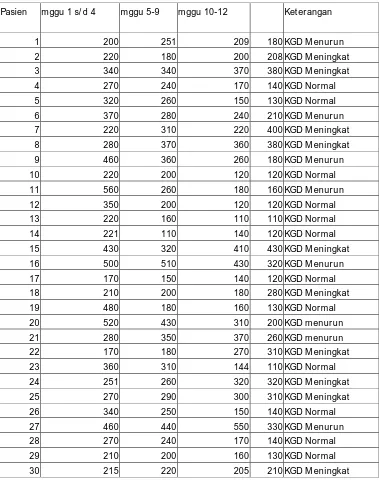
Tabel Hasil Intervensi Pemeriksaan Ukuran KGD Kelompok Perlakuan Pada Pasien Luka Gangren Pada Penderita DM
Cat at an :
Kadar Gula Darah Normal
Untuk mengetahui berapa kadar gula darah yang ideal, kita bisa merujuk pada kadar gula darah
normal menurut WHO. Dengan demikian, kita memiliki acuan
yang jelas agar t et ap bisa menjaga kadar gula t idak t erlalu t inggi at au t erlalu rendah.
- Ketika puasa: 4 - 7 mmol/l atau 72 - 126 mg/dl
- 90 menit setelah makan: 10 mmol/l atau 180 mg/dl
- Malam hari: 8 mmol/l atau 144 mg/dl
Dengan menjaganya tetap normal, Anda tidak perlu khawatir akan resiko diabetes.
Apabila lebih tinggi dari batas normal maka wajib untuk melakukan diet gula.
Walaupun demikian, dalam diet gula, jangan terlalu ekstrim menghindari yang manis-manis.
Gula Darah Rendah
Setiap orang memerlukan tenaga walaupun dia seorang penderita diabetes dengan gula darah
tinggi sekalipun Jika terlalu menghindari makanan manis makan orang tersebut akan mengalami
gula darah rendah. Biasanya ditandai dengan rasa lemas dan kunang-kunang.
Untuk itu, apabila terjadi gula darah drop dan terasa lemas, segera makan yang manis-manis.
Makanan manis yang disarankan adalah buah-buahan. Buah manis
dapat dengan cepat dicerna oleh tubuh yaitu antara 10-20 menit saja.
Dengan makan besar seperti makan nasi seperti biasa maka akan membutuhkan waktu
antara 2-3 jam untuk dicerna. Segera makan buah apabila gula darah rendah.
Gula Darah Tinggi
Hiperglikemia atau gula darah tinggi merupakan masalah kesehatan yang serius bagi
mereka dengan diabetes, yang terjadi ketika ada terlalu banyak gula dalam darah.
Tabel Hasil Intervensi Psikologi Kelompok Aw al dan Akhir Pada Pasien
Luka Gangren Penderita DM Kelompok Intervensi
Tabel Hasil Intervensi Psikologi Kelompok Aw al dan Akhir Pada Pasien
Luka Gangren Penderita DM Kelompok Kontrol
Aw al Akhir
Pember dayaan Psikologi Diet , Olahr aga, Peraw at an Luka, Pengobat an luka, pem berian insulin Pasien DM dengan Luka Gangren
Tabel Hasil Intervensi Sosial Kelompok Aw al dan Akhir Pada Pasien
Luka Gangren Penderita DM Kelompok Intervensi
Tabel Hasil Intervensi Sosial Kelompok Aw al dan Akhir Pada Pasien
Luka Gangren Penderita DM Kelompok Kontrol
Aw al Akhir
Dukungan sosial keluarga unt uk m endapat kan int er aksi dengan pasien, dici nt ai secara fisik
psikologis dari pasangan hi dup orang t ua pasien, saudara, anak, kerabat , t eman, rekan kerja
st aff medis, kelompok masyarakat .