DETERMINATION OF THE DEGREE OF GRAVEL
AGGREGATE-BITUMEN-COVERAGE BY MULTI-DIRECTIONAL REFLECTANCE MEASUREMENTS
C. Mulsow
Institute of Photogrammetry and Remote Sensing, Technische Universität Dresden, D-01062 Dresden,
[email protected]
Commission V
KEY WORDS: Segmentation/classification, laser illumination, multi-directional
ABSTRACT:
The paper describes the determination of the percentage area of bitumen on partly covered aggregate. This task is a typical issue in material testing in road construction. The asphalt components bitumen and aggregate are subjected to defined mechanical stress in the presence of water in order to test the affine properties of the components. The degree to which the bitumen separates from the aggregate surface serves as an indicator for the quality of the affinity. Until now, examiners have been judging the coverage degree of samples by visual rating. Several research projects attempted to replace the error-prone subjective assessment by automatic procedures. These procedures analyse the different chromaticities of aggregate and bitumen in RGB images. However, these approaches as a whole are not reliable enough because of the rather specific requirements that are made on the environmental conditions when the picture is taken (illumination, exclusion of extraneous light) and also on the lab assistant (manual definition of training areas, management of camera and illumination parameters). Moreover, the analysis is not suitable for all types of rock because of the necessary difference in colour between bitumen and aggregate (e.g. dark rock samples). Contrary to previous approaches, the new multi-directional reflectance measurements use the different surface characteristics of bitumen and aggregate instead of the chromaticities as separation criteria. These differences are made visible by directional lighting with a laser. The diffuse reflection from the aggregate surface and the directional reflection from the optically smoother bitumen produce definitely distinguishable brightnesses in the image. Thus the colour of the material is of no significance. The approach was used in a procedure and assessed. The paper presents the method itself, approaches for the elimination of reflections and first results. Moreover, the measuring principle is compared with existing procedures and benefits and drawbacks are outlined.
1. INTRODUCTION AND MOTIVATION
Every year the several billion Euros are being invested for the construction and maintenance of the road network. The increase of traffic congestion (more traffic volume, increase of wheel loading) and climate change (extreme temperatures) result in higher demands for road design. Most roads have a top layer of asphalt. Basically, this composite material consists of bitumen and a mineral aggregate. Bitumen acts in the mix as a binder between the single grains. The adhesion quality (i.e. affinity) between binder and aggregate is crucial for the stability, quality and endurance of the finished road. Mixes of different sorts of bitumen and aggregates show a different adhesion behaviour. Before mixing asphalt concrete, the components are tested on their compliance to the requirements.
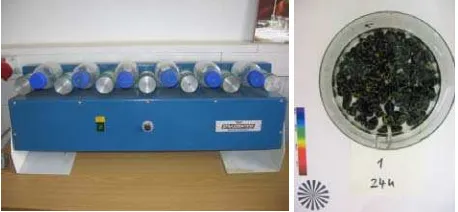
Figure 1: Rolling-bottle test. Left: rolling device. Right: sample for visual estimation.
In the EU, the rolling bottle test according to EN 12697-11 is used for this purpose. In the test, aggregate particles are coated
with bitumen (film thickness ca. 0.1 mm). The coated aggregate is then placed in a bottle containing deionised water and a glass rod, wherein they are rotated at ambient temperature (see figure 1). After defined time steps, the residual degree of bitumen coverage of the particles is estimated visually. For each rolling time the mean of the two operators' results is calculated and rounded to the nearest 5 %. The degree to which the bitumen separates from the aggregate surface serves as an indicator for the quality of the affinity. In case of low affinity, a different sort of mineral or bitumen hast to be used or adhesion promoters have to be added. This will usually lead to higher costs.
An incorrect determination of affinity can cause high economic losses. If the affinity is estimated too optimistic, the service time of an asphalt road is reduced. In case of too pessimistic results, an unnecessary addition of adhesion promoters leads to higher costs. Due to the visual estimation, the degree of bitumen coverage of the particles determined in the rolling bottle test is highly subjective. According to EN 12697-11, the use of schematic comparison charts for the operators should reduce these effects. Nevertheless, a low reliability and reproducibility is still present. The operators have to be highly qualified and experienced. This increases the costs of the test further. Test series with different institutes showed a limited reproducibility and accuracy (unpublished statistics from Institute of Urban and Pavement Engineering, TU-Dresden). International Archives of the Photogrammetry, Remote Sensing and Spatial Information Sciences, Volume XXXIX-B5, 2012
2. APPROACHES BASED ON RGB-IMAGES
Several projects were carried out over the past years (e.g. Grönnige, 2008; Morgenstern et. al., 2010) to overcome the visual estimation of degree of bitumen coverage. The main goal was to increase reliability, reproducibility and accuracy. Furthermore, a significant reduction of interactive efforts and requirements on an operator should be achieved. All projects mentioned above relied on a computer aided analysis of RGB-images. Principally, both implemented approaches work like a supervised multispectral classification.
(Grönnige, 2008) describes the use of the commercial software ENVI (ITT Visual Information Solutions). Normally this software is used for the classification of multispectral satellite and aerial images. First, training sites were defined manually for the classes “bitumen” and “aggregate”. A maximum likelihood classification was performed afterwards and from the number of background pixels, “bitumen”- and “aggregate”-pixels the ratio of covering was calculated.
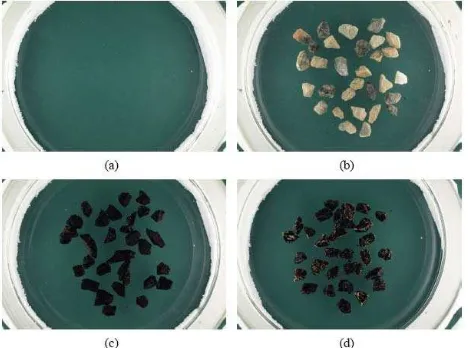
(Morgenstern et. al., 2010) adopt a combination of segmentation and classification routines for this task. Instead of training sites, multiple taken images were used for the definition of feature space – one with the empty Petri dish only (figure 2a), another with uncovered aggregate (figure 2b) and finally an image with fully covered material (figure 2c).
Figure 2: Probabilistic segmentation based on color images. Reference images for background (a), for aggregate (b) and bitumen (c). Material probe in a Petri dish (Morgenstern et. al., 2010).
Figure 3: Original image (left) and classification result (right) (Morgenstern et. al., 2010).
The approach based on a probabilistic segmentation scheme (Schlesinger & Flach, 2008). First, a statistical model of the correspondence between image content and degree of coverage has to found. The model parameters have to be estimated by a learning procedure based on the reference images mentioned above (figure 2 and 3).
The presented methods are more objective than the traditional visual estimation, but have still some major shortcomings:
dark sorts of aggregate prevents a significant discrimination from bitumen
reflections on the bitumen surface cause wrong classifications
shadows due to side illumination led to wrong results (e.g. background is classified as aggregate)
bright aggregate surfaces in combination with inadequate lighting cause problems in the detection of aggregate pixels
problems with dark sorts of aggregate together with inhomogeneous illumination and irregular layout results highly depend on training sites or images high computational effort due to complex algorithms
(especially when using probabilistic segmentation scheme, >1h).
Because of that, the need for a better method was still present. A pilot survey was carried out to find a more reliable and efficient way for the determination of aggregate covering. It was found out that the measurement of multi-directional reflectance as outlined in the next section is effective way to achieve this.
3. NEW APPROACH BASED ON REFLECTANCE
In contrast to previous approaches, the new multi-directional reflectance measurement shown here uses the different surface characteristics of bitumen and aggregate instead of the chromaticity as separation criterion. The micro-roughness of the surface of the aggregate is significantly higher than bitumen. So the backscattering of emitted light is diffuse in the case of aggregate. In contrast, the surface reflectance characteristics of bitumen after mechanical stress during the rolling process is nearly specular. This difference in backscattering behaviour can be further increased in an image engineering approach by using a light source with a small spectral bandwidth and directional illumination (e.g. a laser).
Figure 5 illustrates this effect quite clearly. The left photograph was taken under daylight and the right under illumination with a laser light diode with a wavelength of 660 nm. In the left image, the gray values of aggregate and bitumen are close together. A safe discrimination between both elements is impossible. In the right image, the difference between the bitumen (specular – dark) and aggregate (diffuse – bright) is much stronger. In both images bright spots are noticeable. These can be found mainly on the border of bitumen and disturb a save classification. The occurrence depends on the surface normal direction and the direction of lightning. When illuminating the scene from different directions, the bright reflection spots will change. A detection is possible when comparing multiple images taken under different illumination directions (figure 6 and figure 7). The marked area shows the principle: The aggregate is bright in both images, the bitumen appears bright in the first and dark in the second image.
By using at least two images with two orthogonal illumination directions the bright spots can be detected. Assuming a unchanged camera position, both images can be fused via minstore-algorithm to obtain a disturbance-free image. Here, in each pixel the lowest value of both images is stored in a minstore-image. The result should be free from any bright spots.
Figure 4: Diffuse illumination: diffuse (aa) vs. specular reflection (ab). Directional lighting: diffuse (ba) vs. specular reflection (bb).
Figure 5: Image of bitumen covered aggregate taken under daylight conditions (left) and illuminated with a laser light diode (right).
Figure 6: Detection of bright spots with different lightning directions (laser line). Left: longitudianal. Right: lateral.
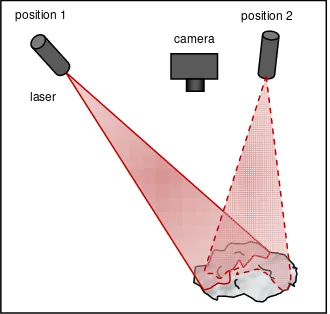
Figure 7: System layout with different illumination directions of the laser line module.
4. PRACTICAL IMPLEMENTATION
In first tests, a monochrome machine 1280x960 pixel vision camera with a frame rate of 15 fps was used. Instead of a laser diode, a laser line module was integrated in the system. First test showed a better illumination performance, thus a better discrimination between bitumen and aggregate could achieved. When using a laser diode, the difference in gray values between bitumen and aggregate were smaller than with a laser line module. One reason is the additional illumination from diffusely reflected (scattered) laser light. In a single image, only a narrow strip is illuminated. Because of that, a sequence of images has to be acquired and fused to a single image via maxstore-algorithm. In each image of a sequence, the gray values of each pixel position are compared. The highest value is then written in a maxstore-image. During image acquisition, the laser module is rotated around an axis. The laser line is moved sequentially over the sample – the scene is virtually scanned (figure 7). As the laser is only used for illumination, it can be moved by hand.
The width of the laser line on the object defines the number of images in the sequence. A full coverage of the object hast to be insured. A narrower laser line has better illumination performance, but more images have to be acquired. In practice, a compromise has to be found between illumination quality and acquisition time. In our tests a width of ~1cm was used. For the detection of reflection spots, a second sequence was acquired with illumination direction orthogonal to the initial direction (figure 7) as outlined in section 3. The position and orientation of the camera remained unchanged to ensure the fusion of the images. The scan can be repeated with extra illumination directions to further increase the discrimination quality.
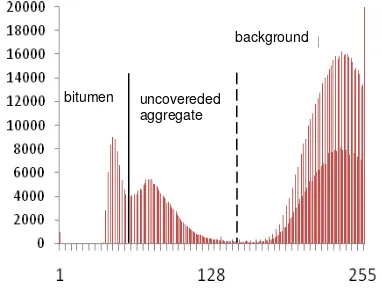
After data acquisition, at least two sequences with different illumination direction exist. In a first step, the individual scan sequences are fused to a single image via maxstore-algorithm. For the detection of reflection spots, both maxstore-images are compared, and the lowest value in each pixel position is then stored in a minstore-image. The resulting image should be free from any image disturbance. The histogram of the minstore-image should be trimodal – with peaks for bitumen, aggregate and background (figure 8). By analysing the histogram, the thresholds between bitumen and aggregate can easily be determined. A threshold operation gives us an image showing the bitumen areas only. In a next step, the background has to be separated from the rest of the image content. This could also be performed in the minstore-image. Due to shadows caused by
position 2
camera
laser position 1
(aa) (ab)
(ba) (bb)
the side illumination of the scene, however, the classification is often falsified. Better results for background separation can be achieved when using images with diffuse illumination (e.g. daylight or light table). From these, a gradient image can be calculated. Enclosed segments represent the single pieces of aggregate. Finally, the bitumen-image and aggregate-segments can be combined in a classification image (figure 9). From the ratio between the classes, the degree of bitumen coverage of the particles can directly be calculated.
Figure 8: Fusion of image sequences.
Figure 9: Histogram of minstore-image.
Figure 10: Classification image with background (red), uncovered aggregate (blue) and bitumen (green).
5. CONCLUSION AND OUTLOOK
The presented approach was evaluated against the probabilistic segmentation method and visual estimation. Because of lack of reference data, the results were checked against manual classified images taken under daylight. In practice, the multi-directional-reflectance-measurement-approach showed several benefits over other tested methods:
simple illumination management high immunity against extraneous light
fast data processing through simple algorithms (real-time-capable)
low error-proneness
independence from aggregate colour
Several improvement measures have to be investigated in further studies:
increase of reliability of image analysis through optimisation of directed lightning (projection angle, width of laser line)
optimisation of image acquisition (automated check of coverage of the whole probe with light, optimisation of necessary number of images)
automation of the threshold operation in minstore-image development of a black-box system with fully automated
lightning
The estimated costs of an operational system are quite low, because no high end components are needed. For imaging, a consumer camera can be used. There are no specific requirements for the line laser too.
Before a final recommendation for the application in building material laboratories can be given, further tests have to be carried out. A validation against a reference sample is crucial. However, the problem of manufacture of such a sample is still unsolved.
Acknowledgement:
The work was performed in cooperation with the Institute of Urban and Pavement Engineering, TU-Dresden. The principle is patented for the author (2/3) and L. Marschke (1/3) under DE102010020622.
bitumen uncovereded
aggregate
background sequence 1
maxstore-image sequence 2
minstore-image
sequence 2
maxstore-image sequence 1
References
EN 12697-11:2005 Bituminous mixtures - Test methods for hot mix asphalt - Part 11: Determination of the affinity between aggregate and bitumen
Grönnige, J., 2008. Computergestützte Auswertung von Rolling-Bottle-Tests, In: Straße und Autobahn 7/2008, pp. 415-419
Morgenstern, A., Schulze, C., Marschke, L., 2010: Verbesserung der Präzision der Prüfung zur Bestimmung des Haftverhaltens zwischen groben Gesteinskörnungen und Bitumen, In: Straße und Autobahn 12/2010, pp. 879-884
Schlesinger, D. & Flach, B., 2008: A Probabilistic Segmentation Scheme, In: Pattern Recognition, LNCS 5096, 2008, pp. 183-192