LIDAR AND VHRS DATA FOR ASSESSING LIVING QUALITY IN CITIES - AN
APPROACH BASED ON 3D SPATIAL INDICES
P. Tompalski, P. Wężyk
Laboratory of Geomatics, Department of Forest Ecology, Faculty of Forestry,
University of Agriculture in Krakow, Poland
–
[email protected]
KEY WORDS: Urban vegetation, ALS, 3D Index, living quality
ABSTRACT:
Modern spatial data acquisition technologies like airborne laser scanning and satellite images can be used to automatically m ap land cover classes. The layers representing spatial extent of various terrain objects are very valuable, especially when the 3D geometrical information stored in the ALS point clouds is taken into consideration. The paper describes a research aimed to develop a way to characterize the urban areas concerning the amount of vegetation and the relation between the vegetated areas and buildings. This relation can be used to characterize the living quality. Two proposed 3D spatial indices describe the relationship between the volume of the high vegetation and volume of buildings (VV2BV) or a relationship between the volume and area of vegetated and built-up areas (UVI). These indices can be calculated for a grid of user-defined cell size or for each building separately. In the second case, a user-defined buffer zone around each building is created to specify the calculation area. The fact that the indices are based on the 3D information, introduces a new method of mapping the urban green space and is suitable for characterizing the living cond itions.
1. INTRODUCTION
The concentration of people in cities brings risks associated with the deterioration of environmental conditions. The growth of cities causes loss of land covered with vegetation, which causes a major threat. It may emerge with water drainage problems, local landslides, or changes of microclimate (temperature rise, humidity decrease). Moreover, concentration of emission sources affects life quality as well. In terms of these threats the role of urban green areas is extremely important. Green contributes to increase the water retention, reduce noise and is a natural pollutants filter. Trees are also playing important role for a man in terms of landscape beauty. Their presence in the cities is therefore needed and the accurate information about their location and spatial attributes is valuable.
Modern geoinformation technologies such as airborne and terrestrial laser scanning (LiDAR) or satellite imagery (VHRS) can now be successfully used for mapping of land cover in urban areas (Höfle and Hollaus, 2010; Rutzinger et al., 2007) and characterizing the vertical structure of vegetation (Ewijk et al., 2009; Hashimoto et al., 2004; Lefsky et al., 2002; Mücke et al., 2010; Wężyk et al., 2008). This information can be then used to evaluate the living conditions of residents in various city districts, or to compare cities to each other. Spatial indices used today are usually based on the area percentage of land cover classes and do not include 3D information such as their vertical dimension (height) or volume. The use of ALS point clouds allows the calculation of additional spatial attributes such as: the volume of high vegetation or single buildings (Hecht et al., 2006; Meinel and Hecht, 2005), in order to define new indices describing the quality of life on given parts of the city.
The aim of presented study was to propose new spatial indices based on 3D data acquired with LiDAR that would be suitable for characterizing urban areas, especially for the assessment of the relation between built-up and green areas.
2. METHODS
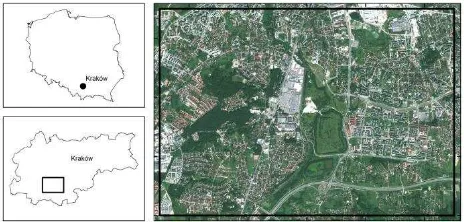
The study was conducted on the test area (3.5×5.0km) located in Krakow (South-East of Poland, population approx. 900 000; area 330 sq km). The area was chosen to represent all land cover classes, including: tall buildings, houses, shopping centers, post- and industrial areas, parks and other green areas.
Figure 1. Localization of study site. Left top: border of Poland, Left bottom: City of Krakow borders, right: GeoEye satellite
image (bands: 321) of the study area.
The dataset consisted of very dense ALS point cloud (approx. 22 pts/m2) and a GeoEye-1 VHRS image (RGB+NIR). The ALS point cloud was a subject of pre-processing in order to deliver raster layers required for further analysis steps. After the classification of the “ground” and point cloud normalization, layers representing: the maximum height of point (nDSM), minimum height of point (nMin) and NoData were generated.
Object Based Image Analysis (OBIA) was used to extract single buildings and homogenous areas of low and high vegetation. The areas with vegetation were classified using NDVI and then splited into “low” and “high” vegetation using geometrical (vertical) information stored in nDSM layer. The building footprints were classified mainly using the nMin layer (normalized minimum height).
International Archives of the Photogrammetry, Remote Sensing and Spatial Information Sciences, Volume XXXIX-B6, 2012 XXII ISPRS Congress, 25 August – 01 September 2012, Melbourne, Australia
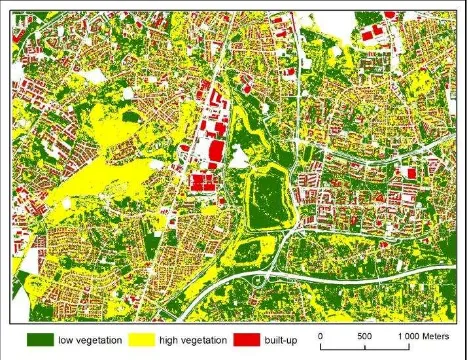
The integration of the geometrical (ALS) and radiometrical (VHRS) information made it possible to achieve high classification accuracy (0.86, Figure 2) and generate segments of vegetation with a similar: height and spectral response. The OBIA processing was performed in eCognition Developer 8.7 (Trimble Geospatial) and created rule-set was very universal and not dependant on any samples. The details of the classification were a subject of different paper (Tompalski and Wężyk, 2011).
The result of the OBIA processing, stored as a vector layer (Shapefile) containing: buildings, low and high vegetation polygons, was subsequently used for batch processing of the ALS point cloud inside each segment. The process was facilitated and automated with the use of LAStools (LAStools, 2011) and FUSION USDA Forest Service software (McGaughey, 2010). Finally, a script written in R software (statistical package) was applied to convert ALS point clouds into voxels (3D matrix) and to calculate all the attributes needed for computing 3D spatial indices.
The volume of each building was calculated as the multiplication of building footprint area and its height. The volume of each homogenous high vegetation class segment was determined using voxels.
Figure 2. OBIA classification result – vector layer representing land cover classes as a base for calculating the spatial indices.
It has to be pointed out, that the above presented method of extracting building, high and low vegetation areas, is probably one of many possibilities of achieving the result. The essential subject of presented paper is not the method of classifying mentioned land cover classes, nor the accuracy of determining the volume of elevated vegetation, but the spatial indices that rely on them. The input vector data can originate from any GIS source, however it has to have the crucial attributes – cubic volume of the high vegetation areas and buildings.
3. 3D SPATIAL INDICES
The general idea of the 3D spatial indices is to present diversity of different city regions concerning the relation between vegetation and buildings.
Two main 3D spatial indices are proposed:
1. Vegetation Volume to Built-up Volume (VV2BV), and
2. Urban Vegetation Index (UVI).
The VV2BV is a ratio of the vegetation cubic volume to the built-up volume and takes into account only the high vegetation class. It can be described with the formula:
(1)
where VHV is the total cubic volume of high vegetation and VB is the total cubature of built-up class. This index can be also calculated as the percentage of high vegetation in the total volume of built-up and high vegetation. In this case the formula is slightly modified:
(2)
The UVI index characterizes not only the high vegetation class and built-up cubature, but also the area of low vegetation. It is calculated as a weighted sum of two ratios: high vegetation volume (VHV) to built-up (VB) volume ratio and vegetation area to built-up area ratio. The relative area of height vegetation and buildings is used as the weight (w, Formula 4):
(3)
(4)
where AV is the total area of all vegetated surfaces (low and high vegetation), AHV is the total area of high vegetation only and AB is the total area of built-up. As in the case of previous index, UVI can be as well calculated in relative values:
(5)
The use of relative area of elevated surface (high vegetation and buildings) is used to split the formula into two parts. The first part is in fact the VV2BV index (Formula 1) and is calculated to express the relation between volume of high vegetation and buildings. The second part is meant to reflect the ratio between the areas that are covered by all vegetation classes (low and high) to the area of buildings.
The proposed 3D spatial indices, in both cases have two types, depending on the object they are calculated for. The first type (VV2BVCELL or UVICELL) is calculated for each grid cell of the study area. The user can specify the cell size (e.g. 100×100m, 1km×1km). In the second type of the index (VV2BVBUILDING or UVIBUILDING) calculated value is assigned to each building polygon and is based on the GIS spatial analysis performed within a certain distance (buffer area) around each building (e.g. 100m, 1km).
International Archives of the Photogrammetry, Remote Sensing and Spatial Information Sciences, Volume XXXIX-B6, 2012 XXII ISPRS Congress, 25 August – 01 September 2012, Melbourne, Australia
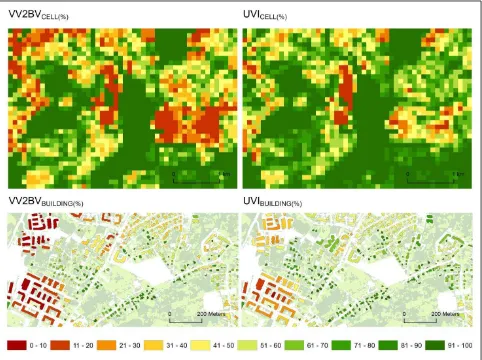
Figure 3. 3D spatial indices calculated for the test area. Top images: VV2BV and UVI indices calculated for 100x100m cell grid, all test area is presented. Bottom images: VV2BV and UVI indices calculated for each building with buffer zone of 100m. Only a subset
of sample area is presented to preserve the details.
In total, each of the two presented indices has four variants, depending on the object they are calculated for (cell/building) and whether they have an absolute or relative value.
The method used to calculate each index can be explained on an example for single cell of 100×100m, where buildings, low and high vegetation cover given area. The simplest example worth considering is when all classes cover 1/3 of the cell area, and buildings and trees have both the same cubic volume. In this case the indices would have values equal to: UVICELL(abs)=1.33, VV2BVCELL(abs)=1, UVICELL(%)=55.56%, VV2BVCELL(%)=50%.
Together with the increase of the building area or volume, the indices values would decrease. Since the volume is taken into consideration, similar index value can be achieved for a cell with many small buildings or with single high building.
4. RESULTS AND DISCUSSION
In order to calculate the indices for the sample area, an ArcGIS (Esri) model builder was used to automate the process. The processing steps differ depending on the index form (whether the index is calculated for a cell or for a building) but in both cases require the same input data – vector layer containing three land cover classes (mentioned before) with the volume attribute stored in the database.
The basic statistics describing the calculated indices for the sample area are presented below. Table 1 contains values for VV2BV and UVI calculated for grid with cell size of 100×100m. Table 2 on the other hand, contains average and standard deviation values for indices calculated in the ‘building’ variant, with a buffer distance of 100m.
VV2BVCELL UVICELL
abs. % abs. %
mean 4.9 47.3 11.1 61.7
std. dev. 20.8 29.2 31.6 25.5
Table 1. Mean and standard deviation values for VV2BV and UVI indices in ‘cell’ variant. Cell size equal to 100m.
VV2BVBUILDING UVIBUILDING
abs. % abs. %
mean 1.8 32.3 3.6 38.0
std. dev. 11.7 31.5 16.7 34.5
Table 2. Mean and standard deviation values for VV2BV and UVI indices in ‘building’ variant. Buffer distance equal to
100m.
International Archives of the Photogrammetry, Remote Sensing and Spatial Information Sciences, Volume XXXIX-B6, 2012 XXII ISPRS Congress, 25 August – 01 September 2012, Melbourne, Australia
The mean value of VV2BVCELL(abs) index equal to 4.9 means, that on average, for each 1m3 of built-up there are almost 5m3 of high vegetation on the analyzed sample area. The relation between vegetation and built-up is even higher for the UVICELL(abs) index, which is caused by the additional parameter of vegetation area included in the formula. The absolute values of mentioned indices calculated in ‘building’ variant, have lower values (VV2BVBUILDING, UVIBUILDING), which can be explained with the fact that buildings are usually located next to each other. Thus the buffer zone created around each building Figure 3) clearly show, where the amount of urban green is low, comparing to the volume of buildings. On the other hand also areas, where the values of the indices are high, are shown and they can be treated as a direct indication of a proper balance between man-made features and valuable vegetated areas.
For the analyzed area, the lowest values for VV2BV and UVI indices occur for the typical areas of tall, 10 storey residential buildings (located on the east part of the study area) and a large shopping centers (middle of the study area). It can be observed, that the VV2BV index has smaller values for areas of high residential buildings than the UVI index, while their values are more similar for the large shopping centers. It can be therefore concluded that the residential area consists of relatively large areas of low vegetation that have an effect of increasing the UVI index value.
5. CONCLUSIONS
In conclusion, presented 3D spatial indices are designed to describe the relations between urban green and built-up areas in cities. The indices express the proportion between the volume of high vegetation (trees) and buildings (VV2BV) and additionally take into account the city areas with low vegetation (UVI) like lawns. In authors opinion the indices are suitable for the basic idea of presented indices is similar to the one described by Schöpfer et al. (2005), however using the ALS point cloud data as the input data, made it possible to use the accurate cubic volume in the calculation, not only the building or vegetation category.
The living conditions of city residents, understood as the amount and vicinity of green areas, are regulated by law in most countries and are also a subject of scientific research (e.g. Urban Audit, 2011). The application of presented 3D spatial indices that allow characterizing the city in terms of the amount of green areas, can be used not only to point out city regions where the mentioned amount is too low, but also to compare cities between each other. These indices can be also applied to characterize the structure of cities and assist planners and developers in making decisions related to new investments, especially in the context of increasing popularity of LiDAR technology (e.g. 100 Polish cities scanned until 2013).
6. REFERENCES
Ewijk, K.Y.v., Treitz, P.M. and Scott, N.A., 2009. Characterizing forest structure using a lidar derived complexity index. In: S. Popescu, R. Nelson, K. Zhao and A. Neuenschwander (Editors), Silvilaser 2009, College Station, Texas, USA.
Hashimoto, H., Imanishi, J., Hagiwara, A. and Morimoto, Y., 2004. Estimating Forest Structure Indices for Evalution of Forest Bird Habitats by an Airborne Laser-Scanner. In: M. Thies, B. Koch, H. Spiecker and H. Weinacker (Editors), Laser-Scanners for Forest and Landscape Assessment, Freiburg, Germany, 03-06 October 2004.
Hecht, R., Meinel, G. and Buchroithner, M., 2006. Estimation of urban green volume-based on last pulse LIDAR data at leaf-off aerial flight times. Proc. Challenges Solutions - 1st Workshop EARSeL Special Interest Group Urban Remote Sens.
Höfle, B. and Hollaus, M., 2010. Urban vegetation detection using high density full-waveform airborne LiDAR data - Combination of object-based image and point cloud analysis In: W. Wagner and B. Székely (Editors), ISPRS Technical Commission VII Symposium, 100 Years ISPRS, Advancing Remote Sensing Science, Vienna, Austria. Vegetation Based on Laser Scan Data at Leaf-Off Aerial Flight Times ISPRS International WG I/2 Workshop 2005: 3D Mapping from InSAR and LiDAR, Banff, Alberta, Canada, 7-10 June, 2005.
Mücke, W., Hollaus, M. and Prinz, M., 2010. Derivation of 3D landscape metrics from airborne laser scanning data, Silvilaser 2010, Freiburg, Germany.
Rutzinger, M., Höfle, B. and Pfeifer, N., 2007. Detection of high urban vegetation with airborne laser scanning data, ForestSAT07, Montpellier.
Schöpfer, E., Lang, S. and Blaschke, T., 2005. A "green index" incorporating remote sensing and citizen's perception of green space. International Archives of Photogrammetry, Remote Sensing and spatial information sciences, Vol. No. XXXVII-5/W1, Tempe, AZ, 1-6.
Tompalski, P. and Wężyk, P., 2011. Kartowanie pokrycia terenów zurbanizowanych przy zastosowaniu klasyfikacji obiektowej zintegrowanych geodanych lotniczego skanowania laserowego oraz zobrazowań geoeye-1. Roczniki Geomatyki, t. 9, z. 2 (46): 121-132.
Urban Audit, 2011. http://www.urbanaudit.org/
Wężyk, P., Tompalski P., Szostak M., Glista M. and Pierzchalski M., 2008. Describing the selected canopy layer parameters of the Scots pine stands using ALS data, 8th international conference on LiDAR applications in forest assessment and inventory. SiliviLaser 2008, Edinburgh, UK, pp. 636-645.
International Archives of the Photogrammetry, Remote Sensing and Spatial Information Sciences, Volume XXXIX-B6, 2012 XXII ISPRS Congress, 25 August – 01 September 2012, Melbourne, Australia