ANALYSIS OF CARBON AND NUTRIENT STORAGE OF DRY TROPICAL FOREST
OF CHHATTISGARH USING SATELLITE DATA
Tarun Kumar Thakur
Department of Environmental Science, Indira Gandhi National Tribal University, Amarkantak, M. P. eMail ID: [email protected]; www.igntu.nic.in
KEY WORDS: Forest dynamics, carbon sequestration, nutrient pattern, RS and GIS
ABSTRACT
The purpose of this study was to characterize the carbon, nitrogen, phosphorus and potassium in the Barnowpara Sanctuary, Raipur district, Chhattisgarh, India through the use of satellite remote sensing and GIS The total storage of nutrients in vegetation (OS+US+GS) varied from 105.1 to 560.69 kg ha-1 in N, 4.09 kg ha-1 to 49.59 kg ha-1 in P, 24.59 kg ha-1 to 255.58 kg ha-1for K and 7310 to 4836 kg ha-1 for C in different forest types. They were highest in Dense mixed forest and lowest in Degraded mixed forest. The study also showed that NDVI and carbon storage was strongly correlated to Shannon Index and species richness thus it indicates that the diversity of forest type play a vital role in carbon accumulation. The study also developed reliable regression model for the estimation of LAI, biomass, NPP, C & N storage in dry tropical forests by using NDVI and different vegetation indices, which can be derived from fine resolution satellite data. The study shows that dry tropical forests of Central India are quite immature and not in standing state and have strong potential for carbon sequestration. Both quantitative and qualitative information derived in the study helped in evolving key strategies for maintaining existing C pools and also improving the C sequestration in different forest types. The study explores the scope and potential of dry tropical forests for improving C sequestration and mitigating the global warming and climatic change.
1.
INTRODUCTION
Tropical forests are one among the rich and complex terrestrial ecosystems store approximately 50% of the worlds living terrestrial carbon and also harbor variety of life forms. They are important both ecologically and economically, and have direct bearing on regulating the biosphere climate and also meeting the diverse needs of biomass. However, during last few decades increased anthropogenic perturbations, over grazing and alarming rates of land transformation caused severe environmental degradation and affected the biogeochemical cycle, biological diversity, productivity and consequently altered the global ecology (King et al., 1997). The quantitative as well as qualitative information on land use pattern and vegetation status are necessary for formulating useful policies for timber harvesting, conserving biodiversity, carbon sequestration, combating environmental hazards and sustainable management of the resources. The data on biomass and forest productivity are scarce in many important tropical forests.
Life-supporting systems on planet earth are facing alarming
threats due to rapid declining of diversity and complexity of living organisms (Stoms and Estes 1993). Chhattisgarh state covered with more than 44% of the geographical area under tropical forests has strong potential for carbon sequestration. However, increased anthropogenic activities have led to degradation of virgin forests in last few decades. According to the recent report published by Forest Survey of India (FSI) on state of forests of India, there is a net loss of 189 km2 of
forests occurred between 2005 and 2011 in Chhattisgarh. Further a fairly good amount (3.5 -5%) of dense forests are converted into open and degraded forests during this period. The amount, rate, and intensity of land use and land cover are very high in the dry tropical forest ecosystems of Chhattisgarh, India. There is a dire need to evolve sustainable land use practices for conserving diversity, enhancing productivity, carbon sequestration and improving biogeochemical cycles. The present study was conducted to analyzed the carbon and nutrients storage of a dry tropical forest ecosystem. Satellite remote sensing and GIS techniques were used for the characterisation of land use, structure, and diversity.
2.
MATERIALS AND METHODS
2.1 Study area
tropical and consists three major seasons: rainy, winter, and summer. The mean annual rainfall of the study area ranges from 1200-1350 mm. The mean annual temperature of the study area is about 26.5 C, which begins to increase in March to May. The highest temperature goes beyond 41.8 C in May and lowest below 12.7 C in December.The soils of the study area are quite variable in their physical and chemical properties and fall three classes, Inceptisols, Alfisols and Vertisols (Soil Survey Staff 1960).
2.2 Materials
IRS ID LISS III cloud-free digital data was procured from the NRSA Data Centre in Hyderabad, India. The data covers the entire study area of Barnowpara and its surrounding environs. Digital analysis was performed on ERDAS Imagine (Version 8.6) Image analysis software and the ancillary data collected from SOI topographical maps was analyzed in ARC-GIS (Version 8.2). The base map was drawn from a survey of India topographical 64 K/7 and 64 K/11 on 1:50,000 scale and used for geometric rectification of satellite data. A reconnaissance survey was made to recognize important vegetation types in different physiographic units and related to the tonal variations on the satellite image for accurate classification.
Stratified random sampling approach was followed for conducting phyto-sociological survey and assessing carbon and nitrogen storages. Ground sampling was done by randomly laying 20 m X 20 m quadrates. The component wise samples viz., foliage, bole, branches and roots were collected and analyzed for total carbon and N, P and K. Nitrogen and carbon pools in vegetation were quantified by multiplying the biomass of each component with their respective N and C concentration of that component. Total vegetation C and N was obtained by adding tree, shrub and herbaceous component.
2.3 Nutrient and C analysis in vegetation
In order to measure the nutrient distribution in different forest types, component samples of trees, shrubs and herbs were randomly collected from five sampling plots (quadrates) of each forest type, which were used in measurement of biomass and net productivity.
2.3.1 Estimation of N, P, and K:In overstorey, the stem, branch, root and foliage components were randomly collected from different trees and crown positions. Similarly, in case of understorey and groundstorey vegetation, shoot, foliage and roots components were collected and dried. Composite samples of each component were prepared in different layers of vegetation and oven dried. The dried samples were ground in Wiley mill and passed through 2 mm sieve to obtain fine powder, which was chemically analyzed in triplicate samples for different nutrients (N, P and K). Nitrogen was determined by Micro-Kjeldhal method (Jackson, 1958). The 0.1g plant sample was digested in 10-ml conc. H2SO4 with catalyst mixture of Na2SO4 and CuSO4 (5:1 by wt.) followed by distillation and titration. The total phosphorous was determined by using spectrophotometer (Olsen et al., 1954) and vando-molybdate yellow reagent procedure. In this
procedure 0.5 gm sample was digested in 10 ml diacid (HNO3 and HClO4 9:4) and then using yellow reagent (Ammonium molybdate+Ammonium meta-vandate + nitric acid) in aliquots. The total potassium was determined by using flame photometer.
2.3.2 Estimation of carbon: Carbon concentration was estimated by ash content method (Negi et al., 2003). In this method oven dried plant components (stem, branch, root and leaves) were burnt in electric furnace at 4000C temperatures. Ash content (inorganic elements in the form of oxides) left after burning was weighed and carbon concentration was calculated by using the following equation
Carbon % = 100-Ash weight + molecular weight of O2 (53.3) in (C6 H12 O6).
2.4 Standing state of nutrients and C in
different forest types
Nutrient (N, P and K) and C storage in different components of tree, shrub and herb layers for each forest were estimated by the product of nutrient/C concentration and their respective biomass values (2003). The component wise nutrient status was computed for different layers of each forest type and extrapolated on Mg ha-1 basis. All the components nutrient/C values were summed to obtain nutrient/C storage. The nutrient content of trees (by components), shrubs, herbaceous layers and fine roots were summed to derive total nutrient status in each sample plot (quadrate) for a given forest type. Mean nutrient content of the five sample plots represented the standing nutrient and C status of a given forest type. In order to obtain the total existing nutrient status of different forest type, the mean nutrient values were multiplied with their respective areas of forest types derived from satellite data. The following expression is used in the present study to quantify the nutrient and carbon status of different forest types
Ty ni = Gni= nutrients in groundstorey of ith forest type
Oni = (Smni +Brni +Lf ni +CRtni+FRTni) FRTni =Fine root nutrients, Wbi=Wood nutrients corresponding to ith forest type
TN= Ty ni + Ty nj + Ty nk ……… Ty nn
TN = Total standing nutrients, Ty ni ..nn=Nutrients in ith, jth, kth ---nth forest types
uptake of different forest types in study area, the mean nutrient uptake values were multiplied with their respective areas of forest types, which were derived from satellite data.
3.
RESULTS AND DISCUSSION
3.1 Total N and C storage in vegetation
Conjunctive use of satellite remote sensing, ground techniques and ecosystem simulation models have strong potential in studying the biogeochemical cycles at large spatial scales. Only limited attempts were made to understand C and N dynamics through conjunctive use of satellite remote sensing and ecosystem simulation models (Verstrate and Pinty, 1991; Melillo et al., 1993). Foody et al (1996) identified terrestrial carbon sinks by classification of successional stages in regenerating tropical forests from Landsat TM data.
The total N and C storage of vegetation (OS+US+GS) varied from 105.1 kg ha-1 to 560.69 kg ha-1 and 7310 kg ha-1 to 4836 kg ha-1in different forest types (Table 1). N storage was highest in Dense mixed forest followed by Sal mixed, Open mixed forest, Teak forest and lowest in Degraded mixed forest. However, C storage was highest in Dense mixed forest and lowest in Degraded mixed forest. N and C contents were statistically at par with each other in Sal mixed and Open mixed forest. Total N and C (OS+US+GS) also varied significantly in different forest types. For total nitrogen, tree, shrub and herb layers contributed 85.13-95.23 %, 1.39-9.04 % and 0.48-1.38 %, respectively. Similarly, for total C storage, overstorey, understorey and groundstorey contributed 81.67-95.02%, 4.69-17.37% and 0.28-0.96%, respectively (Table 1). In India, only few attempts were made in this direction to quantify biomass, carbon storage and flux rates in tropical ecosystems (Jha 1990; Singh and Singh, 1991; Ravan, 1994; Roy et al., 1993; Swamy, 1998). In present study use of satellite data was quite promising in understanding the N, P, K and C distribution.
The present estimates of carbon storage are in much lower in range when compared to the other estimates made in different tropical forests (Brown and Lugo, 1982; Brown et al., 1994; Swamy, 1998; Field and Kaduk, 2004). Brown and Lugo (1982) reported 46 to 183 Mg C ha-1 for variety of tropical dry forests of the world. Similarly, Swamy (1998) observed 94.3 to 190.96 Mg C ha-1 in semi-evergreen forests of Karnataka, India. Brown et al. (1994) also reported 95 to 157 Mg C ha-1 for different tropical forests of Malaysia. The lower carbon storage in dry tropical forests of the present study area was ascribed to presence of poor stand density and relatively lower proportion of trees in higher diameter classes compared to above forests. Moreover, the forests are not fully mature and not in standing state in the study area, whereas they were in standing state and contain a relatively better representation of large size trees resulted in higher carbon storage in other tropical forests.
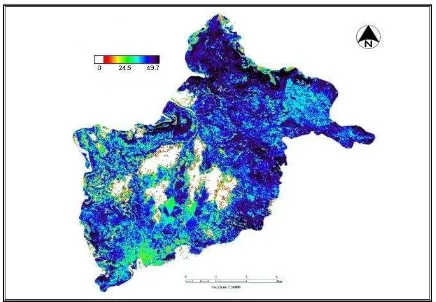
Among several vegetation indices tested, NDVI (Plate 1) is strongly correlated with C and N densities in the forests. This might be due to NDVI is a greenness index, strongly
correlated with biomass, both C and N pools directly depend on the amount of biomass.
Plate 1: NDVI map of the study area
In the present study, the concentration of nutrients (N, P and K) in vegetation followed the order: foliage> branch> root> stem> fine root. Similar trends have been reported by several workers (Feeler, 1980; Chaturvedi and Singh, 1987; Lodhiyal et al., 1995; Lodhiyal and Lodhiyal, (1997).
Table 1: Total N and C content of overstorey, understorey and groundstorey (Kg/ha)
Forest type
Overstorey Understore y
Groundstore y
GT
N C N C N C N C
Teak
forest 360.3 36890 23.46 2880 1.87 115 385.71 39885 Sal
mixed 425.1 29480 36.64 3760 4.2 195 465.93 33435 Dense
mixed 534 45340 23.34 2890 3.39 140 560.69 48370 Open
mixed 390 29600 39.21 4990 4.25 223 433.63 34813 Degrad
ed mixed 89.47 5620 14.16 1650 1.47 73 105.1 7343 CD at
5% 31.47 3.74 10.36 1.44 0.79 0.032 38.15 5.212
3.2 Correlation and regression relationships
between vegetation indices, N and C storage
presented in Figs. 1 and 2. Both C and N storage were significantly correlated to mean NDVI. Among the different vegetation indices, the better regression relationships were observed in NDVI. There was a positive correlation between mean NDVI and C and N storage (pooled data of OS+US) for the study area and all the vegetation types (Plate 2, 3).
Figure 1: Relationship between NDVI and Nitrogen storage
Figure 2: Relationship between NDVI and Carbon storage
Plate 2: Nitrogen Storage map of dry tropical forests (Kg/ha)
Plate 3: Carbon Storage map of dry tropical forests (Mg/ha)
3.3 P and K contents in different
components of Overstorey, understorey and
groundstorey vegetation
Results on P and K contents of different components of Overstorey, understorey and groundstorey vegetation in various forest types are presented in Table 2. Analysis of variance indicated that significant differences in P and K contents were observed in different components of Overstorey, understorey and groundstorey vegetation among forest types. In general, the P and K contents followed the order: stem> branch> foliage> root> fine root. Total P content of vegetation (OS+US+GS) varied from 4.09 kg ha-1 to 49.59 kg ha-1 and K from 24.59 kg ha-1 to 255.58 kg ha-1in different forest types. P and K were highest in Dense mixed forest followed by Teak forest and lowest in Degraded mixed forest. Sal mixed and Open mixed forest was statistically at par with each other for both P and K. Total P and K (OS+US+GS) also varied significantly in different forest types. For total vegetation P, tree, shrub and herbs contributed from 86.55% to 95.62 %, 4.25% to 12.71 % and 0.12 % to 0.73 %, respectively in different forests. Similarly for total K storage, trees, shrubs and herbs contributed from 80.88% to 92.09%, 3.08% to 12.64% and 0.48 % to 1.05%, respectively in different forest types (Table 2).
Table 2: Total Phosphorus and Potassium content of overstorey, understorey and groundstorey (Kg/ha)
Forest type Overstorey UnderstoreyGroundstorey GT
P K P K P K P K
Teak forest 27.56 174.78 2.29 15.63 0.09 0.93 29.94 191.34
Sal mixed 23.37 143.36 2.09 18.54 0.04 1.66 25.50 163.56
Dense mixed 47.42 235.38 2.11 18.09 0.06 2.11 49.59 255.58
Open mixed 24.05 124.61 2.36 18.22 0.04 1.31 26.45 144.14
Degraded
mixed 3.54 19.89 0.52 4.44 0.03 0.26 4.09 24.59
CD at 5% 3.20 3.52 0.07 0.07 0.01 0.01 4.23 5.02
y = 2466.5x - 433.64 R² = 0.6881
0 100 200 300 400 500 600 700 800 900 1000
0.00 0.10 0.20 0.30 0.40 0.50 0.60
Ni
tr
og
en
s
tor
ag
e
(K
g
/h
a)
Mean NDVI Values (All Vegetation types)
y = 2.7126e5.4349x R² = 0.7892
0 5 10 15 20 25 30 35 40
0.00 0.10 0.20 0.30 0.40 0.50 0.60
C
ar
bon
s
tor
ag
e
(M
g
/h
a)
3.4 Carbon sequestration and uptake of N,
P and K in different components of
Overstorey, understorey and groundstorey
vegetation
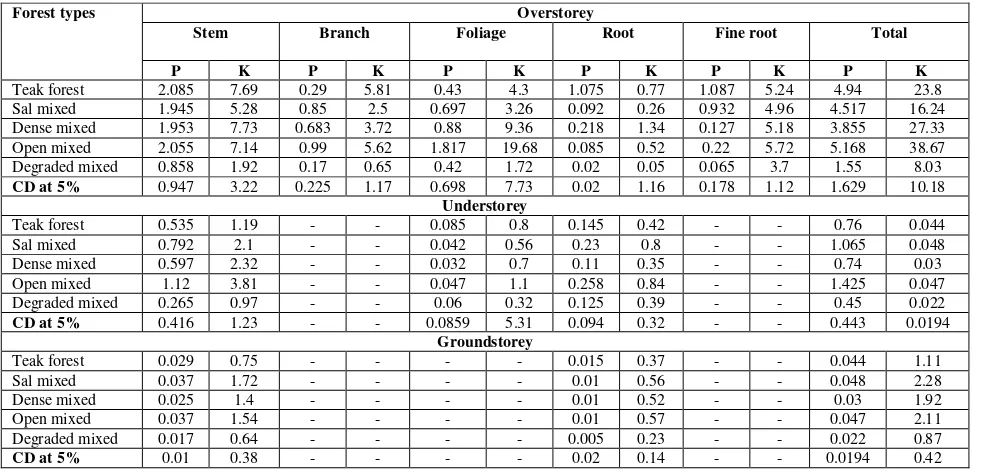
Results on C accretion, N, P and K uptake in different components of Overstorey, understorey and groundstorey in various forest types are presented in Table 3 and 4. C and nutrients uptake varied significantly in different components of Overstorey, understorey and groundstorey among forest types. In general, the N, P, K uptake and C accretion in vegetation followed the order: stem>branch> foliage > fine
root > root. Total N, P, K and C sequestration in vegetation (OS+US+GS) varied from 31.22 to 73.44 kg ha-1yr-1, 2.46 to 6.64 kgha-1yr-1, 10.58 to 46.53 kg ha-1 yr-1 and 1490 to 5910 kg ha-1yr-1 in different forest types (Table 3, 4). Nutrient uptake varied significantly in different forest types. N, P and K were highest in Open mixed forest, while C sequestration in Teak forest. Uptake of N, P and K were lowest in Degraded mixed forest. C sequestration was statistically at par with each other in Teak forest, Sal mixed and Open mixed forest. Overstorey contributed between 64.96-84.44%, 67.48-91.16% and 73.85-87.11%, understorey between 12.14-29.95 %, 8.46-31.30% and 8.82-15.87% and groundstorey between 3.41-7.86 %, 4.06-10.37% and 0.37-0.88% for total vegetation uptake of
Table 3: Uptake of N and C sequestration of overstorey, understorey and groundstorey in dry tropical forests (Kg/ha/yr)
Forest types Overstorey
Stem Branch Foliage Root Fine root Total
N C N C N C N C N C N C
Teak forest 32.58 3160 3.49 230 2.73 260 2.92 1070 6.15 440 47.87 5160
Sal mixed 20.14 1790 7.57 520 3.57 190 1.125 1070 5.84 370 38.245 3940
Dense mixed 24.54 1610 7.56 490 4.39 240 2.17 700 6.28 340 44.94 3380
Open mixed 24.35 1670 9.37 620 7.73 290 0.92 700 8.61 530 50.98 3810
Degraded mixed 9.59 430 2.24 220 2.37 140 0.22 200 4.25 220 17.42 1210
CD at 5% 9.18 0.33 2.12 0.09 2.23 0.08 2.32 0.26 1.166 0.05 13.946 0.55
Understorey
Teak forest 3.97 400 - - 0.227 20 2.445 220 - - 6.65 640
Sal mixed 8.21 780 - - 0.452 20 4.21 320 - - 12.87 1120
Dense mixed 7.47 480 - - 0.405 20 2.75 270 - - 10.63 770
Open mixed 13.28 440 - - 0.58 40 4.41 360 - - 18.28 840
Degraded mixed 6.035 230 - - 0.77 10 2.54 160 - - 9.35 400
CD at 5% 5.16 0.21 0.734 0.01 1.64 0.13 6.25 0.28
Groundstorey
Teak forest 1.34 0.08 - - - - 0.53 0.04 - - 1.87 0.12
Sal mixed 3.08 0.15 - - - - 1.04 0.05 - - 4.12 0.2
Dense mixed 2.46 0.1 - - - - 0.96 0.04 - - 3.42 0.14
Open mixed 3.16 0.17 - - - - 1.02 0.06 - - 4.18 0.23
Degraded mixed 1.12 0.05 - - - - 0.46 0.02 - - 1.59 0.07
CD at 5% 0.742 0.03 - - 0.254 0.02 - 0.79 0.05
Table 4:Uptake of P and K of overstorey, understorey and groundstorey in dry tropical forests (Kg/ha/yr)
Forest types Overstorey
Stem Branch Foliage Root Fine root Total
P K P K P K P K P K P K
Teak forest 2.085 7.69 0.29 5.81 0.43 4.3 1.075 0.77 1.087 5.24 4.94 23.8
Sal mixed 1.945 5.28 0.85 2.5 0.697 3.26 0.092 0.26 0.932 4.96 4.517 16.24
Dense mixed 1.953 7.73 0.683 3.72 0.88 9.36 0.218 1.34 0.127 5.18 3.855 27.33
Open mixed 2.055 7.14 0.99 5.62 1.817 19.68 0.085 0.52 0.22 5.72 5.168 38.67
Degraded mixed 0.858 1.92 0.17 0.65 0.42 1.72 0.02 0.05 0.065 3.7 1.55 8.03
CD at 5% 0.947 3.22 0.225 1.17 0.698 7.73 0.02 1.16 0.178 1.12 1.629 10.18
Understorey
Teak forest 0.535 1.19 - - 0.085 0.8 0.145 0.42 - - 0.76 0.044
Sal mixed 0.792 2.1 - - 0.042 0.56 0.23 0.8 - - 1.065 0.048
Dense mixed 0.597 2.32 - - 0.032 0.7 0.11 0.35 - - 0.74 0.03
Open mixed 1.12 3.81 - - 0.047 1.1 0.258 0.84 - - 1.425 0.047
Degraded mixed 0.265 0.97 - - 0.06 0.32 0.125 0.39 - - 0.45 0.022
CD at 5% 0.416 1.23 - - 0.0859 5.31 0.094 0.32 - - 0.443 0.0194
Groundstorey
Teak forest 0.029 0.75 - - - - 0.015 0.37 - - 0.044 1.11
Sal mixed 0.037 1.72 - - - - 0.01 0.56 - - 0.048 2.28
Dense mixed 0.025 1.4 - - - - 0.01 0.52 - - 0.03 1.92
Open mixed 0.037 1.54 - - - - 0.01 0.57 - - 0.047 2.11
Degraded mixed 0.017 0.64 - - - - 0.005 0.23 - - 0.022 0.87
N, P and K, respectively. Similarly for total vegetation C, Overstorey, understorey and groundstorey contributed between 68.45-87.14%, 10.65-26.84% and 1.86-5.18%,
respectively (Table 3,4). Lodhiyal et al. (2002) studied that
the net uptake of nutrients was 64-117 kg ha-1yr-1 for N,
6-11 kg ha-1yr-1 for P and 29-54 kg ha-1yr-1 for K. An
estimate for net uptake of N, P, K and C accretion in the present study is compared with certain other forests. Estimates of nutrient uptake for tropical humid forests
(Golley et al., 1975) are 136-430 for N, 11-25 for P and
94-255 kg ha-1 yr-1 for K. The mean uptake of nutrients in the
present study for N and P is towards the lower end of the above range while K uptake is distinctly lower compared to values cited above. In general the relative share of shrubs in the total nutrient uptake ranged between 10.65-26.84% and that of herbs between 1.86-5.18%.
The total carbon storage in the present study for different
forest types varied from 6.96 to 47.75 Mg C/ha.. The
estimates of carbon storage of this forests are with in the range and comparable to carbon storage in tropical forests in different localities (Schroeder, 1992; Haripriya, 2000;
Shepherd and Montagnini, 2001; Narris, 2001; He et al.,
biomass and 34.1 Mg C ha-1above ground Carbon storage.
3.5 Turnover of nutrients in standing vegetation
The estimated turnover time of nutrients for trees and shrubs in different forest types are presented in Table 5. The turnover time of different nutrients for overstorey varied from 4.96-11.67 yrs for N, 5.49-14.01 yrs for P, 2.99-12.73 yrs for K and 5.79-13.07 yrs for C. The turnover time for different nutrients in the understorey varied from 1.83-3.65 yrs for N, 2.34-3.82 yrs for P, 2.05-3.39 yrs for K and 2.76-4.67 yrs for C in different forest types.
Table 5: Turnover time for different nutrients in standing vegetation of different forest types (years) characterisation of land use, vegetation structure, biomass production, C and nutrient storage of dry tropical ecosystems of Chhattisgarh, India. The study reflects that dry tropical forests of Chhattisgarh are not ecologically as rich as other dry tropical forests of the world in terms of structure, diversity, biomass, NPP, C, and nutrient (N, P and K) storage. The increasing biotic interferences are degrading these forests and resulting in poor density and also lowering the number of trees in higher diameter classes, consequently affecting the standing biomass and carbon storage in the forests.
5.
REFERENCES
Brown, S. & knight, P. 1994. Assessing Learners in Higher Education, London: Kogan Page.
Brown, S., Lugo A.E., 1982. The storage and production of organic matter in tropical forests and their role in global carbon cycle. Biotrop. 14, 161-187.
Chaturvedi, O.P. and Singh, J.S. 1987. The structure and function of pine forest in central Himalayas. Dry matter
dynamics. Annals of Botany, 60: 237-252.
Feeler, M. C. 1980. Biomass and nutrient distribution in two eucalypt forest ecosystems. Australian Journal of Ecology. 5: 309-333.
Field, C. B. and Kaduk, J. 2004. The carbon balance of an old-growth forest: Building across approaches. Ecosystems, 7:525-533.
Foody, G.M., Paulbinskas, G., Lucas, R.M., Curran, P.J. and Honzak, M. 1996. Identifying terrestrial carbon sinks : classification of successional stages in regenerating tropical
forest from landsat TM data. Remote Sensing of
Environment, 55: 205-216.
FSI, 1995. Extent, Composition, Density, Growing stock and Annual increment of Indian. Forest Survey of India (Ministry of Forests and Environment) Govt. of India Press, Dehradun-248195.
Golley, F. B., J. T. McGinnis, R. G. Clements, G. I. Child &M. J. Duever. 1975. Mineral cycling in a tropical moist forest ecosystem. University of Georgia Press, Athens, Georgia.
Haripriya, G. S. 2000. Estimates or biomass in Indian
He, C, Wang, S., Xu, J. and Zhou, C. 2002. Using remote sensing to estimate the change of carbon storage: A case
study in the estuary of yellow river delta, Int. J. R. S., 23
(8): 1565-1580.
Jackson, M. L. 1958. Soil Chemical Analysis: Prentice-Hall, Englewood Cliffs, N.J., 498 pp.
Jha, C.S. and Singh, J.S. 1990. Composition and dynamics
of dry tropical forest in relation to soil texture. Journal of
Vegetation Science, 1:609-614.
King, A.W., Wilfred, M., Post, M. and Wullschleger, S.D. 1997. The potential response of terrestrial Carbon storage
to changes in climate and atomospheric CO2. Climatic
Change, 35: 199-227.
Lodhiyal, L. S. And Lodhiyal, N. 1997. Nutrient cycling and nutrient use efficiency in short rotation , high density central Himalayan Tarai poplar plantations, Annals of Botany. 79: 517-527.
Lodhiyal, L. S., Singh, R. P. And Sing. P. 1995. Structure and function of an age series of poplar plantations in central Himalayan. II Nutrient dynamics. Annals of Botany. 76:
201-210.
Lodhiyal, N., Lodhiyal, L. S., and Pangtey, Y. P. S., 2002. Structure and function of Shisham forests in Central Himalaya, India: dry matter dynamics. Annals of Botany 89, 41-54.
Melillo, J.M., McGuire, A.D., Kiocklighter, D.W., Moore B III, Vorosmarty, C.J. and Schlolss, A.I.1993. Global climate change and terrestrial Net Primary Production.
Nature, 363: 234-240.
Negi JDS, Chauhan PS & Negi M. 2003. Evidences of climate change and its impact on structure and function of forest ecosystems in and around doon vally. Indian
Forester, 129 (6): 757−769.
Olsen, S.R., Cole, C.V., Watanabe, F.S. and Dean, L.A., 1954. Estimation of available phosphorus in soils by extraction with sodium bicarbonate. USDA Circular 939.
Ravan, S.A. 1994. Ecological analysis of vegetation from satellite remote sensing at Madhav National Park Sivapuri (M.P.). Ph.D. Thesis, HNB Garhwal University, Srinagar, India.
Rawat, Y. S. And Singh, J. S. 1988. Structure and function of oak in central Himalayan. II Nutrient dynamics. Annals of Botany. 62: 413-427.
Roy, P.S., Singh, S. and Porwal, Mc. 1993. Characterization of ecological parameters in tropical forest
community – a remote sensing approach. Journal of Indian
Societyof Remote Sensing, 21(3): 127-148.
Schroeder, P. 1992. Carbon storage potential of short
rotation tropical tree plantations. Forest Ecology and
Management, 50: 31-41.
Shepherd, D. and Montagnini, F. 2001. Above ground carbon sequestration potential in mixed and pure tree
plantations in the humid tropics. Journal of tropical forest
Science, 13(3): 450-459.
Singh, L. and Singh, J.S. 1991. Species structure, dry matter dynamics and carbon flux of a dry tropical forest in
India. Annals of Botany, 68: 263-273.
Soil Survey Staff, 1960. Soil classification. A
comprehensive system- 7th Approximation. Soil
Conservation Services, United State Department of Agriculture. US Government Printing Office, Washington, DC.
Stoms, D. M. and Estes, J. E. 1993. A remote sensing research agenda for mapping & monitoring biodiversity.
International Journal of Remote Sensing, 14: 1839-1860. Swamy, S.L. 1998. Estimation of Net Primary Productivity (NPP) in an Indian tropical evergreen forest using Remote Sensing data. Ph.D. Thesis, Jawaharlal Nehru Technology University, Hyderabad.
Swamy, S.L. and Puri, S. 2002. Growth, biomass, carbon
storage and nutrient distribution in Gmelina arborea Roxb.
Stands on red lateritic soils in central India. Bioresource
Technology.
Verstrate, M.M. and Pinty, B. 1991. The potential contribution of satellite remote sensing to the