Populations of heterotrophic bacteria in an
experimental recirculating aquaculture system
N. Leonard
a, J.P. Blancheton
b,*, J.P. Guiraud
aaUSTL,Laboratoire GBSA,Place E. Bataillon,34000 Montpellier, France bIFREMER,Chemin de Maguelone,34250Pala
6as-Les-Flots, France
Abstract
The aim of this work was to identify the main viable heterotrophic bacteria in a marine fish farm with a recirculating water system and to study their growth dynamics. The experiments were performed with sea bass (Dicentrarchus labrax) in an experimental recircu-lating water system. The bacteria identified were typical of the marine environment:
Pseudomonas, Oceanospirillum, Marinobacter, Paracoccus and Erythrobacter genus from Bergey’s group IV, two genus of Vibrionaceae, one strain of Vibrio and one strain of
Aeromonas. These populations were stable when the ingested feed/replacement water ratio was kept constant. Fixed bacteria formed large biofilms, which released about 104 CFU
ml−1into the tank. The biological filter, with its large surface area, was the largest source
of bacteria in the farm, but the UV disinfection unit kept the number of free bacteria stable. When properly managed, the majority of bacteria that grew on the biological filter were from Bergey’s group IV; no Vibrio were ever detected on it. © 2000 Elsevier Science B.V. All rights reserved.
Keywords:Heterotrophic bacteria; Recirculating aquaculture system; Fish
www.elsevier.nl/locate/aqua-online
1. Introduction
A fish farm using a recirculating water system contains both fish and microbial organisms. The bacterial population comprises both autotrophic and heterotrophic flora (Sich and Van Rijn, 1992; Sugita et al., 1992). The autotrophic population has been well documented but represents only 20% of the total eubacterial rRNA on a
* Corresponding author. Tel.: +33-4-67504100; fax:+33-4-67682885. E-mail address:[email protected] (J.P. Blancheton)
biological filter (Hovanec and Delong, 1996). Very few studies have been conducted on the non-pathogenic heterotrophic populations; those studies that have been published are limited in scope and do not apply to our production systems. However, it would appear that the biological filter does determine bacterial growth (Blancheton and Canaguier, 1995). The aim of the present study was to identify the main viable bacterial groups (both the fixed and the free populations) and to study the stability over time of the number and kind of organisms present at different points in the experimental aquaculture system, with a view to determining the parameters that control bacterial growth. Bacteria were counted using standard cell culture techniques. To increase the number of bacteria which could be grown, a revivification of the bacteria was performed such that only growing and substrate-responsive bacteria were taken into consideration (Peele and Colwell, 1981). The
experiments were performed with sea bass (Dicentrarchus labrax) in an
experimen-tal recirculating water system at the IFREMER station at Palavas.
2. Materials and methods
2.1.Experimental aquaculture system
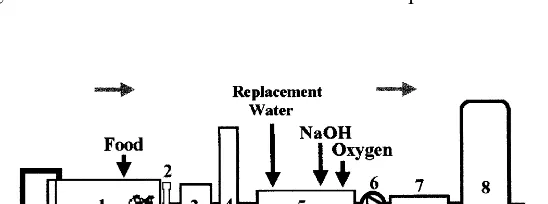
A general diagram of the recirculating water system and the sampling sites used in this study are shown in Fig. 1. This system was described by Blancheton and Cove`s (1993) and its operational characteristics are indicated in Table 1. Total
system volume was approximately 30 m3, and the fish biomass (D. labrax) was
maintained at between 700 and 900 kg. The replacement water flow rate was initially set at 1 m3
h−1
and then varied between 2 and 0.3 m3
h−1 .
2.2.Microbiological analyses
2.2.1. Sampling
Four 500 ml water samples were taken every month once disinfection the sampling valves at the inlet and outlet of each component of the system had been
Table 1
Characteristics of the different components of the recirculation system
Components
Numbers on the Functions Characteristics
Fig. 1
1 Fish tank 2 Rearing tanks 10 m3, 22 m2walls each
tank
2 Particle separa- Feces and uneaten feed collection fecal trap (AquaOptima) tor
Removal of small particles
Mechanical mesh filter
3
filter (60mm)
4 Packed column CO2stripping counter current air/water
packed column Pumping tank pH regulation at 7.6 — replace- 1.5 m3
5
Biological filter 3 m3microporous packing:
8
disinfected and rinsed (Fig. 1). Every month three biofilm samples were taken from the wall of the rearing tank, the pipes and the biological filter. The level of water
in the tank was lowered to allow a 100-cm2
sample of biofilm to be scraped with a sterile blade from the wall of the tank 20 cm below the water surface. In addition,
100 cm2 of biofilm was scraped from a PVC pipe with a sterile blade and another
sample of biofilm was taken from the top of the biological filter packing. The biological filter was systematically back-washed twice a week; sampling was always carried out 1 day after the back-wash.
2.2.2. Re6i6ification and ultrasonic treatment
A 45-min revivification was performed in yeast extract medium (0.3 g l−1) NaCl
(34 g l−1; Kogure et al., 1979; Peele and Colwell, 1981; Singh et al., 1990). The pH
was adjusted to 7.6. In order to remove the biofilm from the filter media and to separate the bacteria aggregates, the sample was given 10-min ultrasonic treatment (20 kHz, 50 W) at the beginning of the revivification. For free bacteria, 10 ml of the sample were mixed with 90 ml of the revivification media; the solid sample was mixed with 200 ml of revivification media.
2.2.3. Enumeration media
Counts of viable heterotrophic bacteria (CFU) were made in Marine Agar (Difco
sodium chloride solution. The revivification step corresponded to the first dilution. Plates were set up in duplicate for each plated dilution.
2.2.4. Growth rate
The average growth rate of the free viable heterotrophic bacteria sampled in the rearing tank was determined in a sea water medium at 25°C. The CFU were evaluated every 2 h. This experiment was performed in duplicate and the results
were expressed as mean9standard deviation.
2.2.5. Identification
Twenty percent of colonies were randomly selected for isolation in a pure culture from plates with between 30 and 300 colonies. The bacteria isolated in pure culture (19 – 24 h) were identified using colony morphology, color, gram stain, bacterial morphology, catalase activity, oxidase activity, respiratory metabolism and vibrio-static O.129 (2,4 Diaamino 6,7 diisopropyl pteridine) resistance. In addition, API 20 NE strips (Biome´rieux, France) were used to identify gram negative bacteria using a medium consisting of yeast extract (0.3 g l−1) and NaCl (30 g l−1). Bacteria were identified according to Bergey’s Manual (Bergey’s Manual of Determinative Bacte-riology, 1994).
2.3.Accuracy of the results
For liquid samples, the data were expressed as means with the 95% confidence limits: mean 91.96(s2/n);s2/nis considered as the variance, 1.96 corresponds to
the Student-t-value for a sampling greater than 30 and a 95% confidence limit,n is
the number of plate counts (Guiraud, 1998). For the solid samples, the analysis was
performed in duplicate and the data expressed as mean9standard deviation. The
bacteria concentration in the biological filter was expressed as CFU per g of wet packing because the surface area of the packing material is not precisely known.
2.3.1. Statistics
Because the variances were not homogeneous and/or the residual departed from
normality, all the data were log transformed prior to statistical analysis. Data were analyzed with one way analyses of variance (ANOVA), with the treatment or the sampling point as the factor. To study the relative importance of each system component in terms of production of bacteria, a Newman – Keuls test was carried out after the ANOVA to group the different sampling points, at an ingested
feed/replacement water ratio of 1 kg m−3. To analyze the influence of fish biomass
3. Results
3.1.Bacterial distribution: general trends
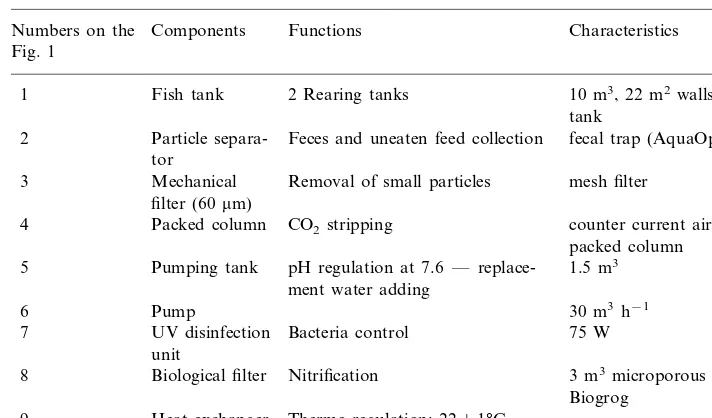
The number of fixed bacteria was relatively constant at all three sampling sites (pipes, rearing tank and biological filter) during the experimental period (Fig. 2).
The average number of CFU in the pipes was 1.1×10792.88×106 cm−2, which
is not significantly different from the average of 1.5×10791.09×107cm−2found
in the rearing tank (F5.3=0.179, P-value=0.68). The average number of CFU in
the biological filter was 7.3×10697.25×106 g−1 of packing.
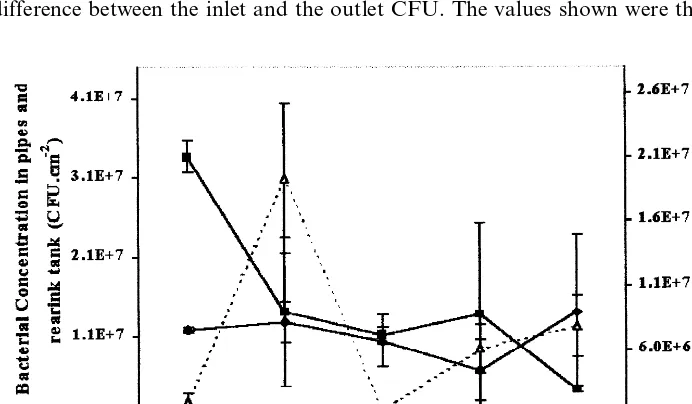
Fig. 3 shows that three levels of heterotrophic free bacteria could be distinguished in the different components of the recirculating water system over a period of 8
months (Newman – Keuls test,PB0.05, after the ANOVAF2.62=16.39,P-value=
4.7×10⁻⁷
): the lowest level was observed at the UV disinfection units outlet (B103 CFU ml−1), an intermediate level at the biological filter inlet (\103CFU
ml−1), situated at a distance of 20 m (PVC pipe) from the disinfection unit, and the
highest level was observed between the biological filter outlet and the UV disinfec-tion units inlet (Fig. 1, Table 1). In this secdisinfec-tion, there was a general tendency for the CFU to increase between the biological filter outlet and the UV sterilizer inlet.
The increase of viable bacteria in the rearing tank, expressed as the difference between the inlet and the outlet (Fig. 4), was not statistically significant, but the
tendency was independent of fish density in the tank (R= −0.435 and P-value=
0.242) for a fixed dilution rate (0.38 kg/m3 of water).
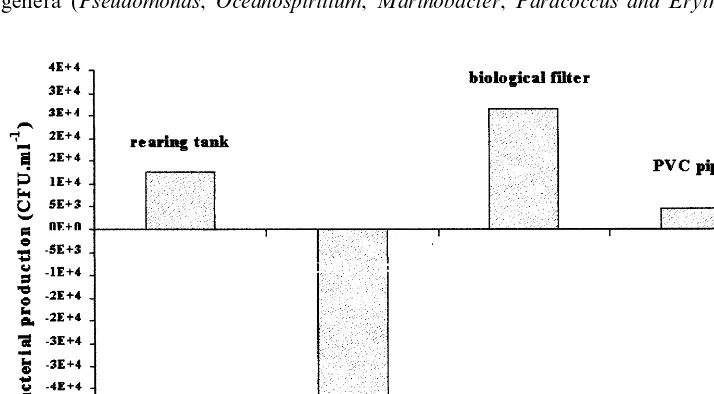
Fig. 5 shows the number of bacteria in each component, expressed as the difference between the inlet and the outlet CFU. The values shown were the means
Fig. 3. Concentration of heterotrophic bacteria in the different components of the recirculating system.
Fig. 4. Relation between the numbers of heterotrophic bacteria in the rearing tank and the fish biomass.
obtained for each sampling spot for a fixed ratio of 0.38 kg of ingested feed per
m−3 of replacement water. The biological filter was the main source of bacteria,
disinfection unit reduced the number of viable heterotrophic bacteria to below 103
CFU ml−1.
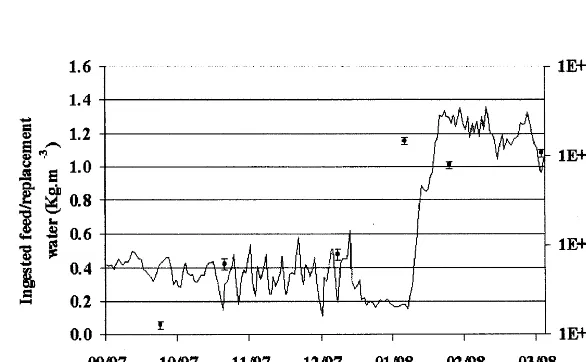
3.2.Influence of replacement water flow rate on bacterial distribution
During a 7-month period the experimental aquaculture system functioned with
three replacement water flow rates (24, 50 and 7 m3/day). The concentration of
bacteria in the biofilter effluent increased from 2.491.2×104 to 7.092.3×104
CFU ml−1 (Fig. 6, ANOVA,F
7.7=8.17, P-value=0.045), and the concentration
of bacteria on the biofilter media increased from 5.193.43×106 to 1.1×1089
3.41×10⁷
CFU g−1
of packing (Fig. 7, ANOVA, F7.7=30.23, P-value=0.005)
when the ratio of the average amount of ingested feed/replacement water flow was
increased from 0.38 to 1.1 kg feed m−3
of fresh water.
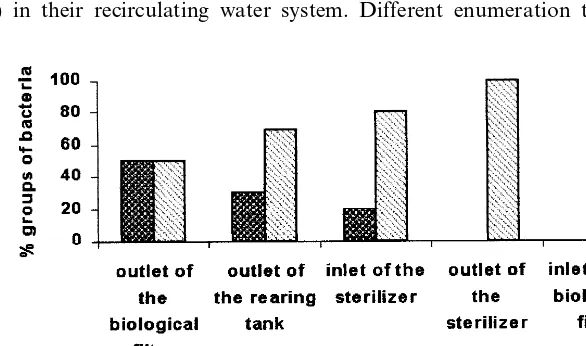
3.3.Identification and generation time
Various biotypes of gram negative rod bacteria were found, some of which differed by only one characteristic. A first group contained strict aerobic or
microaerophilic bacteria from Bergey’s Group IV: Pseudomonas, Oceanospirillum,
Marinobacter, Paracoccusand Erythrobacter. A second group, containing aerobes/
facultative anaerobes, belonged to the Vibrionaceae family: one strain was
iden-tified as Vibrioand another, isolated only once, as Aeromonas. The fixed bacteria
contained all the genera isolated, but the Vibrionaceae constituted up to 20% of the total population. On the other hand, the free bacteria contained only Group IV
genera (Pseudomonas, Oceanospirillum, Marinobacter, Paracoccus and Erythrobac
Fig. 6. Concentration of heterotrophic bacteria in the biofilter effluent and the ratio of ingested feed per replacement water.
Fig. 7. Concentration of heterotrophic bacteria on the biofilter media and the ratio of ingested feed per replacement water.
ter). This situation was consistently observed, except one time (in June, when the
biological filter was clogged) when the Vibrio represented 50% of the total free
population at the biological filter outlet (Fig. 8). The average growth rate at 25°C
was 0.2590.01 h−1 for all the free bacteria, which corresponds to a generation
4. Discussion
The number of bacteria fixed to the surfaces of the tank and the PVC pipes was
approximately constant, with an average of 107viable heterotrophic bacteria (CFU)
per cm2of biofilm. Percival et al. (1998) found 3.6×10² CFU cm−2 on a stainless
steel surface in a drinking water environment. Fera and Prieur (1986) found a biofilm of 107total cells per cm2in sea water for three types of surfaces: aluminum, stainless steel and polycarbonate filters. This value, expressed as the number of
viable bacteria, is equivalent to approximately 104 CFU cm−2 (Kogure et al.,
1979). The higher concentration of bacteria on the biofilm in our rearing system
could be explained either by the slower linear speed of about 1 m s−1
, compared with 0.01 m s−1
in our study, or by the higher nutrient concentration in the rearing
media. Higher numbers of bacteria (up to 1010
cm−2
) have been observed on a biofilm by Ganderson et al. (1992) and Personne´ et al. (1995).
The number of bacteria remained stable at a fixed ingested feed/replacement
water ratio, although the number of bacteria was different in each component of the rearing system (Fig. 3). In accordance with our observations, Sich and Van Rijn (1992) found that the free bacterial populations were not homogeneously
dis-tributed throughout their recirculating water system. Their tilapia (10 kg m−3)
facilities had a denitrifying unit, and they used a settler instead of a mechanical filter. They also had a nitrifying biofilter, but no UV disinfection unit. In their
system, they found a total of 108 bacteria ml−1 (approximately 105 CFU ml−1) in
the tank and the biological filter, which rose to a total of 1010 cells ml−1 in the
denitrifying unit outlet. Korzeniewski and Korzeniewska (1982) found 105 CFU
ml−1
in trout cages. Our values of between 104
and 105
CFU ml−1
are similar to those found in trout cages and are lower than those observed by Sich and Van Rijn (1992) in their recirculating water system. Different enumeration techniques and
enrichment media were used by each of these authors, which makes comparison difficult and approximate. A generation time of 2.7 h was found for the free viable heterotrophic populations. This value is within the normal range for microbial communities observed in biological wastewater treatment systems (Pollard and Grennfield, 1997). This should be compared to 26 h for nitrite bacteria and 60 h for nitrate bacteria (Shilo and Rimon, 1982; Belser, 1984).
The time was too short for free bacteria to grow significantly in number between two consecutive passages through the UV disinfection unit. These results led us to propose that the biofilm at the surface of the biological filter was the main source of bacteria, as already described by Blancheton and Canaguier (1995). This was supported by the identification of the bacteria, which showed that all of the biotypes present in the fixed populations were also represented in the free bacteria in our system. This hypothesis can easily be tested in the tank, where the sites
colonized by the bacteria, the number of bacteria per cm2
and the growth rate were 22 m2, 1.5
×107 CFU cm−2 and 0.25 h−1, respectively. Taking into account the
dilution rate (1.4 h−1) and the average growth rate (0.25 h−1), the increase in the
number of bacteria (1.3×10⁴CFU ml−1) cannot be explained without taking into
consideration the fixed populations. If we consider that the fixed and free bacteria
have a similar growth rate, a fixed population of only 7.5×10⁵CFU cm−2, which
corresponds to only 5% of the biofilm in the tank (1.5×10⁷CFU cm−2), would be
sufficient to explain the increase in the number of free bacteria observed between the inlet and the outlet of the tank. This percentage of dividing bacteria can be seen in biofilms or flocs (Fontana et al., 1992). Hence the biological filter with its large surface area is the main producer of bacteria of the rearing system. The same type of calculation can be made for each component of the system, but the percentage of dividing bacteria varies with the hydraulic characteristics and the colonized surface. Further investigations will be devoted to this phenomenon in order to model each compartment of bacterial growth (biofilms and free populations) as a
function of the ingested feed/replacement water ratio, and the hydraulic and other
physical characteristics of the system. Fish biomass had no influence on the concentration of the principal genera of bacteria (Fig. 4) when the ratio of ingested feed to inflowing replacement water was kept constant: the number of viable free bacteria in our system was stable. When this ratio was increased, the number of free and fixed bacteria also increased (Fig. 6) due to the fact that more nutrients had been provided for the biofilm, increasing its growth rate (Pelmont, 1993) and the number of fixed and free bacteria.
Very little has been published about the kind of bacteria to be found in a recirculating water system; a few studies have looked mainly at the nitrifying or the denitrifying populations. Bergey’s group IV (Bergey’s Manual of Determinative Bacteriology, 1994) is very heterogeneous and contains bacteria commonly found in aquatic environments; they can be both strict aerobic bacteria or microaerophilic
bacteria such as Pseudomonas. In contrast, the Vibrionaceae family contains
populations that can grow under anoxic and anaerobic conditions.Vibriohave been
isolated in freshwater, estuarine and seawater environments, although most of them
pathogenic for man, others are pathogenic for marine vertebrates and invertebrates. This is why conditions, which favor Vibrionaceae growth must be avoided in order to prevent any increase in the risk to the health of the fish in the system. Our results confirmed those of Paat et al. (1989) who found bacteria belonging to genera that
live in aquatic environments (Pseudomonas, Fla6obacterium and Vibrio) in an
experimental carp aquaculture with a recirculating water system. In both of these aquaculture systems, the rearing conditions did not select for a specific bacterial
flora. Only a fewVibriowere ever observed among the fixed bacteria in the pipes,
the tank and the biological filter. The freeVibriopopulations increased in number
when the biological filter was clogged, a situation which gives rise to anoxic areas where anaerobic flora (such as Vibrionaceae rather than the Bergey’s group IV families) are able to grow. The difference in respiratory metabolism explains why Vibrionaceae could become the dominant bacteria when there is a lack of oxygen. When properly managed, the biological filter only released bacteria belonging to Bergey’s group IV. With its large surface area, a large number of free bacteria were able to grow on it (Fig. 5); thus, the accumulation of organic matter and the resulting lack of oxygen or even the formation of anaerobic patches should be avoided.
5. Conclusions
The bacteria found in an experimental sea bass recirculating water system were typical of the marine environment (Bergey’s group IV and some Vibrionaceae).
These populations were stable when the ingested feed/replacement water ratio was
kept constant. Fixed bacteria formed large biofilms, which released about 104CFU
ml−1 of free bacteria into the rearing medium. Most of the fixed bacteria were
found in the biological filter. Because of its large specific surface area, it was the biggest source of bacteria within the system, although the UV disinfection unit kept the number of free bacteria stable. When properly managed, the majority of bacteria that grew on the biological filter were from Bergey’s group IV, although
the growth of large Vibriopopulations was favored by anaerobic conditions.
Acknowledgements
This study was made possible by financial support from the Ministry of
Educa-tion and Research of Luxembourg, with State grant BFR 96/073.
References
Bergey’s Manual of Determinative Bacteriology, 1994. Ninth Edition. Williams & Wilkins, Baltimore, MD, USA.
Blancheton, J.P., Canaguier, B., 1995. Bacteria and particulate materials in recirculating seabass (Dicentratchus labrax) production system. Aquaculture 133, 215 – 224.
Blancheton, J.P., Cove`s, D., 1993. Closed system in intensive marine finfish hatcheries — state of the art and the future prospects. In: Barnarbe´, G., Kestemont, P. (Eds.), Production, Environment and Quality, Bordeaux ’92. European Aquaculture Society, Special publication, 18 EAS, Ghent, Belgium, pp. 87 – 93.
Fera, P., Prieur, D., 1986. Etude expe´rimentale de la colonisation de surfaces par les bacteries, en eau de mer circulantes. In: IFREMER (Ed.). Deuxie`me Colloque International de Bacte´riologie Marine — CNRS, 1 – 5 octobre 1984 IFREMER, Actes de Colloques, Vol. 3. Groupe d’Etude et de Recherche Bacteriologic Marine (GERBAM), Brest, France, pp. 219 – 228.
Fontana, A., Bore, C., Ghommidh, C., Guiraud, P., 1992. Structure and sucrose hydrolysis activity of Saccharomyces cere6isiaeaggregates. Biotechnol. Bioeng. 40 (4), 475 – 482.
Ganderson, L., Chawla, J., Winters, C., Wimpenney, J., Stickler, D., 1992. Scanning electron mi-croscopy of bacteria biofilms on indwelling bladder catheters. Eur. J. Clin. Microb. Infect. Diseases 11, 789 – 796.
Guiraud, J.P., 1998. Microbiologie Alimentaire, 210-210. Ed Dunod, Paris.
Hovanec, T.A., Delong, E.F., 1996. Comparative analysis of nitrifying bacteria associated with freshwa-ter and marine aquaria. Appl. Env. Microbiol. 62 (8), 2888 – 2896.
Kogure, K., Simidu, U., Taga, N., 1979. A tentative direct microscopic method for living marine bacteria. Can. J. Microbiol. 25, 415 – 420.
Korzeniewski, K., Korzeniewska, J., 1982. Changes in the composition and physiological properties of the bacterial flora of water and bottom sediments in Lake Letowo, caused by intensive trout culture. Pol. Arch. Hydrobiol. 29, 671 – 682.
Paat, S., Sugita, H., Sidik, A.S., Sugimoto, Y., Deguchi, Y., 1989. The water quality and microflora of a carp rearing tank with a recirculating water system. Lab. Aquaculture Coll. Agr. Vet. Med. Nihon Univ. 46, 28 – 33.
Peele, E.R., Colwell, R.R., 1981. Application of a direct microscopic method of enumeration of substrate-responsive marine bacteria. Can. J. Microbiol. 27, 1071 – 1075.
Pelmont, J., 1993. Bacteries et Environnement. Adaptation Physiologiques. Presses University, Greno-ble.
Percival, S.L., Knapp, R.J.S., Edyvean, R., Wales, D.S., 1998. Biofilm development on stainless steel in mains water. Water Res. 32 (1), 243 – 253.
Personne´, J.C., Doumergue, C., Jeannot, J.L., Dusart, G., 1995. Etude comparative de la capacite´ de de biomate´rieaux a` supporter la formation de biofilms. In: Tec & Doc (Eds.). Adhesion des Micro-Or-ganismes aux Surfaces. London, pp. 194 – 207.
Pollard, P.C., Grennfield, P.F., 1997. Measuring in situ bacterial specific growth rates and populations dynamics in wastewater. Water Res. 31 (5), 1074 – 1082.
Shilo, M., Rimon, A., 1982. Factors which affect the intensification of breeding in Israel. 2. Ammonia transformation in intensive fish ponds. Isr. J. Aquacult. Bamidgeh 34 (3), 101 – 114.
Sich, H., Van Rijn, J., 1992. Distribution of bacteria in a biofilter-equiped semi intensive fish culture unit. Spe. Publ. Eur. Aquacult. Soc. 17, 55 – 78.
Singh, A., Fei-Peng, Y., McFeters, G.A., 1990. Rapid detection of chlorine-induced bacterial injury by the direct viable count methode using image analysis. Appl. Environ. Microbiol. 56 (2), 389 – 394. Sugita, H., Takayama, M., Ohkoshi, T., Deguchi, Y., 1992. Occurrence of microaerophilic bacteria in
the water and sediment of a grass carp culture pond. Aquaculture 103, 135 – 140.
West, P.A., Colwell, R.R., 1984. Identification and classification ofVibrionaceae — an overview. In: Colwell, R.R. (Ed.), Vibrios in the Environment. Williams and Wilkins, Baltimore, MD.