BIO-OPTICAL DATA INTEGRATION BASED ON A 4D DATABASE SYSTEM
APPROACH
N. N. Imai a , M. H. Shimabukuro a , A. F. C. Carmo a , E. H. Alcântara a , T. W. P. Rodrigues a , F. S. Y. Watanabe a
a São Paulo State University, Postgraduate Program in Cartography Science, Presidente Prudente, São Paulo State, Brazil (nnimai, miltonhs, enner)@fct.unesp.br, (alisondocarmo, twalesza, fernandasyw)@gmail.com
KEY WORDS: Bio-optical Properties, Multi Source Data, 4D Representation, Quality Control, Sensors Data Integration
ABSTRACT:
Bio-optical characterization of water bodies requires spatio-temporal data about Inherent Optical Properties and Apparent Optical Properties which allow the comprehension of underwater light field aiming at the development of models for monitoring water quality. Measurements are taken to represent optical properties along a column of water, and then the spectral data must be related to depth. However, the spatial positions of measurement may differ since collecting instruments vary. In addition, the records should not refer to the same wavelengths. Additional difficulty is that distinct instruments store data in different formats. A data integration approach is needed to make these large and multi source data sets suitable for analysis. Thus, it becomes possible, even automatically, semi-empirical models evaluation, preceded by preliminary tasks of quality control. In this work it is presented a solution, in the stated scenario, based on spatial – geographic – database approach with the adoption of an object relational Database Management System – DBMS – due to the possibilities to represent all data collected in the field, in conjunction with data obtained by laboratory analysis and Remote Sensing images that have been taken at the time of field data collection. This data integration approach leads to a 4D representation since that its coordinate system includes 3D spatial coordinates – planimetric and depth – and the time when each data was taken. It was adopted PostgreSQL DBMS extended by PostGIS module to provide abilities to manage spatial/geospatial data. It was developed a prototype which has the mainly tools an analyst needs to prepare the data sets for analysis.
1. INTRODUCTION
To study about the underwater light field aiming at the development of models for monitoring water quality and to allow bio-optical characterization of water bodies, spatio-temporal data about Inherent Optical Properties (IOP) and Apparent Optical Properties (AOP) are required.
The AOPs are influenced by the angular distribution of the light field and by the amount of the present substances in the water body (Sathyendranath, 2000), for example, the diffuse vertical attenuation coefficient of light (Kd) is an AOP, that is used as a water lightness index (turbidity). Otherwise , the IOPs, the absorption coefficient and the scattering coefficient of the water body, are independent of the angular distribution of the light field and directly dependent of the type and the amount of present substances in the water body (Kirk, 1994). Besides the light fields, the IOPs variations also influence the AOPs (Laanen, 2011).
When light penetrates the water body, it suffers scattering and absorption interactions with the Optical Active Components (OACs) present in the water, and the radiance distribution is modified as it propagates in the aquatic environment. The combination of light scattering and absorption processes reduce the radiance intensity. These attenuations that occur in the water column extension are responsible by the available radiance registered by the sensors .(Bukata et al, 1995). If the absorption and scattering proprieties are known then it is possible to learn how the environment interacts with the water.
The OACs are responsible for the light attenuation, depend on landscape features and comprise the water quality index, including measurements of turbidity, suspended solids, dissolved and particulate organic matter and phytoplankton. An increase in nutrient input and sediment originating from
activities such as agriculture strongly affect the optical properties of water (JULIAN et al, 2013).
For the analysis of AOPs, we can use the data from the TriOS sensors. Furthermore, in situ spectroradiometric measurements are very important for bio-optical characterization and for information extraction from remote sensing data, because they act as a bridge between optical measurements in laboratory and measures taken at the orbital or airborne level. This kind of measure permits the removal of some undesirable effects such as atmospheric influence and the scale effect. To determine the specific IOPs, we can use the AC-S, ECO-BB9 and Hydroscat-6p equipments. Measurements are taken to represent optical properties along a water column, and then the spectral data must be referred to depth. Measurements of how light energy is absorbed and scattered are useful to understand what happens this energy goes through a water body.
Using different types of sensors demands effective methods to allow the integration of data from different sources. Some important aspects must be considered to enable the heterogeneous data set composition from multiple data sources. Such aspects are discussed in the next section.
2. CRITICAL POINTS AND CHALLENGES
The use of different equipments for the data acquisition, in some investigation scenarios, is essential to amplify the analyses and study possibilities about some events. Specifically in aquatic environments there are diverse components related to its characteristics that are highly correlated to other factors, justifying the usage of different types of sensors to collect a vast set of attributes.
related to the IOPs, AOPs and limnological attributes is necessary, allowing studies about the light field behavior in the underwater space. The obtainment of these attributes depends on the different types of sensors, like spectral, photometric, fluorimetric, multiparametric, to list a few. The data set collected by these set of sensors must be integrated to allow multivariate approaches involving the observed quantities.
In our case, five different types of sensors are utilized, which are built by different manufacturers, they held diverse acquisition technology and read different types of parameter. In the Table 1, a summary of the characteristics that each sensor describes is presented: the sensor's manufacturer; the equipment model identification; the type of technology used in the data acquisition; the parameters that can be acquired and the resolution specification of the data sampling. WET Labs ECO BB9 Spectrophotometer Backscattering (b) 9 wavelengths Angle of 117º
Table 1: Summary of the five sensor utilized in our case
Aiming the capability of performing multivariate analysis to explore the correlations between the collected parameters, at each field campaign, the equipment set must be used to guarantee the existence of measurements in the same collecting scenario, considering the spatial and temporal attributes. Besides the operational effort – related to the equipment displacement , operation and installation in field – due the use of diverse instruments, there is an adding difficulty referring to the sequence of campaigns. Once the field campaign has been over, the analyst execute each equipment collected data exportation and starts the processes of integrity validation, corrections enforcement, data normalization and standardization for data integration. Such actions are constantly repeated for each new data gathering and endue some factors that may exacerbate the cost of these process, usually dependent of the manipulation of many digital spreadsheets due to calculus and validation executions or specific software usage for each purpose. Among the important aspects related to the acting of the campaigns and that might interfere in the determined position, previously established during the planning. The historic register aiming the time variability of access conditions alterations; seasonal characteristics; transportation facilities limitations, and others.
Although in the aquatic environment the impossibility of access to the same exact acquisition location is not a relevant aspect that impacts on the data quality – due to the homogeneity of the water body characteristics and its closest neighborhoods –, a special care is necessary for the data management of the sampling locations, once the spatial attributes – related, for example, with latitude and longitude – are not alone enough to allow the identification and the association with other moments of the sampling. In this point of view, create and manage labels to identify the sampling spots related to each step of field data gathering is essential to guarantee posterior integration with other data sets. An spectoradiometers, are capable of measuring quantities represented in different wavelengths The electromagnetic spectrum enables the highlight of determined characteristics in specific moments and intervals, allowing composts identification, factors measurements and attributes obtaining. However, the usage of different equipments composed of diverse sensors, built with many technologies and adopting different patterns, may evidence the possible characteristic that the registers are collected in distinct wave lengths, emphasizing an essential care in the standardization of the collected data aiming the data set integration practicability.
inevitably variable. The fact that the sampling is performed in a movable platform, usually a watercraft, also results in a sensor displacement variation amplification, worsen by the lack of stability of the platform.
The depth attribute is of great significance because it is a parameter directly used for referencing and to realize the link to the data set, since it is real component of the 3D coordinates of the collected data - consisting in horizontal and vertical coordinates . The standardization of data variability with respect to depth and adoption of fixed intervals is essential to allow integration with data sets generated by other sensors to improving the characterization of the overall data structure.
2.4 Multisource Data
The use of different equipments involves factors related to divergence of data sampling that can be minimized or effectively solved from calculations, interpolation and resampling. However, additional difficulty is applied because different instruments use different formats to store the collected data. This variation is due to the difference between the collected data sets, including on the dimensionality of specific software can read the data from the original structure. The use of non-standard data structures increases the dependence on specific resources, affects the flexibility for data processing by alternative means and the automation of processing sequence by other external mechanisms.
Different data sets generated by different processes, stored in different structures, suggests the need for integration of these components so they can help the analysis process by integrating these resources. To enable the integration of different sources, there must be a method of communication that allows the sharing of resources and integration of results. The specification and standards development occurs in several scopes - local, regional, national and international, as it is an important tool that allows the organization of concepts and technical products, such as digital data, and it can add economic, social and legal value to the system (Knoop, 2000).
2.5 Data Management
Each field survey produces a significant amount of data, which are a rich source of information that can be used in different analyzes and studies. Generally, the data produced by the measuring instruments are exported, processed and stored in digital spreadsheets placed in individual files. The data files can be grouped into repositories that meet a certain researchers of small research groups, or, at worst, be stored and used only by that user who conducted the field survey. In this scenario, the infrastructure that meets the organization of files is of fundamental importance to allow the reuse of previously stored data set, in which the difficulty to maintain the data records is increased proportionally as the volume of data grows.
There is a significant global effort and a constant search for the adoption of storage and data management standards and good practices to facilitate interoperability and reusability of data sets (Schmachtenberg et al, 2014). Therefore, it can be applied standards outlined by the Open Geospatial Consortium (OGC) or concepts such as Linked Open Data (LOD), aimed at the construction of identifiers of data sets according to a common and shared data dictionary, enabling the creation of references
between these data sets (Berners-Lee, 2006), and Web of Data (WoD), which describes a unified network formed by the interconnection of heterogeneous data sets (Bizer et al, 2009).
3. DATA INFRASTRUCTURE
The five factors mentioned and discussed in the previous section highlight the need for development resources which make the data suitable for the analysis of large volumes of data from multiple data sources. The first step in applying resources to the reorganization of the data is to understand the information domain for correct understanding of the characteristics of the records. In the scenario of collection of aquatic environments data at different levels of depth, it is possible to identify the three-dimensional relationship for the referencing of data, consisting of identification in the projection plane (horizontal coordinates) incorporated into the location in the water column (depth or vertical coordinate). In addition to the three-dimensional location coordinates, the data can be collected repeatedly at different times, adding the new temporal component in a 4D coordinate system (horizontal coordinates, depth and time).
The data set exploration allows us to understand the characteristics of the dimensions present in the data records. Observing the Table 1, it is possible to note the existence of scalar variables associated with 4D points (like conductivity and temperature) and other vector variables composed by spectral curves (like absorption, attenuation, backscatter, fluorescence, radiance and irradiance), in which each value is related also with the wavelength beyond 4D coordinates.
To amplify the capacity of storing, exploring and processing of the data, we used a Database Management System (DBMS). The existence of spatial attributes in the data set, encourage the adoption of PostgreSQL, extended with the PostGIS geospatial module. Temporal and depth attributes, in present case, are processed as a regular field in the database.
3.1 Proposal For A Dataset Model
To support the definition of the technology to be employed, the data model development was started aiming storage of all data collected in the field, in conjunction with other possible future data sources like data obtained in laboratories, or remote sensing images. The data model should provide the necessary resources to manage the spatial and temporal data, as well as provide flexibility to select and filter the data set.
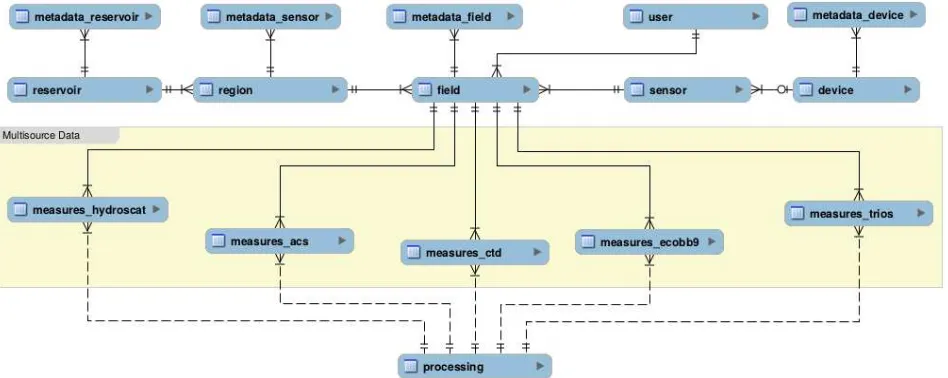
The Figure 1 shows the simplified Entity-Relationship Diagram (ERD) of data model. In this diagram are illustrated all instances that make up the information domain, so that no data produced during the field survey is lost.
The central element named "field", which can be seen as the core of the model presented in Figure 1, concentrates the links with all the other elements and has all attributes related to the execution of the field survey at a certain time (collection point). This entity has references to the time and location of the region of collection, the used equipment and sensors, the operator user who performed the collection, and the link with the measures and collected values.
execution of the collection ("field") and that which identifies the processing applied on each one of the records. The identification processing is performed using the metadata format, and represents an essential information for the user data that needs know about the composition and integrity of the data.
3.2 Prototype Of The Processing System
The data model shown in Figure 1 ensures the storage integrity of information related to the sampling in the field survey, configured as a resource that benefits the organization and management of the data. However, besides of storage specified in the data model, there are a number of processes that must be performed on the collected data to make it prepared for use in analysis. Some validations are useful for identifying spurious data that perhaps have been produced, as an important source of information on data quality. Other corrections are essential to rectify the data, eliminate attenuation and minimize interference. Some calculations can be used to produce other factors which can be obtained from combinations of the stored attributes. In general, the processing step comprises a cycle of operations important that interfere directly on the characteristics of the dataset.
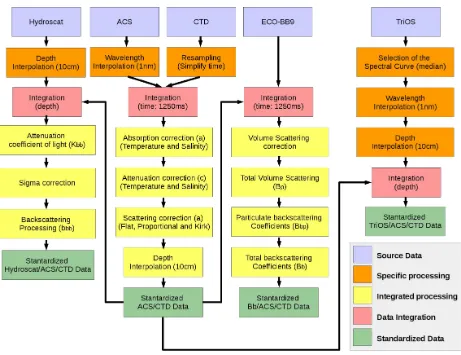
Considering the five sensors to be stored in the database, and described in Table 1, was developed a prototype system capable of performing the necessary parameterization and basic corrections to make integrable and useful data for analysis, as described in the workflow presented in the Figure 2. The prototype provides resources for the analyst automate the process of interpolation, correction, calculation and integration that is always repeated after all the achievements of field surveys and production of new data sets. In Figure 2 can be seen an illustration of the operations flow implemented and carried out during the processing step involving each of the sensors jointly or specific, highlighting the data dependencies generated by other sensors.
The operations types are grouped in Figure 2 and identified by color to describe the processing performed in accordance with the input data, applied functions or output structures. The arrows indicate the direction of execution of the processing as well as the expected and produced data by each processing step.
During processing, some standards are adopted to facilitate the integration of data from different sensors. Depending on the sensor, interpolations are carried out to adjust the sampling rate of some attributes, such as wavelength and depth. All sensors that produce depth-related data are applied the interpolation process for the production values with a resolution of 10cm. The two sensors used that comprise TriOS-Ramses family produce radiance and irradiance data at different wavelengths, so this data are interpolated to be adjusted to the wavelengths of standardized intervals of 1nm.
The other sensors have limited spectral ranges and fixed wavelength, in which the interpolation would not present any benefit.
The data produced by the CTD and ACS sensors can be considered as the core of the processing algorithms, because this data are integrated with all other sensors, to perform corrections and to supplement with other measured parameters. After resampling of wavelengths (1nm) and temporal frequencies (1250ms) of the measures, respectively for ACS and CTD, the set of the two sensors are integrated using the time as a key (sensors working simultaneously) of so that the values of conductivity, temperature and pressure - read by CTD - are incorporated into the absorption parameters (a) and attenuation (c) - taken at different wavelengths by ACS - read at different depths. CTD is also able to estimate the salinity value automatically obtained by calculations using the other parameters.
Once the CTD and ACS data are integrated, some corrections are applied to the absorption and attenuation values. The first correction is performed to remove the effects of temperature and salinity on the absorption coefficients (Eq. 1), and attenuation (Eq. 2) of pure water (WET Labs, 2013).
a
mts=
a
m−[Ψ
t∗(
t
−
t
r)+ Ψ
sa∗
S
]
(1)c
mts=
c
m−[Ψ
t∗(
t
−
t
r)+Ψ
sc∗
S
]
(2)where,
a
mts absorption coefficient corrected for temperature and salinity;c
mts attenuation coefficient corrected for temperature and salinity;a
m absorption measurement;c
m attenuation measurement;Ψ
t corrections of the specific water absorption due to temperature;Ψ
s corrections of the specific water absorption dueto salinity;
t
in situ temperature measurement;t
r reference temperature; andS
salinity measurement.An overestimation of the absorption measurements are motivated by scattered light within a predetermined angle that is lost (WET Labs, 2013). The three most commonly used scattering corrections and have been implemented in this prototype are (De Carvalho, 2015): Flat Method (Eq. 3), Kirk Method (Eq. 4) and Proportional Method (Eq. 5).
a
Flat=
a
mts−
a
mts(λ
r)
(3)a
Kirk=
a
mts−ε∗
b
corr (4)a
t(λ)=
a
mts(λ)−
a
mts(λ
r)
b
m(λ)
b
m( λ
r)
(5)where,
a
Flat absorption coefficient corrected by the Flat method;a
Kirk absorption coefficient corrected by the Kirk method;a
t(λ)
absorption coefficient corrected by theProportional method;
a
mts absorption coefficient corrected for temperature;a
mts( λ
r)
absorption coefficient corrected for temperatureand salinity at a given wavelength;
ε
proportion of the scattering coefficient not detected by the sensor;b
corr subtraction of the absorption coefficient from the attenuation coefficient;a
mts( λ)
absorption coefficient;b
m(λ)
measured scattering coefficient; andb
m(λ
r)
scattering coefficient measured at a particular underestimated due to the attenuation of the sensor light. First, to ensure the integration of the two data sets using the same depth intervals, the Hydroscat measurements are interpolated at a depth of 10cm. After interpolation and integration of the data set, the attenuation coefficient of light that runs the instrument volume, at each wavelength can be calculated (Eq. 6) to be used in the sigma function compensation of the light attenuation of the sensor (Eq. 7) (HOBI-Labs, 2010). Finally, the new corrected backscattering values are obtained fromK
bb attenuation coefficient related to the light that travels from the sensor volume and returns to the detector;a
absorption coefficient;b
attenuation coefficient;σ (
K
bb)
adjustment to improve the backscattering accuracy coming from attenuators environmentsBackscatter measurements taken by the ECOBB9 also depend on the ACS data to be corrected, with the difference that both data sets can be directly integrated by using the time (1250ms) as key. After the integration of the data set, there are a set of equations to be used to correct the ECOBB9 data (WET Labs, 2013). The total volume scattering coefficient can be corrected (Eq. 8) to eliminate the effect of the absorption of the incident beam. The specific volume scattering coefficient of the particles could be calculated (Eq. 9) by extracting the water volume scattering (Morel, 1974). Finally, the particulate backscattering coefficient can be calculated (Eq. 10) to allow achieving total backscattering coefficients (Eq. 11).
β
corr(
117º
)
corrected total volume scatteringcoefficient;
β
meas(
117º
)
measured total volume scatteringcoefficient;
β
p(
117º
)
volume scattering coefficient ofparticles;
β
w(
117º
)
volume scattering coefficient of purewater;
b
bp particulate backscattering coefficient;χ
transformation factor;b
b( λ)
total backscattering coefficients; andb
bw( λ)
backscattering from pure water.The TriOS data set is the only sensor in the model that does not use any data from other sensors to apply corrections. However, the integration parameters for complementation by other sensors is possible by using the depth attribute. The compatibility of the data is applied from interpolations of wavelengths (1nm) and depths (10 cm). Before the interpolations, a single spectral curve shall be selected for each measured depth because the TriOS sensors makes about 15 redundant measurements for each point of collection. To choose the best representative curve, an algorithm based on the application of processing with the median was used (Ferreira, 2014). After choosing the best spectral curve representing the measures taken at each level of depth, the interpolations of data are applied.
4. FINAL CONSIDERATIONS
A data model for spatio-temporal data sets from environmental sensors was designed and implemented to support inland Remote Sensing researches at FCT/Unesp. The integration and standardization of data from different sensors are the main design guidelines for that model, hence this is a suitable solution for data sets from multiple sources scenario. Thus, this approach is adequate to integrate sensors able to produce valuable information related to water constituents, including those ones that were not used in the present study. Another benefit realized by using the prototype implemented is that pre-processing and integration tasks are easy and fast. Therefore, researchers at FCT/Unesp can focus on data quality control and analysis processes due to the optimization provided by automation in data preparation tasks.
ACKNOWLEDGEMENTS
The authors would like to thank the Postgraduate Program in Cartography Science (PPGCC) of the Faculty of Sciences and Technology/São Paulo State University (FCT/UNESP), to FAPESP (Process Nº 2012/19821-1 and Nº 2013/09045-7) and CNPq (400881/2013-6 and 472131/2012-5) for financially support research projects, and CAPES for scholarship.
REFERENCES
BERNERS-LEE, T. Linked data-design issues. URL: http://www.w3.org/DesignIssues/Linked-Data.html, 2006.
BIZER, C.; HEATH, T.; BERNERS-LEE, T. Linked data - the story so far. International Journal on Semantic Web and Information Systems, v. 5, n. 3, p. 1–22, 2009
DE CARVALHO, L. A. S. et al. Implications of scatter corrections for absorption measurements on optical closure of Amazon floodplain lakes using the Spectral Absorption and Attenuation Meter (AC-S-WETLabs). Remote Sensing of Environment, v. 157, p. 123-137, 2015.
FERREIRA, R. M. P. Caracterização da ótica e do carbono orgânico dissolvido no reservatório de Três Marias/MG. 108f.
Dissertação (Mestre em Sensoriamento Remoto). Instituto Nacional de Pesquisas Espaciais, São José dos Campos, 2014.
HOBILABS. HydroScat-6P - Spectral backscattering sensor and fluorometer: user’s manual (revision j). 67p, 2010. Disponível
em:<http://www.hobilabs.com/cmsitems/attachments/3/HS6Ma nualRevJ-2010-8a.pdf>. Access in mar 2014.
JULIAN, J. P.; DAVIES-COLLEY, R. J.; GALLEGOS, C. L.; TRAN, T. V. Optical Water Quality of Inland Waters: A Landscape Perspective. Annals of the Association of American Geographers. v. 103, n. 2, p. 309-318, 2013.
KIRK, J. T. O. Light and photosynthesis in aquatic ecosystems. [S.l.]: Cambridge university press, 1994.
KNOOP, H. International standardization and management of gis-activities. International Archives of Photogrammetry and Remote Sensing, International Society for Photogrammetry & Remote, v. 33, n. B6; PART 6, p. 164–171, 2000.
LAANEN, M. L. et al. Assessment of the scattering by sub-micron particles in inland waters. Journal of the European Optical Society - Rapid publications, Europe, v. 6, nov. 2011.
MOREL, A. Optical properties of pure water and pure sea water. Optical Aspects of Oceanography, N. G. Jerlov and E.S. Neilsen, eds. Academic, New York, pp. 1–24, 1974.
SATHYENDRANATH, S. Remote Sensing of Ocean Colour in Coastal, and Other Optically-Complex, Waters. Reports of the international ocean-colour coordinating group, 2000.
SCHMACHTENBERG, M.; BIZER, C.; PAULHEIM, H. Adoption of the linked data best practices in different topical domains. In: The Semantic Web–ISWC 2014. [S.l.]: Springer, p. 245–260, 2014.
WET LABS, Inc. Scattering Meter ECO BB-9. User’s Guide
(Revision L). 21p. 2013. Disponível em:
<http://wetlabs.com/sites/default/files/documents/bb9l.pdf>. Access in mar 2015.