PROSPECT INVERSION FOR INDIRECT ESTIMATION OF LEAF DRY MATTER
CONTENT AND SPECIFIC LEAF AREA
Abebe Mohammed Ali a, b, Roshanak Darvishzadeha, Andrew K. Skidmorea, Iris van Durena, Uta Heidenc and Marco Heurichd
aFaculty of Geo-Information Science and Earth Observation (ITC), University of Twente, P.O. Box 217, 7500 AE Enschede, The
Netherlands–[email protected] b
Department of Geography, Wollo University, P.O.Box 1145, Dessie, Ethiopia c
Deutsches Zentrum für Luft- und Raumfahrt e.V. (DLR) German Aerospace Center German Remote Sensing Data Center | DFD-LAX | Oberpfaffenhofen | 82234 Wessling | Germany
d
Bavarian Forest National Park, 94481 Grafenau, Germany
KEY WORDS: Rradiative transfer model, PROSPECT, LDMC, SLA
ABSTRACT:
Quantification of vegetation properties plays an indispensable role in assessments of ecosystem function with leaf dry mater content (LDMC) and specific leaf area (SLA) being two important vegetation properties. Methods for fast, reliable and accurate measurement of LDMC and SLA are still lacking. In this study, the inversion of the PROSPECT radiative transfer model was used to estimate these two leaf parameters. Inversion of PROSPECT traditionally aims at quantifying its direct input parameters rather than identifying the parameters which can be derived indirectly from the input parameters. The technique has been tested here to indirectly model these parameters for the first time. Biophysical parameters such as leaf area, as well as fresh and dry weights of 137 leaf samples were measured during a field campaign in July 2013 in the mixed mountain forests of the Bavarian Forest National Park, Germany. Reflectance and transmittance of the leaf samples were measured using an ASD field spec III equipped with an integrating sphere. The PROSPECT model was inverted using a look-up table (LUT) approach for the NIR/SWIR region of the spectrum. The retrieved parameters were evaluated using their calculated R2 and normalized root mean square error (nRMSE) values with the field measurements. Among the retrieved variables the lowest nRMSE (0.0899) was observed for LDMC. For both traits higher R2 values (0.83 for LDMC and 0.89 for SLA) were discovered. The results indicate that the leaf traits studied can be quantified as accurately as the direct input parameters of PROSPECT. The strong correlation between the estimated traits and the NIR/SWIR region of the electromagnetic spectrum suggests that these leaf traits could be assessed at canopy and in the landscape by using hyperspectral remote sensing data.
1. INTRODUCTION
Researchers gain insights on the spatial and temporal distribution of biodiversity, ecosystem services and plant community productivity by quantifying functional diversity in natural communities (Cadotte et al. 2009, Lavorel et al. 2011). Better conservation and restoration decisions can be made by measuring and understanding functional diversity (Cadotte et al. 2011). This realization has underpinned the shift in focus of biodiversity research from species diversity to functional diversity (Tilman 2001).
Like species diversity, functional diversity is quantified on the basis of trait values of organisms (Petchey and Gaston 2006,
Zhang et al. 2012). A trait is any measurable morphological, physiological or phenological feature of an organism (Violle et al. 2007). In plants, a trait is called a functional trait when it affects plant fitness indirectly via its impacts on plant growth, reproduction, and survival (Violle et al. 2007). It is the combination of plant functional traits that determines how plants respond to environmental factors, affect other trophic levels, and influence ecosystem processes and services (Zhang et al. 2012). Traits also provide a link between ecosystem functional diversity and species richness (Carlson et al. 2007,
Gregory 2008). The functional traits are increasingly used to investigate community structure and ecosystem functioning, as well as to classify species into functional types (Smith et al. 1997) or for to validate global vegetation models (Albert et al. 2010).
In general, plant traits can be categorized into: 1) whole-plant traits, 2) stem and belowground traits, 3) regenerative traits and 4) leaf functional traits (Cornelissen et al. 2003). Two fundamental leaf functional traits that are of central interest for researchers are Leaf Dry Matter Content (LDMC) and Specific Leaf Area (SLA) (Wilson et al. 1999, Asner et al. 2011). The LDMC, sometimes referred to as tissue density, is the dry mass of a leaf divided by its fresh mass, commonly expressed in mg/g (Cornelissen et al. 2003). It reflects plant growth rate and carbon assimilation and is a better predictor of location on an axis of resource capture, usage and availability (Wilson et al. 1999). The SLA is defined as the leaf area per unit of dry leaf mass usually expressed in m2/kg (Cornelissen et al. 2003). It is referred to as leaf mass per unit area, as specific leaf mass, as well as leaf specific mass. SLA links plant carbon and water cycles, and provides information on the spatial variation of photosynthetic capacity and leaf nitrogen content (Pierce et al. 1994). According to the latter, “SLA is indicative of plant physiological processes such as light capture, growth rates and life strategies of plants”.
have focused on using hyperspectral data to quantify biochemical and biophysical variables of vegetation, such as chlorophyll content, nitrogen and leaf area index (e.g. Knox et al. 2010, Skidmore et al. 2010, Asner et al. 2011, Laurent et al. 2011). Hyperspectral remote sensing has also been used to map canopy functional and species diversity (Carlson et al. 2007, Papeş et al. 2010) and to estimate biodiversity (simply as the number of species) (e.g. Saatchi et al. 2008, Papeş et al. 2010,
Ruiliang 2011, Féret and Asner 2014). However, directly mapping individual species from remote sensing becomes difficult at larger scales and in ecosystems with very high species variability. An alternative approach to mapping species is to estimate plant functional traits, particularly those found in tree crown leaves, and to use these for assessing and monitoring biodiversity (Carlson et al. 2007).
The methods applied to retrieve plant traits from remote sensing data can be grouped into statistical and physical (Darvishzadeh et al. 2008, le Maire et al. 2008): statistical techniques are used to find a relation between the plant trait measured in situ and its spectral reflectance or some transformation of reflectance. Vegetation indices are widely used in this approach. When hyperspectral data are utilized, it is possible to select the most informative narrow spectrum features from the entire electromagnetic spectrum domain and use them for simple and fast assessment of vegetation properties (Broge and Mortensen 2002). However, statistical methods are known to be site-specific and lack generalization. An alternative is to use a deductive or physical model approach (Radiative Transfer Model (RTM)) inversion, which is based on physical laws. Running an RTM in its direct or forward mode enables the creation of a simulated training database covering a wide range of situations and configurations. This makes RTM inversion approaches more powerful than statistical methods. However, the retrieval of variables through RTMs inversion is ill-posed, since different combination of the input parameters may produce the same spectral signature. To overcome the effect of the ill-posed problem, Combal et al. (2003) recommended the use of prior information. Several studies have reported significant improvement to the accuracy of parameter retrieval after using prior information (e.g. Malenovsky et al. 2006,
Dasgupta et al. 2009); others (Feret et al. 2011, Romero et al. 2012) have tried to exclude unrealistic combinations of input parameters by applying a linear regression equation derived from correlating the input parameters.
Leaf RTMs simulate leaf reflectance and transmittance by using certain input parameters derived from leaves. There are a number of leaf RTMs and each one requires a different number of input parameters. One such widely applied leaf radiative transfer model is PROSPECT (Jacquemoud and Baret 1990) which stands for PROpriétés SPECTrales (French for Spectral Properties). It simulates leaf reflectance and transmittance and is the most popular leaf optical properties model of all those published since 1990 (Jacquemoud et al. 2009).
Although much work has been done on estimating plant traits from remote sensing, the estimation of LDMC and SLA at all scales (i.e. leaf, canopy and landscape) is rare. To our knowledge, the use of remote sensing techniques to estimate LDMC has not yet been tested at any scale. Compared to other biophysical variables, studies conducted on SLA are also limited and have mainly been conducted using statistical methods at a canopy scale. Lymburner et al. (2000) tested several existing vegetation indices in order to estimate SLA from Landsat TM imagery and found a strong correlation
between average canopy SLA and green, red, NIR and MIR reflectance of Landsat TM data. A strong correlation between leaf mass per area and reflectance in the 750 nm to 2,500 nm wavelength range has been also reported for tropical rainforest leaf samples (Asner and Martin 2008, Asner et al. 2011). Normalized indices for leaf mass per area at leaf and canopy scales have been developed only recently, by le Maire et al. (2008) and Feret et al. (2011). However, these indices need to be tested on other images, sites and canopies (le Maire et al. 2008). Physical models, which are supposed to be much more robust than statistical approaches, have not been tested for LDMC and SLA estimations. Our study therefore aimed to investigate how accurately and precisely the LDMC and SLA can be estimated in heterogeneous forests at leaf level by using radiative transfer models, so that the application can be extended to canopy and landscape scales.
2. DATA AND METHODS
2.1. Study area and field data collection
The area chosen for this study was the mixed mountain forest of the Bavarian Forest National Park. It is located in south-eastern Germany along the border with the Czech Republic (490 3’ 19” N, 130 12’ 9” E). Elevation varies from 600m to 1473m above sea level. The climate of the region is temperate, with high annual precipitation (1200 mm to 1800 mm) and low average annual temperature (30 to 60 Celsius). Heavy snow cover is characteristic of the area in winter. The soils in the area are naturally acidic and low in nutrient content (Heurich et al. 2010).
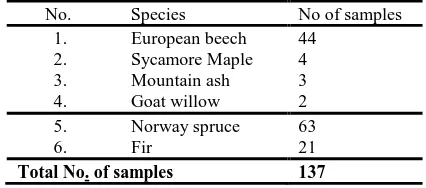
The natural forest ecosystems of the Bavarian Forest National Park vary with altitude: there are alluvial spruce forests in the valleys, mixed mountain forests on the hillsides and mountain spruce forests in the high areas. The dominant tree species include European beech (Fagus sylvatica), Norway spruce (Picea abies) and Fir (Abies alba). In the mixed mountain forests Sycamore maple ( Acer pseudoplatanus L. ), Mountain ash ( Sorbus aucuparia L. ) and Goat willow (Salix caprea) are also found (Heurich and Neufanger 2005).
No. Species No of samples
1. European beech 44
2. Sycamore Maple 4
3. Mountain ash 3
4. Goat willow 2
5. Norway spruce 63
6. Fir 21
Total No. of samples 137
Table 1. Distribution of collected samples, by species.
samples. The shoots of the conifer needles were classified into three needle age classes: current growing period (C), second growing period (C+) and three and more growing periods (C++). The samples were then placed in a zip-locked plastic bag together with wet pulp paper and transported to the laboratory in a portable cooler with frozen icepacks. In the laboratory, the leaf samples were stored in a cold dark room and processed within the day of collection.
2.2. Laboratory measurements
2.2.1. Physical variable measurements: The biophysical characteristics of the samples such as fresh and dry weight and hemispherical surface area were acquired simultaneously with the spectra measurements. The fresh weight of each sample was determined by using a digital scale of high precision. Leaf area of broadleaf samples was measured using the LI-3000C portable leaf area meter. In the case of the conifer needles, the surface of the sample needles was scanned using an HP double lamp desktop scanner at a resolution of 1200 dpi; the needle projections were computed from the greyscale images using ImageJ image processing software (which is freely available online). Norway spruce needles are cylindrical and therefore their total surface was first computed as a projected area multiplied by a universal conversion factor of 2.57 derived experimentally for Norway spruce needles (Waring 1983). Then, the total needle surface area was divided by two to acquire the hemispherical-surface projection of sampled spruce needles. Finally, the samples were oven-dried at 650C for 48 hours and their dry biomass was weighed. The leaf traits were then computed using the sample leaves or needles area, fresh weight and dry weight. The summary statistics of all the measured variables are presented in Table 2.
Basic statistics
Cm (g/cm2)
Cw (g/cm2)
LDMC (mg/g)
SLA (cm2/g) Minimum 0.0034 0.0063 337.3 34.36 Maximum 0.0291 0.0337 598.4 294.09 Mean 0.0140 0.017 455.2 93.45 St. dev 0.0030 0.0032 42.95 24.58
Table 2. Summary statistics of the measured variables in leaf samples. The leaf dry matter content (LDMC), leaf mass per area (Cm), Specific leaf area (SLA) and leaf water content (Cw) were calculated as LDMC = , Cm= , SLA= and
Cw where and stand for a given sample’s fresh weight and dry weight respectively and is sample leaf area. Total number of samples is 137.
2.2.2. Spectral measurements: hemispherical reflectance and transmittance from 350-2500 nm with 1 nm spectral resolution were measured using a FieldSpec ®3 portable spectroradiometer equipped with an integrating sphere manufactured by Analytical Spectral Devices, Inc (ASD), USA. The spectral measurement for each sample was obtained by averaging the spectra on 10 randomly selected leaves in the case of broadleaf species and on 12-16 needles for conifers. Care was taken to avoid large primary and secondary veins during the spectral measurement. In order to minimize the effect of signal variance, two hundred scans were averaged in every spectra measurement to a single spectrum. A calibrated reference standard (with approximately 99% reflectance) was used to convert raw radiance to reflectance.
Whereas the spectral measurement of broadleaf material is straightforward, the spectral measurement of conifer needles is not. This is because the conifer needles are very small and do not cover the sample port of the integrating sphere, which has a port diameter of 15 mm for reflectance and 13.5 mm for transmittance. Therefore, the technique first developed by
Daughtry et al. (1989) and later revised by (Mesarch et al. 1999) was applied to measure the spectral property of the conifer needles. A universal sample holder that could accommodate all lengths of conifer needles was designed, following Malenovsky et al. (2006). Needles were detached from each sample shoot, placed on the sample holder, secured with scotch tape and leaving a space of approximately one needle’s width between needles to avoid multiple reflectance from adjacent needles (Daughtry et al. 1989). The sample holder was carefully placed at the sample port of the integrating sphere, and reflectance and transmittance spectra were acquired following the port configuration procedures of the ASD integrating sphere.
A black painted paper mask with a 15 mm diameter circular aperture was precisely superimposed on the samples and photographs were taken using a 16.1 mega pixel Panasonic DCM-TZ35 camera. Then the gap fraction (GF) between illuminated needles was calculated based on the illuminated area of the sample port, which was 9 mm diameter for both reflectance and transmittance. The illuminated areas of the samples were clipped by drawing a circle of 9 mm diameter at the canter of each picture. The proportion of pixels with gaps between needles was then determined by dividing the number of pixels with gaps into the total number of pixels found in the 9 mm circular aperture area using ImageJ software. Then, the following equations (Eq.1 and 2) were adapted from Mesarch et al. (1999) for the Field spec ASD spectrometer, to compute reflectance and transmittance of the sampled needles.
Reflectance = (1)
Transmittance = (2)
where ρ and τ are measured sample reflectance and transmittance, Rd is stray light (measured in reflectance mode), is reference of sample reflectance, GF is the gap fraction of the sample, and Pw is the reflectance of the integrating sphere wall. Stray light (ambient light) inside the integrating sphere was measured as a radiation flux of the empty illuminated sample port in reflectance mode. The reflectance of the
integrating sphere wall was determined by: PW = where Ftn and Fn are radiance measurements in transmittance and reflectance modes with no sample (Daughtry et al. 1989).
Through visual inspection, spectral measurements in the ranges of 350-400 and 2351-2500 were found to be noisy and were removed from all spectral datasets. The Savitzky–Golay smoothing filter (Savitzky and Golay 1964) with a second order polynomial function and bandwidth of 15 nm was applied, to eliminate random noise within the reflectance and transmittance spectral signatures.
2.3. PROSPECT model simulation
be very laborious. A solution is to use radiative transfer models (RTM) to generate a large spectral dataset incorporating a wide range of parameters and variability. Leaf RTMs simulate leaf reflectance and transmittance properties by using specific input parameters derived from leaves. The most popular RTM for leaf parameters is the PROSPECT leaf optical properties model (Jacquemoud et al. 2009). It idealizes a leaf as a stack of plates composed of absorbing and diffusing constituents. It simulates leaf optical properties (i.e. reflectance and transmittance) parameterized by the following inputs: chlorophyll content (Cab) in µg/cm2, leaf dry mass per unit area (Cm) in mg/cm2, leaf water mass per unit area (Cw) in mg/cm2, and effective number of leaf layers (N) (Jacquemoud and Baret 1990). The model has been widely applied to broadleaf vegetation to estimate chlorophyll content (Zhang et al. 2008, Ma et al. 2012, Rivera et al. 2013). It has also been successfully recalibrated and used to simulate the optical properties of coniferous needles (Malenovský et al. 2008, Morsdorf et al. 2009).The model was revised by Feret et al. (2008) to improve its performance and applicability.
PROSPECT_4 was used to simulate leaf reflectance and transmittance. SLA (cm2/mg) was computed as 1/Cm. Since LDMC is the amount of leaf dry weight per unit of fresh leaf mass, this parameter was derived from Cm and Cw. Equations (3)–(6) show the derivation of LDMC from Cm and Cw:
(3)
(4)
(5)
By reformulating eq.4 and eq. 5 for Wd andWf
(6)
where LDMC is leaf dry matter content in mg/g, Cw is leaf water mass per area in mg/cm2, Cm is leaf dry mass per area in cm2/mg, Wd and Wf are leaf dry and fresh weights in mg and g respectively and A is leaf area in cm2.
Many studies have confirmed that wavelengths in the visible and near infrared region (400-800nm) are highly sensitive to leaf pigments such as chlorophylls and carotenoids, while the shortwave infrared region is the most sensitive region for retrieving parameters related to dry matter(Jacquemoud et al. 1996, Asner et al. 2009, Asner et al. 2011, Romero et al. 2012). Therefore, the spectral region from 800 to 2350 nm was used to retrieve LDMC and SLA.
2.3.1. Generation of look-up tables: Various inversion algorithms can be used to retrieve a given parameter through RTMs. One of the most popular and efficient is the Look-Up Table (LUT) approach (Dasgupta et al. 2009). It involves performing repeated simulations of spectra by using the model with all combinations of the input parameters constrained by reasonable ranges of the input variables. The LUT is then inverted during retrievals.
We followed the general procedures set by Feret et al. (2008) in the LUT generation and inversion. The first step was to determine the structural input parameter N, which was not collected in the field or measured in laboratory. The wavelength-independent parameter N was retrieved for each sample by inverting the model by using simulation at three wavelengths corresponding to maximum reflectance, maximum
transmittance and minimum absorption (Jacquemoud and Baret 1990, Feret et al. 2008). Although leaf structure parameter N corresponds to the number of leaf layers and is most plausible as a whole number, to take account of the subtle variations in leaf structure, N can be considered as a real number with continuous values (Jacquemoud et al. 1996). To start the simulation the maximum and minimum values found in the literature were used for the range of N. Therefore, N was set between 0.5 and 3.0 ( Combal et al. (2003), Malenovsky et al. (2006), Feret et al. (2011)). The structural parameter N was then retrieved using the simulated spectra which best fit the measured spectra of each sample. The search for best simulation was determined by using eq.7 through calculating and finding the lowest root mean square error of an unconstrained non-linear multivariate function (Coleman and Li 1996):
(7)
where n is the number of wavelengths selected (three in this case), are measured values of reflectance and transmittance, and are simulated values of the three wavelengths .
Before using the PROSPECT model for simulation, it may be necessary to calibrate physical and optical constants such as the refractive index and absorption coefficients of leaf material with experimental data (Feret et al. 2008). Thus, forward simulations were first conducted using the retrieved N values and input parameters corresponding to 38 broadleaf and 56 conifer needle samples randomly selected from the total sample. The suitability of the original PROSPECT model had been verified by calculating the RMSE between measured and simulated spectra of the selected samples. The RMSE was within the range of RMSEs documented in the literature. As a result, PROSPECT_4 was applied directly, without calibration, to simulate the spectra of the different types of sample leaves and needles.
To generate the LUTs, the PROSPECT model was run in the forward mode. The maximum and minimum values of the input parameters were set based on prior information (Table 2 and 3). During all simulations, chlorophyll content was arbitrarily set to 40µg/cm2. All possible combinations of the input variables were systematically used to generate LUT records.
2.3.2. Model inversion and validation: The PROSPECT input parameters (N, Cm and Cw) and the two leaf functional traits (LDMC and SLA) were simultaneously retrieved by searching the best matches to the measured spectra in the generated LUT. The LUT was inverted by using the sum of residuals per variance of the input parameters as a constraint in addition to measuring the similarities between the observed and simulated spectra (eq. 8) (Combal et al. 2003, Lauvernet et al. 2008,
Jacquemoud et al. 2009). The estimations of all the variables except structural parameter N were made using all available wavelengths in the NIR and SWIR (801-2350).
(8)
Table 4, and are the variance of the measured reflectance and transmittance respectively and is the variance of the measured input variable j. The estimated parameters were then plotted against the measured leaf trait concentrations and evaluated by means of root mean square error (RMSE); normalized RMSE (nRMSE) was calculated as RMSE divided by the mean of the given variable and coefficient of determination (R2).
3. RESULTS
3.1. Estimation of the structural parameter N and model suitability
Beech Maple Mt. ash
Fir Norway Spruce
C C+ C++ C C+ C++
Mean 1.42 1.43 1.70 1.63 1.69 1.89 1.47 1.50 1.56
Min 1.00 1.20 1.60 1.35 1.45 1.50 1.00 1.15 1.20
Max 1.80 1.60 1.85 2.05 2.00 2.25 2.20 2.10 2.20
St. d 0.16 0.17 0.13 0.23 0.20 0.25 0.28 0.23 0.27
Table 3. Descriptive statistics of the structural parameter N values for sampled trees as retrieved by inversion of the PROSPECT-4 model at three selected wavelengths in the
infrared region.
Figure 3: comparison of minimum, mean and maximum leaf reflectance (left) and transmittance (right) of measured (Mes) and PROSPECT simulated (Sim) spectra for all 137 samples collected in the mixed mountain forests of the Bavarian Forest National Park.
The reflectance and transmittance spectral information at three wavelengths together with corresponding Cm and Cw values were used to define the unknown structural parameter N for each sample. The estimated values of N range from 1 to 2.25. The maximum N value was recorded for the C++ age class of fir tree, while the minimum values were observed in Norway spruce C age class needles and European beech leaves. The average N values were 1.74 for Fir and 1.5 for Norway spruce. Among the broadleaf species, a higher mean value of N (1.7) was observed in Mountain ash (Table 3).
In order to evaluate the suitability of the leaf model, we calculated R2 and the RMSE between measured spectra and the corresponding simulated spectra. The hemispherical reflectance and transmittance measured in laboratory and simulated using the PROSPECT-4 leaf model are illustrated in Figure 3. Both the reflectance and transmittance signatures showed good matching throughout the NIR-SWIR region. Greater disagreement (RMSE close to 3.5%) was observed in the wavelength range from 1900 to 2350 nm (Figure 4) for both reflectance and transmittance. The mean RMSE for both reflectance and transmittance was near 2%. Mean spectral
values also showed the resemblance of the simulated spectra to the measured spectral information. Nevertheless, more deviations between the measured and simulated mean values were observed for reflectance than for transmittance.
Figure 4. Root Mean Square Errors (RMSE) computed between the measured and PROSPECT simulated reflectance and transmittance for the leaf and needle samples.
3.2. Retrieval of traits by inversion and evaluation
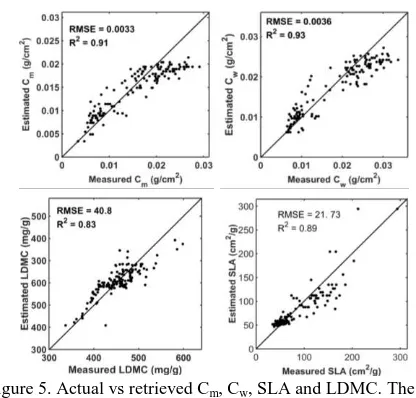
The LUTs were used to search for the matches of all the input variables and the two traits (i.e. LDMC and SLA) using equations 8. In most cases, the lowest nRMSE was observed for LDMC. Despite over estimation of lower and underestimation of higher values in some cases, the retrieved values were close to one to one relationship line with the measured values in the scatter plots (Figure 5). The lowest nRMSE was observed in all samples for LDMC (table 4). In most cases, the correlation coefficient between retrieved and measures SLA was higher than LDMC, but the forecast precision of LDMC is better than that of SLA.
Variable RMSE nRMSE Regression Equation Cm 0.0033 0.2143 y = 0.63x + 0.0047 Cw 0.0036 0.1925 y = 0.72x + 0.0041 SLA 21.73 0.2599 y = 0.77x + 16 LDMC 40.8 0.0899 y = 0.65x + 130
Table 4. Root mean square error (RMSE), normalized RMSE (nRMSE) and regression equations between observed and estimated values of Cm , Cw, SLA and LDMC from inversion of
the PROSPECT model.
Figure 5. Actual vs retrieved Cm, Cw, SLA and LDMC. The solid line shows the1:1 relation.
4. DISCUSSION AND CONCLUSIONS
radiative transfer model. The model’s performance was evaluated for samples from mixed forest. The results indicate that the PROSPECT_4 leaf model accurately simulates spectral information of samples from mixed mountain forests and can be used to retrieve the biochemical content of leaves/needles directly and indirectly through inversion. In some cases, we found higher accuracies for the indirect estimated variables than for the direct input variables of the model, which further supports the reliability of the indirect retrieval approach.
The values of the structural parameter N in fir tree needles of three seasons or older were high compared to the N values of the younger needles. This can be attributed to the lower water content in the older leaves and confirms earlier findings by
Jacquemoud et al. (1996), who stated that for the same species, N estimated on dry leaves is higher than the N estimated for fresh leaves, due to an increase of multiple scattering resulting from the loss of water. Our estimated values of the structural parameter N fit well within the known range (1.0-2.5) for a wide variety of species (Jacquemoud and Baret 1990). However, Malenovsky et al. (2006) found higher values (1.72-2.63) of N for Norway spruce; this might be because of site-specific nature of the parameter. The mean value of 1.42 for beech trees also agrees with the results of Demarez et al. (1999), who studied the seasonal variation of N for selected broadleaf tree species.
The RMSE and range values for Cm were within the range reported by Asner et al. (2011), who estimated the Cm for 2871 samples collected from heterogeneous humid tropical rain forests. However, our estimation of Cm and Cw yielded a relatively less accurate result (RMSE = 0.0032 and 0.0033) for conifer needles than the estimates obtained by Malenovsky et al. (2006), who studied Norway spruce needle samples by using the spectral range of 450-110nm. This is probably because the latter study was on mono species while in our samples there are a couple of conifer species. The high RMSE between the measured and simulated spectra in the SWIRrange (Figure 3) might be also the other cause.
Our results also showed remarkable variation in SLA values between broadleaf and conifer samples. Our estimation of SLA yielded a RMSE value of 21.7 cm2/g, which is close to the results reported by Asner and Martin (2008) (RMSE = 15.05 cm2/g for reflectance and 16.01cm2/g for transmittance). The SLA estimation value of R2 (0.89) also agreed with the results of Lymburner et al. (2000). However, their study was at canopy scale and they used a few bands of the LANDSAT TM satellite image in the NIR and SWIR regions. The high value of nRMSE for SLA, particularly in the unconstrained approach, is attributable to the accumulation of errors during the inversion procedures. In general, the leaf trait LDMC was more accurately estimated than the other variables investigated in this study. One possible reason for such accurate estimate of LDMC could be the relatively smaller errors introduced during LDMC field measurement. It seems to be more challenging to measure Cm, Cw and SLA reliably in the field, partly due to errors related to measuring the area of samples.
The results of the model inversion highlight the reliability and feasibility of using remote sensing data for estimation of leaf traits. The comparison of the spectral-based results of this study with field measurements indicates the potential of remote sensing data to estimate leaf traits over a range of vegetation types. This leaf-level result indicates that leaf traits, especially SLA and LDMC, are quantitatively represented by leaf spectra.
Previous studies focused on the estimation of some or all of the direct input variables from PROSPECT model few bands of the visible and near infrared regions of the spectra. Here we have shown that model inversion from a wide spectral range can provide indirect and direct estimates of multiple leaf traits for mixed mountain forests. Most importantly, this leaf-level analysis offers a basis to test the possible gains and losses incurred in scaling up to the canopy and landscape scale.
In this study we have demonstrated the inversion results from the wavelength range from 801-2350 nm. Inversion based on selected spectral bands (not shown here) does not improve the retrieval accuracy. This is because of the informative nature of the whole shortwave spectral region for estimating variables related to leaf dry matter and thickness. Similar results have been reported in the tropical rain forest when using the soil leaf canopy model (Asner et al. 2009).
The determination of SLA, Cm and Cw requires accurate measurements of leaf area. But the calculation of areas of irregular shape, particularly conifer needles, is prone to error. Errors are introduced – particularly when calculating the area of conifer needle samples – by the shadow effect while scanning samples, while classifying the scanned images to binary format, while rounding off pixels, by the correction factor used and by other procedures. Studies showed that the shape of the Norway spruce needles vary for different age classes and need different conversion factors (Homolova et al. 2013). But we simply used a universal conversion factor from literature which could be source of error. Although it is not possible to avoid all these errors, in future studies efforts should be made to develop simple and fast techniques for computing needle area and for optical property measurement of narrow leaf samples by using the integrating sphere.
In general, our results have confirmed that two important leaf functional traits are measurable with spectral information. This in turn highlights the potential to extend the study to canopy and landscape scales by using advanced hyperspectral airborne and spaceborne sensors.
ACKNOWLEDGMENTS
This study was funded by Nuffic-Netherlands fellowship program. We acknowledge the assistance of Dr Nicole Pinnel in German Remote Sensing Data Center, German Aerospace Center Earth Observation Center (DLR) and Dr. Hooman Latifi in Institute of Geography and Geology, University of Wuerzburg in selecting the test site, and organizing and facilitating the field campaign. Thanks also go to the Bavarian Forest National Parks for approving access to the study area, providing the crossbow with its accessories, and other field and camping facilities.
REFERENCES
Albert, C. H., W. Thuiller, N. G. Yoccoz, A. Soudant, F. Boucher, et al. (2010). "Intraspecific functional variability: extent, structure and sources of variation." Journal of Ecology 98(3): 604-613.
Asner, G. P., R. E. Martin, A. J. Ford, D. J. Metcalfe and M. J. Liddell (2009). "Leaf chemical and spectral diversity in Australian tropical forests." Ecological Applications 19(1): 236-253.
Asner, G. P., R. E. Martin, R. Tupayachi, R. Emerson, P. Martinez, et al. (2011). "Taxonomy and remote sensing of leaf mass per area (LMA) in humid tropical forests." Ecological Applications 21(1): 85-98.
Broge, N. H. and J. V. Mortensen (2002). "Deriving green crop area index and canopy chlorophyll density of winter wheat from spectral reflectance data." Remote Sensing of Environment 81(1): 45-57.
Cadotte, M. W., K. Carscadden and N. Mirotchnick (2011). "Beyond species: Functional diversity and the maintenance of ecological processes and services." Journal of Applied Ecology 48(5): 1079-1087.
Cadotte, M. W., J. Cavender-Bares, D. Tilman and T. H. Oakley (2009). "Using Phylogenetic, Functional and Trait Diversity to Understand Patterns of Plant Community Productivity." Plos One 4(5): e5695.
Carlson, K. M., G. P. Asner, R. F. Hughes, R. Ostertag and R. E. Martin (2007). "Hyperspectral remote sensing of canopy biodiversity in Hawaiian lowland rainforests." Ecosystems 10(4): 536-549.
Coleman, T. F. and Y. Y. Li (1996). "An interior trust region approach for nonlinear minimization subject to bounds." Siam Journal on Optimization 6(2): 418-445.
Combal, B., F. Baret, M. Weiss, A. Trubuil, D. Mace, et al. (2003). "Retrieval of canopy biophysical variables from bidirectional reflectance - Using prior information to solve the ill-posed inverse problem." Remote Sensing of Environment 84(1): 1-15.
Cornelissen, J. H. C., S. Lavorel, E. Garnier, S. Diaz, N. Buchmann, et al. (2003). "A handbook of protocols for standardised and easy measurement of plant functional traits worldwide." Australian Journal of Botany 51(4): 335-380.
Darvishzadeh, R., A. Skidmore, M. Schlerf, C. Atzberger, F. Corsi, et al. (2008). "LAI and chlorophyll estimation for a heterogeneous grassland using hyperspectral measurements." Isprs Journal of Photogrammetry and Remote Sensing 63(4): 409-426.
Dasgupta, S., J. J. Qu and S. Bhoi (2009). "Constrained radiative transfer inversions for vegetation moisture retrievals in grasslands." Journal of Applied Remote Sensing 3.
Daughtry, C. S. T., L. L. Biehl and K. J. Ranson (1989). "A new technique to measure the spectral properties of conifer needles." Remote Sensing of Environment 27(1): 81-91.
Demarez, V., J. P. Gastellu-Etchegorry, E. Mougin, G. Marty, C. Proisy, et al. (1999). "Seasonal variation of leaf chlorophyll content of a temperate forest. Inversion of the PROSPECT model." International Journal of Remote Sensing 20(5): 879-894.
Féret, J.-B. and G. P. Asner (2014). "Mapping tropical forest canopy diversity using high-fidelity imaging spectroscopy." Ecological Applications.
Feret, J. B., C. Francois, G. P. Asner, A. A. Gitelson, R. E. Martin, et al. (2008). "PROSPECT-4 and 5: Advances in the leaf optical properties model separating photosynthetic pigments." Remote Sensing of Environment 112(6): 3030-3043.
Feret, J. B., C. Francois, A. Gitelson, G. P. Asner, K. M. Barry, et al. (2011). "Optimizing spectral indices and chemometric analysis of leaf chemical properties using radiative transfer modeling." Remote Sensing of Environment 115(10): 2742-2750.
Gregory, A. (2008). Hyperspectral Remote Sensing of Canopy Chemistry, Physiology, and Biodiversity in Tropical Rainforests. Hyperspectral Remote Sensing of Tropical and Sub-Tropical Forests, CRC Press: 261-296.
Heurich, M., B. Beudert, H. Rall and Z. Krenova (2010). National Parks as model regions for interdisciplinary long-term ecological research. Long-term Ecological Research. Between Theory and Application. F. Müller, C. Baessler, H. Schubert and S. Klotz. Netherlands, Springer: 327-344.
Heurich, M. and M. Neufanger (2005). Die Wälder des Nationalparks Bayerischer Wald. Ergebnisse der Waldinventur 2002/2003 im geschichtlichen und waldökologischen Kontext. . Grafenau, 178 S.
Homolova, L., P. Lukes, Z. Malenovsky, Z. Lhotakova, V. Kaplan, et al. (2013). "Measurement methods and variability assessment of the Norway spruce total leaf area: implications for remote sensing." Trees-Structure and Function 27(1): 111-121.
Jacquemoud, S. and F. Baret (1990). "Prospect - a Model of Leaf Optical-Properties Spectra." Remote Sensing of Environment 34(2): 75-91.
Jacquemoud, S., S. L. Ustin, J. Verdebout, G. Schmuck, G. Andreoli, et al. (1996). "Estimating leaf biochemistry using the PROSPECT leaf optical properties model." Remote Sensing of Environment 56(3): 194-202.
Jacquemoud, S., W. Verhoef, F. Baret, C. Bacour, P. J. Zarco-Tejada, et al. (2009). "PROSPECT plus SAIL models: A review of use for vegetation characterization." Remote Sensing of Environment 113: S56-S66.
Kattge, J., S. Díaz, S. Lavorel, I. C. Prentice, P. Leadley, et al. (2011). "TRY - a global database of plant traits." Global Change Biology 17(9): 2905-2935.
Kleyer, M., R. M. Bekker, I. C. Knevel, J. P. Bakker, K. Thompson, et al. (2008). "The LEDA Traitbase: A database of life-history traits of the Northwest European flora." Journal of Ecology 96(6): 1266-1274.
Laurent, V. C. E., W. Verhoef, J. G. P. W. Clevers and M. E. Schaepman (2011). "Estimating forest variables from top-of-atmosphere radiance satellite measurements using coupled radiative transfer models." Remote Sensing of Environment 115(4): 1043-1052.
Lauvernet, C., F. Baret, L. Hascoet, S. Buis and F. X. Le Dimet (2008). "Multitemporal-patch ensemble inversion of coupled surface-atmosphere radiative transfer models for land surface characterization." Remote Sensing of Environment 112(3): 851-861.
Lavorel, S., K. Grigulis, P. Lamarque, M. Colace, D. Garden, et al. (2011). "Using plant functional traits to understand the landscape distribution of multiple ecosystem services." Journal of Ecology 99(1): 135-147.
le Maire, G., C. Francois, K. Soudani, D. Berveiller, J. Y. Pontailler, et al. (2008). "Calibration and validation of hyperspectral indices for the estimation of broadleaved forest leaf chlorophyll content, leaf mass per area, leaf area index and leaf canopy biomass." Remote Sensing of Environment 112(10): 3846-3864.
Lymburner, L., P. J. Beggs and C. R. Jacobson (2000). "Estimation of canopy-average surface-specific leaf area using Landsat TM data." Photogrammetric Engineering and Remote Sensing 66(2): 183-191.
Ma, Z. G., X. Chen, Q. Wang, P. H. Li and G. Jiapaerl (2012). "Retrieval of leaf biochemical properties by inversed PROSPECT model and hyperspectral indices: an application to Populus euphratica polymorphic leaves." Journal of Arid Land 4(1): 52-62.
Malenovsky, Z., J. Albrechtova, Z. Lhotakova, R. Zurita-Milla, J. G. P. W. Clevers, et al. (2006). "Applicability of the PROSPECT model for Norway spruce needles." International Journal of Remote Sensing 27(23-24): 5315-5340.
Malenovský, Z., E. Martin, L. Homolová, J.-P. Gastellu-Etchegorry, R. Zurita-Milla, et al. (2008). "Influence of woody elements of a Norway spruce canopy on nadir reflectance simulated by the DART model at very high spatial resolution." Remote Sensing of Environment 112(1): 1-18.
Mesarch, M. A., E. A. Walter-Shea, G. P. Asner, E. M. Middleton and S. S. Chan (1999). "A revised measurement methodology for conifer needles spectral optical properties: Evaluating the influence of gaps between elements." Remote Sensing of Environment 68(2): 177-192.
Morsdorf, F., C. Nichol, T. Malthus and I. H. Woodhouse (2009). "Assessing forest structural and physiological information content of multi-spectral LiDAR waveforms by radiative transfer modelling." Remote Sensing of Environment 113(10): 2152-2163.
Papeş, M., R. Tupayachi, P. Martínez, A. T. Peterson and G. V. N. Powell (2010). "Using hyperspectral satellite imagery for regional inventories: A test with tropical emergent trees in the Amazon Basin." Journal of Vegetation Science 21(2): 342-354.
Petchey, O. L. and K. J. Gaston (2006). "Functional diversity: Back to basics and looking forward." Ecology Letters 9(6): 741-758.
Pierce, L. L., S. W. Running and J. Walker (1994). "Regional-Scale Relationships of Leaf-Area Index to Specific Leaf-Area and Leaf Nitrogen-Content." Ecological Applications 4(2): 313-321.
Rivera, J. P., J. Verrelst, G. Leonenko and J. Moreno (2013). "Multiple Cost Functions and Regularization Options for Improved Retrieval of Leaf Chlorophyll Content and LAI through Inversion of the PROSAIL Model." Remote Sensing 5(7): 3280-3304.
Romero, A., I. Aguado and M. Yebra (2012). "Estimation of dry matter content in leaves using normalized indexes and PROSPECT model inversion." International Journal of Remote Sensing 33(2): 396-414.
Ruiliang, P. (2011). Detecting and Mapping Invasive Plant Species by Using Hyperspectral Data. Hyperspectral Remote Sensing of Vegetation, CRC Press: 447-466.
Saatchi, S., W. Buermann, H. Ter Steege, S. Mori and T. B. Smith (2008). "Modeling distribution of Amazonian tree species and diversity using remote sensing measurements." Remote Sensing of Environment 112(5): 2000-2017.
Skidmore, A. K., J. G. Ferwerda, O. Mutanga, S. E. Van Wieren, M. Peel, et al. (2010). "Forage quality of savannas - Simultaneously mapping foliar protein and polyphenols for trees and grass using hyperspectral imagery." Remote Sensing of Environment 114(1): 64-72.
Smith, T. M., H. H. Shugart and F. I. Woodward (1997). Plant functional types : their relevance to ecosystem properties and global change. Cambridge ; New York, Cambridge University Press.
Tilman, D. (2001). Functional Diversity. Encyclopedia of Biodiversity. A. L. Editor-in-Chief: Simon. New York, Elsevier: 109-120.
Violle, C., M. L. Navas, D. Vile, E. Kazakou, C. Fortunel, et al. (2007). "Let the concept of trait be functional!" Oikos 116(5): 882-892.
Waring, R. H. (1983). "Estimating Forest Growth and Efficiency in Relation to Canopy Leaf-Area." Advances in Ecological Research 13: 327-354.
Wilson, P. J., K. E. N. Thompson and J. G. Hodgson (1999). "Specific leaf area and leaf dry matter content as alternative predictors of plant strategies." New Phytologist 143(1): 155-162.
Zhang, J. T., L. Fan and M. Li (2012). "Functional diversity in plant communities: Theory and analysis methods." African Journal of Biotechnology 11(5): 1014-1022.