Brain N-Acetylaspartate Measures in Patients with
Schizophrenia
Alessandro Bertolino, Joseph H. Callicott, Venkata S. Mattay,
Karin M. Weidenhammer, Rebecca Rakow, Michael F. Egan, and
Daniel R. Weinberger
Background: The specific intracellular effects of
antipsy-chotic drugs are largely unknown. Studies in animals have
suggested that antipsychotics modify the expression of
various intraneuronal proteins, but no analogous in vivo
data in humans are available. The objective of the present
study was to assess whether antipsychotics modify
N-acetylaspartate (an intraneuronal marker of neuronal
functional integrity) measures in brains of patients with
schizophrenia.
Methods: We used proton magnetic resonance
spectro-scopic imaging to study 23 patients with schizophrenia
(DSM-IV diagnosis) using a within-subject design.
Pa-tients were studied twice: once while on a stable regimen
of antipsychotic drug treatment (for at least 4 weeks) and
once while off medication for at least 2 weeks. Several
cortical and subcortical regions were assessed, including
the dorsolateral prefrontal cortex and the hippocampal
area.
Results: Analysis of variance showed that, while on
antipsychotics, patients had significantly higher
N-acetyl-aspartate measures in the dorsolateral prefrontal cortex
(p
5
.002). No other region showed any significant effect
of treatment.
Conclusions: These results indicate that antipsychotic
drugs increase N-acetylaspartate measures selectively in
the dorsolateral prefrontal cortices of patients with
schizophrenia, suggesting that these drugs modify in a
regionally specific manner the function of a population of
cortical neurons. N-Acetylaspartate measures may
pro-vide a useful tool to further investigate the effects of
antipsychotics at the intracellular level. Biol Psychiatry
2001;49:39 – 46 © 2001 Society of Biological Psychiatry
Key Words: Schizophrenia, dorsolateral prefrontal
cor-tex, N-acetylaspartate, typical antipsychotics, atypical
antipsychotics
Introduction
C
onsiderable evidence has accumulated over several
decades that the efficacy of antipsychotic drugs in
patients with schizophrenia involves antagonistic effects at
dopamine D
2receptors (Seeman and Lee 1975). However,
it is also clear that not all therapeutic actions are explained
by D
2receptor blockade. For example, clozapine is an
effective antipsychotic and may have superior efficacy in
treatment-refractory patients with schizophrenia, but it
exerts relatively little D
2antagonism at clinical doses
(Meltzer 1991). It has been proposed that D
2blockade is
only part of a cascade of events that eventually lead to
more fundamental intraneuronal changes (Weinberger and
Lipska 1995). In this regard, experiments in animals have
indicated that antipsychotics modify immediate early gene
expression in a regionally specific fashion (Deutch et al
1992; Dragunow et al 1990; Fink-Jensen and Kristensen
1994; Robertson et al 1994) and, though not binding to
glutamate receptors, change the expression of glutamate
receptor genes (Eastwood et al 1995; Fitzgerald et al 1995;
Lidsky et al 1997; Ulas et al 1993). Therefore, it is
conceivable that the antipsychotic properties of these
drugs ultimately lie in their ability to modify the activity of
specific populations of nondopaminergic neurons
(Wein-berger and Lipska 1995).
Evidence from animal studies of intraneuronal effects
are not easily extended to in vivo human studies. Available
human studies that have explored the brain effects of
antipsychotics have involved electroencephalography or
neuroimaging techniques investigating brain glucose
me-tabolism or cerebral blood flow. These latter studies have
generally shown cortical reductions and subcortical
in-creases in brain metabolism or blood flow consequent to
From the Clinical Brain Disorders Branch, Intramural Research Programs, National Institute of Mental Health, National Institutes of Health, Bethesda, Maryland. AB is currently affiliated with Sezione di Clinica per le Malattie Mentali, Dipartimento di Scienze Neurologiche e Psichiatriche, Universita’ degli Studi di Bari, Bari, Italy.
Address reprint requests to Daniel R. Weinberger, M.D., Clinical Brain Disorders Branch NIMH, 10 Center Drive, Room 4S235 (MSC 1379), Bethesda MD 20892.
Received March 20, 2000; revised July 11, 2000; accepted July 19, 2000.
treatment with antipsychotics (Buchsbaum and Hazlett
1998; Holcomb et al 1996; Miller et al 1997). However,
these techniques have not been able to investigate
neuro-nal-specific events, and the findings are difficult to
inter-pret at the cellular level.
Proton magnetic resonance spectroscopy (
1H-MRS) is
an in vivo assay technique that provides information about
some aspects of brain biochemistry and neuronal function.
It identifies acetyl– containing compounds (mostly
N-acetylaspartate [NAA]), choline-containing compounds
(CHO), and creatine
1
phosphocreatine (CRE). Whereas
CHO and CRE are present in neurons and in glial cells,
NAA is found almost exclusively in neurons and their
processes (Urenjak et al 1993) and in higher
concentra-tions in rat pyramidal glutamatergic neurons (Moffett and
Namboodiri 1995). The precise function of NAA is still
unclear. Although until relatively recently NAA was
referred to as a marker of neuronal structural integrity, a
number of more recent studies have demonstrated that
NAA reductions are reversible, suggesting that NAA is
sensitive to processes affecting the functioning of neurons
(Cendes et al 1997; De Stefano et al 1995; Vion-Dury et al
1995).
Several studies have been performed with
1H-MRS and
1
H-MRS imaging (
1H-MRSI) in schizophrenia to assess
putative neuronal pathology. The majority of these studies
have investigated the hippocampal area and the
dorsolat-eral prefrontal cortex (DLPFC), two anatomic regions long
believed to play an important role in the pathophysiology
of schizophrenia (Goldman-Rakic 1994; Lewis et al 1999;
Weinberger 1999). With some exceptions (Bartha et al
1997; Fukuzako et al 1995; Stanley et al 1996), the large
majority of the experiments have reported NAA
reduc-tions in the hippocampal area and in the DLPFC of
patients with schizophrenia relative to normal control
subjects (Bertolino et al 1996, 1998a, 1998b; Brooks et al
1998; Buckley et al 1994; Callicott et al 1998; Deicken et
al 1997, 1998; Maier et al 1995; Nasrallah et al 1994;
Thomas et al 1998; Yurgelun-Todd et al 1996). Most of
these studies were confounded by the fact that patients
were treated with antipsychotics. However, a few studies
in first-break or in drug-free patients have also found NAA
reductions in the hippocampal area and the DLPFC
(Ber-tolino et al 1998a; Cecil et al 1998; Renshaw et al 1995),
strongly suggesting that the findings are not an
epiphe-nomenon of pharmacologic treatment.
As NAA measures can be affected by various medical
interventions (Cendes et al 1997; De Stefano et al 1995;
Vion-Dury et al 1995), it is conceivable that NAA levels
in the brain may be affected by treatment with
antipsy-chotic drugs. Only three prior studies have attempted to
answer this question. Okumura et al (1959) reported that
30 – 60 days of intraperitoneal administration of
chlor-promazine in rats did not alter NAA levels as measured
with chromatographic analysis of whole brain extracts.
Moreover, Lindquist et al (2000) have shown that,
whereas 7 days of treatment with haloperidol or clozapine
does not cause any change in subcortical NAA levels in
vivo in rats, the same treatment regimen with olanzapine
causes small reductions of NAA in the same brain region.
However, neither of these studies addressed the possibility
that antipsychotic drugs could affect specific populations
of neurons and, thus, regionally specific NAA levels.
Recently, Heimberg et al (1998) reported higher NAA
levels in the frontal lobe of patients treated with atypical
antipsychotics versus patients on typical antipsychotics.
However, these results depended upon a between-subjects
study design and, therefore, may not reflect drug-specific
effects.
The purpose of this study was to assess whether
treatment with antipsychotic medications affects NAA
levels in patients with schizophrenia. In particular, we
hypothesized that antipsychotics might change NAA
lev-els in the hippocampal area and DLPFC, regions in which
previous studies have reported NAA reductions in
schizo-phrenia. We used a within-subject design that is well
suited to address this question.
Methods and Materials
Subjects
Twenty-three patients (18 male and three female; age [mean6
SD] 5 36.9 6 8.1 years) who met DSM-IV criteria for schizophrenia and had been chronically ill (illness duration 5
(mean6SD5511.26930.2 days). Table 1 provides further clinical details about the patients studied, including the antipsy-chotics with which they were treated. To avoid order effects, seven of the patients received the first scan while off drugs and the remaining while on drugs. Four patients who had received the on-drugs scan first received a third scan (again on drugs for at least 2 weeks [mean 486 36 days] after they had been drug free). Therefore, these four patients received three scans in the following order: on, off, on. The drug-free data of six patients have been reported in a previous article (Bertolino et al 1998a). Psychopathology of each subject was also assessed at the two time points by means of the Scale for the Assessment of Negative Symptoms (Andreasen 1989) and the Positive Symptoms Assess-ment Scale (Bigelow and Berthot 1989).
1
H-MRSI Procedure
The same1
H-MRSI procedure was used for all the scans. Proton magnetic resonance spectroscopy imaging was performed on a GE-SIGNA 1.5-T MR scanner (GE Medical Systems, Milwau-kee) as in earlier reports (Bertolino et al 1996; Duyn et al 1993). The 1
H-MRSI slices were positioned parallel to the sylvian fissure and encompassing the hippocampal formation as visual-ized on T1-weighted MRI scans (Spin Echo, repetition time [TR] 5500 msec, echo time [TE]512 msec). Briefly, the1
H-MRSI sequence involves a spin echo slice selection with TR of 2200 msec and TE of 272 msec and includes suppression of water and most of the signal arising from lipids in the skull marrow and in surface tissues (outer volume saturation; Duyn et al 1993). Phase encoding procedures were used to obtain a 323 32 array of spectra from volume elements in each selected slice. Each volume element (“voxel”) had nominal dimensions of 7.5 mm3
7.5 mm315 mm (0.84 mL). Actual volume, based on full width at half maximum after filtering of k-space, was 1.4 mL (Duyn et al 1993). The filter was a radial cosine filter starting at half-maximum radius. At the end of each 1
H-MRSI scan a second T1-weighted MRI scan was acquired at the same level as the first.
This further scan was used for visually checking for gross motion that may have intervened during the1
H-MRSI scan.
To produce metabolite maps, location and integration of the signal strength (range50.2 ppm and 0.1 ppm on each side of the center of the peak) of NAA, CHO, and CRE peaks in all brain voxels were automatically computed. Metabolite signals are reported as ratios of the area under the peaks NAA/CRE, NAA/CHO, and CHO/CRE. Regions of interest (ROIs) were drawn blindly with reference to standard anatomic atlases by two raters on coplanar structural MRI scans (intraclass correlation coefficient for the two raters5.9). The method for drawing the ROIs is described in detail elsewhere (Bertolino et al 1996). These ROIs were then transferred by computer on the1
H-MRSI maps and the average NAA, CHO, and CRE values were computed. Regions of interest were identified in the DLPFC, hippocampal area, superior temporal gyrus, inferior frontal gyrus, occipital cortex, anterior and posterior cingulate gyrus, thalamus, putamen, prefrontal white matter, and centrum semiovale (CSO).
Morphometry
To exclude the possibility that 1
H-MRSI findings were due to morphometric changes, we measured the volume of the prefron-tal lobe. The T1-weighted axial MRI scans used to localize the
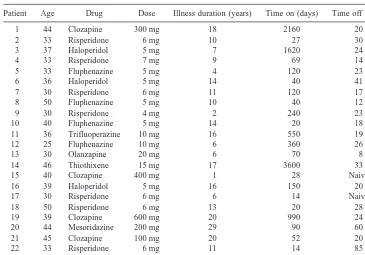
MRSI slices were resliced coronally using Medex software (version 3.21, Sensor Systems, Stirling, VA). The same software package was then used to manually outline prefrontal lobe areas Table 1. Clinical Characteristics of the Patients Studied
Patient Age Drug Dose Illness duration (years) Time on (days) Time off (days)
1 44 Clozapine 300 mg 18 2160 20
2 33 Risperidone 6 mg 10 27 30
3 37 Haloperidol 5 mg 7 1620 24
4 33 Risperidone 7 mg 9 69 14
5 33 Fluphenazine 5 mg 4 120 23
6 36 Haloperidol 5 mg 14 40 41
7 30 Risperidone 6 mg 11 120 17
8 50 Fluphenazine 5 mg 10 40 12
9 30 Risperidone 4 mg 2 240 23
10 40 Fluphenazine 5 mg 14 20 18
11 36 Trifluoperazine 10 mg 16 550 19
12 25 Fluphenazine 10 mg 6 360 26
13 30 Olanzapine 20 mg 6 70 8
14 46 Thiothixene 15 mg 17 3600 33
15 40 Clozapine 400 mg 1 28 Naive
16 39 Haloperidol 5 mg 16 150 20
17 30 Risperidone 6 mg 6 14 Naive
18 50 Risperidone 6 mg 13 20 28
19 39 Clozapine 600 mg 20 990 24
20 44 Mesoridazine 200 mg 29 90 60
21 45 Clozapine 100 mg 20 52 20
22 33 Risperidone 6 mg 11 14 85
on the coronal images. Measurements of frontal lobe were done by outlining the area of each slice rostral to the genu of the corpus callosum.
Statistical Analysis
Statistical analysis to assess the effects of drugs on1
H-MRSI and morphometric measures was performed with repeated-measures analysis of variance (ANOVA) for each ROI with treatment and hemisphere (left and right) as within-subject factors. Correlations between NAA measures and clinical variables were performed with Spearman analysis.
Results
Figure 1 shows the on– off comparison for all ROIs. By
repeated-measures ANOVA, the only significant effect of
treatment for NAA/CRE was in the DLPFC [F(1,22)
5
11.5, p
5
.002]. All other p values were
.
.2. Post hoc
analysis with Tukey honest significant difference showed
that patients off neuroleptics had lower NAA/CRE in the
DLPFC (mean on
5
2.78, mean off
5
2.54, p
5
.002).
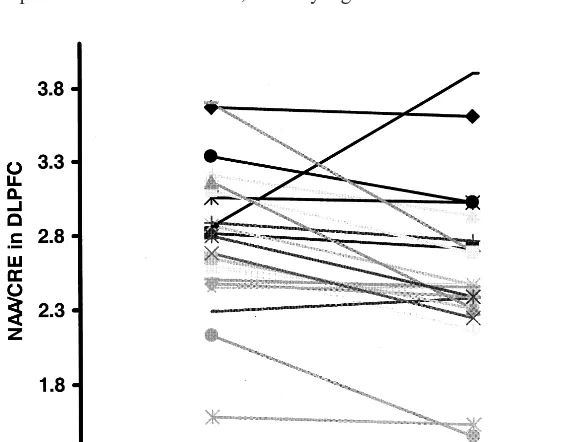
Figure 2 provides each individual’s NAA/CRE data in the
DLPFC while on and off antipsychotics. Nineteen of 23
patients have lower NAA/CRE while off antipsychotics
(Fisher exact test, p
5
.05). No effect of side or interaction
of side by treatment was found in the DLPFC. No other
significant main effect of treatment, of side, or of their
interaction was found in any of the other ROIs for any of
the metabolite ratios.
To evaluate whether the ratio changes (NAA/CRE)
arise because of changes in the numerator or denominator
terms, the mean integrated areas of NAA and CRE
resonances were normalized to the corresponding mean
integrated areas in the CSO (i.e., NAA DLPFC/NAA
CSO, CRE DLPFC/CRE CSO). We used the CSO as a
reference because in a previous study (Bertolino et al
1996) its metabolite ratios showed a low coefficient of
variation among several other ROIs and because it is
probably not involved in the primary pathophysiology of
schizophrenia. This further analysis in the DLPFC showed
a trend of NAA to be lower in patients while they are drug
free [ANOVA, F(1,22)
5
3.4, p
,
.07], whereas no
difference was found for normalized CRE [ANOVA,
F(1,22)
5
.14, p
.
.7], indicating that the ratio differences
previously seen arise due to differences in NAA.
To evaluate whether the effect seen on NAA/CRE in the
DLPFC could have been influenced by order effects, we
performed a further ANOVA with order as an additional
within-subject factor. No main effect of order was found
Figure 1. Bar graph showing N-acetylaspartate (NAA)/ creatine1phosphocreatine (CRE) levels in patients on (lighter bar) and off (darker bar) antipsychotics for all identified regions of interest. N5 23. THAL, thalamus; PUT, putamen; HIPPO, hippocampal area; STG, superior temporal gyrus; IFC, inferior frontal cortex; DLPFC, dorsolateral prefrontal cortex; A CING, anterior cingulate; P CING, posterior cingulate; OCC, occipital cortex; FWM, prefrontal white matter; CSO, centrum semiovale. *p,.002.
[F(1,22)
5
0.8, p
.
.7]. Since the patients were treated
with different antipsychotic drugs, we also performed
further analyses to test for differences between treatment
with typical or atypical drugs. Indeed, whereas both
pharmacologic treatments showed a moderate effect size,
the one for atypical antipsychotics was higher (atypical
5
0.52, typical
5
0.375).
The data in the four patients studied three times
pro-vided additional support to the contention that neuroleptics
increase NAA/CRE in the DLPFC. A consistent
predict-able pattern is observed in every subject (p
,
.03, Fisher
exact test). These data further suggest that the neuroleptic
effect is reversible.
There were no significant correlations between NAA/
CRE changes in the DLPFC and changes in
symptomatol-ogy, illness duration, drug treatment duration, or duration
of withdrawal from antipsychotics. No significant main
effect of drug was found on the volume of the prefrontal
lobe (F
5
1.8, p
.
.1).
Discussion
The results of this study show that NAA measures in the
DLPFC are selectively increased by treatment with
anti-psychotic drugs in patients with schizophrenia. This effect
seems to be produced by both typical and atypical
antip-sychotics, though the effect may be slightly greater with
the atypicals. In addition, antipsychotic treatment did not
affect NAA measures in any of the other regions surveyed,
including the hippocampal area, the other region where
previous studies have consistently shown NAA reductions
in schizophrenia.
This report is the first in vivo evidence that treatment
with antipsychotics in patients with schizophrenia
selec-tively affects a population of neurons in the DLPFC.
Although the origins of these NAA changes in the DLPFC
are not clear, it is tempting to implicate glutamatergic
neurons. N-Acetylaspartate concentration in the rat brain
is highest in pyramidal, glutamatergic neurons (Moffett
and Namboodiri 1995), and NAA synthesis in the
mito-chondria is dependent on glutamate and pyruvate or
3-hydroxybutyrate (Clark 1998). Therefore, it is logical to
expect that changes in glutamate may in turn affect NAA
synthesis and concentration, if only as a surrogate measure
of neuronal metabolic activation. Reductions in NAA
concentration are seen in association with various
patho-logic conditions involving glutamatergic neurons (Cendes
et al 1997; Hugg et al 1996; Tedeschi et al 1996). Other
data also suggest that NAA concentration varies with the
structural and functional state of glutamatergic cells
(Cen-des et al 1997; Hugg et al 1996; Najim et al 1998). Several
studies have now shown that NAA levels are reduced in
patients with schizophrenia in the hippocampal area and
the DLPFC, two areas in which glutamatergic pathology
has been implicated (Akbarian et al 1996; Eastwood et al
1995; Weinberger 1999). N-Acetylaspartate reductions in
the DLPFC predict several neurobiological phenomena
associated with schizophrenia, such as dopamine
regula-tion in striatum and working memory–related cortical
activation, which depend on corticofugal and intracortical
glutamate projections, respectively (Bertolino et al 1999a,
2000a, 2000b; Callicott et al, in press). Consistent with the
data in schizophrenia, neonatal lesions of the hippocampal
area in rodents and primates produce developmental
im-pairment of the DLPFC that predicts dysregulation of the
dopaminergic system (Bertolino et al 1997, 1999a, 1999b).
Taken together, these various data suggest that NAA
measures, at least in the context of neuronal pathology,
may vary as a correlate of the activity of glutamate
neurons.
These speculations are consistent with an emerging
basic science literature suggesting that both typical and
atypical antipsychotics affect glutamatergic metabolism in
a regionally specific fashion. In this regard several basic
science studies have shown that both typical and atypical
antipsychotics increase the expression of glutamate
recep-tor subunit (GluR2) messenger RNA (Eastwood et al
1996), GluR1 protein levels (Fitzgerald et al 1995), and
N-methyl-
D-asparate (NMDA) activity in the rat prefrontal
cortex (Lidsky et al 1997), as well as stimulate glutamate
release in the striatum (Bardgett et al 1993; See and Lynch
1995, 1996; Yamamoto and Cooperman 1994), a region
that receives glutamatergic inputs from the prefrontal
cortex. Therefore, both typical and atypical antipsychotics
seem to affect glutamatergic activity, even though they do
not “bind” to NMDA receptors, per se. It is yet to be
determined whether the NAA changes in the prefrontal
cortex reflect any of these effects.
CHO may suggest that there is no significant membrane
turnover.
There are several limitations of this study. The change
in NAA measures in the DLPFC associated with
antipsy-chotic treatment is about 9%. In a previous study in which
we assessed the reproducibility of NAA measures in 10
patients with schizophrenia on stable treatment with
anti-psychotics, we reported a coefficient of variation of about
9% in the DLPFC (Bertolino et al 1998b). Thus, the
magnitude of our findings here does not exceed the degree
of expected variability. However, as 19 of the 23 (p
,
.05,
Fisher exact text) patients studied in this experiment
showed NAA changes in the same direction (higher NAA
on antipsychotics), and as all four of the patients studied
on three occasions showed consistent effects, the results
appear to be determined by the effect of drugs. It is also
important to remember that, whereas other anatomic
regions have shown similar or even higher coefficients of
variation, the DLPFC was the only region with a
signifi-cant change. It also should be noted that, as both the
treatment and the off-medication phases of this study were
relatively brief, it is conceivable that a longer period
would have resulted in greater changes in NAA measures.
Another limitation of this study is the rather gross
volumetric measurement of the prefrontal lobe. We
per-formed this measurement to exclude any major volume
change in the prefrontal lobe that could have confounded
the NAA measurements. However, the images we had
acquired did not allow us to measure more specifically the
volume of the DLPFC, which is where we found the NAA
changes. Therefore, we cannot definitively exclude
volu-metric DLPFC changes. Nonetheless, the use of
metabo-lite ratios (which should be less sensitive to volume
changes) along with these data does not support any gross
volumetric change of the prefrontal lobe.
Another possible confound of our data is motion.
Indeed, patients off antipsychotics are not sedated and are
therefore more anxious about any procedure. We cannot
exclude that any subtle motion may have affected the data.
However, as noted above, we screened for motion that
may have affected the spectra. Moreover, it is unlikely that
the results would have been so regionally specific if they
were a result of motion artifacts. It is also worth
under-lining that antipsychotic treatment may have contributed
to some of the inconsistencies in the
1H-MRS literature.
Even though the majority of studies have shown NAA
reductions in the frontal cortex of patients with
schizo-phrenia, some studies have failed to do so. It is possible
that the latter studies have not found differences in NAA
measures in the frontal cortex because they studied
pa-tients under treatment with antipsychotics.
In conclusion, treatment with antipsychotics, both
typ-ical and atyptyp-ical, increases NAA measures selectively in
the DLPFC of patients with schizophrenia. Even though
the neurobiological mechanism responsible for these
changes is unclear,
1H-MRSI may be an ideal tool to
further investigate in vivo changes induced by
antipsy-chotics at the neuronal level.
References
Akbarian S, Sucher NJ, Bradley D, Tafazzoli A, Trinh D, Hetrick WP, et al (1996): Selective alterations in gene expression for NMDA receptor subunits in prefrontal cortex of schizophren-ics. J Neurosci 16:19 –30.
Andreasen NC (1989): The Scale for the Assessment of Negative Symptoms (SANS): Conceptual and theoretical foundations.
Br J Psychiatry Suppl 49 –58.
Bardgett ME, Wrona CT, Newcomer JW, Csernansky JG (1993): Subcortical excitatory amino acid levels after acute and subchronic administration of typical and atypical neurolep-tics. Eur J Pharmacol 230:245–250.
Bartha R, Williamson PC, Drost DJ, Malla A, Carr TJ, Cortese L, et al (1997): Measurement of glutamate and glutamine in the medial prefrontal cortex of never-treated schizophrenic patients and healthy controls by proton magnetic resonance spectroscopy. Arch Gen Psychiatry 54:959 –965.
Bertolino A, Breier A, Callicott JH, Adler C, Mattay VS, Shapiro M, et al (2000a): The relationship between dorsolateral prefrontal neuronal n-acetylaspartate and evoked release of striatal dopamine in schizophrenia.
Neuropsychopharmacol-ogy 22:125–132.
Bertolino A, Callicott JH, Elman I, Mattay VS, Tedeschi G, Frank JA, et al (1998a): Regionally specific neuronal pathol-ogy in untreated patients with schizophrenia: A proton mag-netic resonance spectroscopic imaging study. Biol Psychiatry 43:641– 648.
Bertolino A, Callicott JH, Nawroz S, Mattay VS, Duyn JH, Tedeschi G, et al (1998b): Reproducibility of proton magnetic resonance spectroscopic imaging in patients with schizophre-nia. Neuropsychopharmacology 18:1–9.
Bertolino A, Esposito G, Callicott JH, Mattay VS, van Horn JD, Frank JA, et al (2000b): A specific relationship between prefrontal neuronal n-acetylaspartate and activation of the working memory cortical network in schizophrenia. Am J
Psychiatry 157:26 –33.
Bertolino A, Knable MB, Saunders RC, Callicott JH, Kolachana B, Mattay VS, et al (1999a): The relationship between dorsolateral prefrontal N-acetylaspartate measures and striatal dopamine activity in schizophrenia. Biol Psychiatry 45:660 – 667.
Bertolino A, Kumra S, Callicott JH, Mattay VS, Lestz RM, Jacobsen L, et al (1998c): Common pattern of cortical pathology in childhood-onset and adult-onset schizophrenia as identified by proton magnetic resonance spectroscopic imaging. Am J Psychiatry 155:1376 –1383.
Bertolino A, Nawroz S, Mattay VS, Duyn JH, Moonen CTW, Barnett AS, et al (1996): A specific pattern of neurochemical pathology in schizophrenia as assessed by multislice proton magnetic resonance spectroscopic imaging. Am J Psychiatry 153:1554 –1563.
Weinberger DR (1999b, October): Postpubertal emergence of prefrontal neuronal deficits and altered dopaminergic behav-iors in rats with neonatal hippocampal lesions. Abstract presented at the annual meeting of the Society for Neuro-science, Miami.
Bertolino A, Saunders RC, Mattay VS, Bachevalier J, Frank JA, Weinberger DR (1997): Proton magnetic resonance spectro-scopic imaging in monkeys with mesial temporo-limbic lesions. Cereb Cortex 7:740 –748.
Bigelow LB, Berthot BD (1989): The Psychiatric Symptom Assessment Scale (PSAS). Psychopharmacol Bull 25:168 – 173.
Brooks WM, Hodde-Vargas J, Vargas LA, Yeo RA, Ford CC, Hendren RL (1998): Frontal lobe of children with schizophre-nia spectrum disorders: A proton magnetic resonance spec-troscopic study. Biol Psychiatry 43:263–269.
Buchsbaum MS, Hazlett EA (1998): Positron emission tomog-raphy studies of abnormal glucose metabolism in schizophre-nia. Schizophr Bull 24:343–364.
Buckley PF, Moore C, Long H, Larkin C, Thompson P, Mulvany F, et al (1994): 1H magnetic resonance spectroscopy of the left temporal and frontal lobes in schizophrenia: Clinical neurodevelopmental and cognitive correlates. Biol Psychiatry 36:792– 800.
Callicott JH, Bertolino A, Mattay VS, Langheim FJP, Duyn J, Coppola R, et al (in press): Physiological dysfunction of the dorsolateral prefrontal cortex in schizophrenia revisited.
Cereb Cortex.
Callicott JH, Egan MF, Bertolino A, Mattay VS, Langheim FJP, Frank JA, Weinberger DR (1998): Hippocampal N-acetylas-partate in unaffected siblings of patients with schizophrenia: A possible intermediate phenotype. Biol Psychiatry 44:941– 950.
Cecil KM, Lenkinski RE, Gur RE, Gur RC (1998): Proton magnetic resonance spectroscopy in the frontal and temporal lobes of neuroleptic naive patients with schizophrenia.
Neu-ropsychopharmacology 20:131–140.
Cendes F, Andermann F, Dubeau F, Matthews PM, Arnold DL (1997): Normalization of neuronal metabolic dysfunction after surgery for temporal lobe epilepsy. Evidence from proton MR spectroscopic imaging. Neurology 49:1525–1533. Clark JB (1998): N-Acetyl aspartate: A marker for neuronal loss
or mitochondrial dysfunction. Dev Neurosci 20:271–276. Deicken RF, Zhou L, Corwin F, Vinogradov S, Weiner MW
(1997): Decreased left frontal lobe N-acetylaspartate in schizophrenia. Am J Psychiatry 154:688 – 690.
Deicken RF, Zhou L, Schuff N, Fein G, Weiner MW (1998): Hippocampal neuronal dysfunction in schizophrenia as mea-sured by proton magnetic resonance spectroscopy. Biol
Psy-chiatry 43:483– 488.
De Stefano N, Matthews P, Antel JP, Preul M, Francis G, Arnold DL (1995): Chemical pathology of acute demyelinating lesions and its correlations with disability. Ann Neurol 38: 901–909.
Deutch AY, Lee MC, Iadarola MJ (1992): Regionally specific effects of atypical antipsychotics drugs on striatal Fos expres-sion: The nucleus accumbens shell as a locus of antipsychotic action. Mol Cell Neurosci 3:332–341.
Dragunow M, Robertson GS, Faull RLM, Robertson HA, Jansen
K (1990): D2 dopamine receptor antagonists induce Fos and related proteins in rat striatal neurons. Neuroscience 37:287– 294.
Duyn JH, Gillen J, Sobering G, van Zijl PC, Moonen CTW (1993): Multisection proton MR spectroscopic imaging of the brain. Radiology 188:277–282.
Eastwood SL, McDonald B, Burnet PW, Beckwith JP, Kerwin RW, Harrison PJ (1995): Decreased expression of mRNAs encoding non-NMDA glutamate receptors GluR1 and GluR2 in medial temporal lobe neurons in schizophrenia. Mol Brain
Res 29:211–223.
Eastwood SL, Porter RHP, Harrison PJ (1996): The effect of chronic haloperidol treatment on glutamate receptor subunit (GluR1, GluR2, KA1, KA2, NR1) mRNAs and glutamate binding protein mRNA in rat forebrain. Neurosci Lett 212: 163–166.
Fink-Jensen A, Kristensen P (1994): Effects of typical and atypical neuroleptics on Fos protein expression in the rat forebrain. Neurosci Lett 182:115–118.
Fitzgerald LW, Deutch AY, Gasic G, Heinemann SF, Nestler EJ (1995): Regulation of cortical and subcortical glutamate receptor subunit expression by antipsychotic drugs. J
Neuro-sci 15:2453–2461.
Fukuzako H, Takeuchi K, Hokazono Y, Fukuzako T, Yamada K, Hashiguchi T, et al (1995): Proton magnetic resonance spectroscopy of the left medial temporal and frontal lobes in chronic schizophrenia: Preliminary report. Psychiatry Res 61:193–200.
Glantz LA, Lewis DA (2000): Decreased dendritic spine density on prefrontal cortical pyramidal neurons in schizophrenia.
Arch Gen Psychiatry 1:65–73.
Goldman-Rakic PS (1994): Working memory dysfunction in schizophrenia. J Neuropsychiatry Clin Neurosci 6:348 –357. Heimberg C, Komoroski R, Lawson WB, Cardwell D, Karson C (1998): Regional proton magnetic resonance spectroscopy in schizophrenia and exploration of drug effect. Psychiatry Res 83:105–115.
Holcomb H, Cascella NG, Thaker GK, Medoff DR, Dannals RF, Tamminga C (1996): Functional sites of neuroleptic drug action in the human brain: PET/FDG studies with and without haloperidol. Am J Psychiatry 153:141–149.
Hugg JW, Kuzniecky RI, Gilliam FG, Morawetz RB, Fraught RE, Hetherington HP (1996): Normalization of contralateral metabolic function following temporal lobectomy demon-strated by 1H magnetic resonance spectroscopic imaging. Ann
Neurol 40:236 –239.
Kelley JJ, Gao XM, Tamminga CA, Roberts RC (1997): The effect of chronic haloperidol treatment on dendritic spines in the rat striatum. Exp Neurol 146:471– 478.
Kerns JM, Sierens DK, Kao LC, Klawans HL, Carvey PM (1992): Synaptic plasticity in the rat striatum following chronic haloperidol treatment. Clin Neuropharmacol 15:488 – 500.
Lewis DA, Pierri JN, Volk DW, Melchitzky DS, Woo TU (1999): Altered GABA neurotransmission and prefrontal cortical dysfunction in schizophrenia. Biol Psychiatry 46: 616 – 626.
Lidsky TI, Yablonsky-Alter E, Zuck LG, Banerjee SP (1997): Antipsychotic drug effects on glutamatergic activity. Brain
Lindquist DM, Hawk RM, Karson CN, Komoroski RA (2000): Effects of antipsychotic drugs on metabolite ratios in rat brain in vivo. Magn Reson Med 43:355–358.
Maier M, Ron MA, Barker GJ, Tofts PS (1995): Proton magnetic resonance spectroscopy: An in vivo method of estimating hippocampal neuronal depletion in schizophrenia. Psychol
Med 25:1201–1209.
Meltzer HY (1991): The mechanism of action of novel antipsy-chotic drugs. Schizophr Bull 17:263–287.
Miller DD, Andreasen NC, O’Leary DS, Rezai K, Watkins L, Boles Ponto L, Hichwa R (1997): Effect of antipsychotics on regional cerebral blood flow measured with positron emission tomography. Neuropsychopharmacology 17:230 –240. Moffett JR, Namboodiri MA (1995): Differential distribution of
N-acetylaspartylglutamate and N-acetylaspartate immunore-activities in rat forebrain. J Neurocytol 24:409 – 433. Najim IM, Wang Y, Shedid D, Luders HO, Ng TC, Comair YG
(1998): MRS metabolic markers of seizures and seizure-induced neuronal damage. Epilepsia 39:244 –250.
Nasrallah HA, Skinner TE, Schmalbrock P, Robitaille PM (1994): Proton magnetic resonance spectroscopy of the hip-pocampal formation in schizophrenia: A pilot study. Br J
Psychiatry 165:481– 485.
Okumura N, Otsuki S, Nasu H (1959): The influence of insulin hypoglycaemic coma, repeated electroshocks, and chlorprom-azine or beta-phenylisopropylmethylamine administration on the free amino acids in the brain. J Biochem 46:247–252. Renshaw PF, Yurgelun-Todd DA, Tohen M, Gruber S, Cohen
BM (1995): Temporal lobe proton magnetic resonance spec-troscopy of patients with first-episode psychosis. Am J
Psychiatry 152:444 – 446.
Robertson GS, Matsumara H, Fibiger HC (1994): Induction patterns of Fos-like immunoreactivity in the forebrain as predictors of atypical antipsychotic activity. J Pharmacol Exp
Ther 271:1058 –1066.
Rodriguez JJ, Pickel VM (1999): Enhancement of N-methyl-D-aspartate (NMDA) immunoreactivity in residual dendritic spines in the caudate-putamen nucleus after chronic haloper-idol administration. Synapse 33:289 –303.
See RE, Lynch AM (1995): Chronic haloperidol potentiates stimulated glutamate release in caudate putamen, but not prefrontal cortex. Neuroreport 6:1795–1798.
See RE, Lynch AM (1996): Duration-dependent increase in striatal glutamate following prolonged fluphenazine adminis-tration in rats. Eur J Pharmacol 308:279 –282.
Seeman P, Lee T (1975): Antipsychotic drugs: Direct correlation between clinical potency and presynaptic action on dopamine neurons. Science 188:1217–1219.
Stanley JA, Williamson PC, Drost DJ, Rylett RJ, Carr TJ, Malla A, Thompson RT (1996): An in vivo proton magnetic resonance spectroscopy study of schizophrenia patients.
Schizophr Bull 22:597– 609.
Tedeschi G, Bertolino A, Lundbom N, Bonavita S, Patronas NJ, Duyn JH, et al (1996): Cortical and subcortical chemical pathology in Alzheimer’s disease as assessed by multislice proton magnetic resonance spectroscopic imaging. Neurology 47:696 –704.
Thomas AM, Ke Y, Caplan R, Levitt J, Azarnow R, Curran J, McCracken J (1998): Preliminary study of frontal lobe 1H MR spectroscopy in childhood-onset schizophrenia. Magn
Reson Imaging 84:841– 846.
Ulas J, Nguyen L, Cotman C (1993): Chronic haloperidol treatment enhances binding to NMDA receptors in rat cortex.
Neuroreport 4:1049 –1051.
Urenjak J, Williams SR, Gadian DG, Noble M (1993): Proton nuclear magnetic resonance spectroscopy unambiguously identifies different neural cell types. J Neurosci 13:981–989. Vion-Dury J, Salvan AM, Confort-Gouny S, Dhiver C, Cozzone P (1995): Reversal of brain metabolic alterations with zidovu-dine detected by proton localised magnetic resonance spec-troscopy. Lancet 345:60 – 61.
Weinberger DR (1999): Cell biology of the hippocampal forma-tion in schizophrenia. Biol Psychiatry 45:395– 402.
Weinberger DR, Lipska BK (1995): Cortical maldevelopment, antipsychotic drugs, and schizophrenia: A search for common ground. Schizophr Res 16:87–110.
Yamamoto BK, Cooperman MA (1994): Differential effects of chronic antipsychotic drug treatment on extracellular glutamate and dopamine concentrations. J Neurosci 14:4159 – 4166. Yurgelun-Todd DA, Renshaw PF, Gruber SA, Waternaux CM,
Cohen BM (1996): Proton magnetic resonance spectroscopy of the temporal lobes in schizophrenics and normal controls.