PANSHARPENING OF HYPERSPECTRAL IMAGES IN URBAN AREAS
Chembe Chisense, Johannes Engels, Michael Hahn and Eberhard G ¨ulch
Stuttgart University of Applied Sciences Schellingstr. 24
D-70174 Stuttgart, Germany [email protected]
Commission VII/6
KEY WORDS: image fusion, hyperspectral, resolution, urban, classification
ABSTRACT:
Pansharpening has proven to be a valuable method for resolution enhancement of multi-band images when spatially high-resolving panchromatic images are available in addition. In principle, pansharpening can beneficially be applied to hyperspectral images as well. But whereas the grey values of multi-spectral images comprise at most relative information about the registered intensities, calibrated hyperspectral images are supposed to provide absolute reflectivity values of the respective material surfaces. This physical significance of the hyperspectral data should be preserved within the pansharpening process as much as possible. In this paper we compare several common pansharpening methods such as Principal Component Fusion, Wavelet Fusion, Gram-Schmidt transform and investigate their applicability for hyperspectral data. Our focus is on the impact of the pansharpening on material classifications. Apart from applying common quality measures, we compare the results of material classifications from hyperspectral data, which were pansharpened by different methods. In addition we propose an alternative pansharpening method which is based on an initial segmentation of the panchromatic image with an additional use of map vector data.
1 INTRODUCTION
Pansharpening is a well-established technique for the enhance-ment of spatial image resolution, which allows the fusion of a low resolution multiband image with a high resolution panchromatic image. A mere upsampling of the multi-band image with an in-terpolation filter would result in a blurry quality with smoothed edges and missing short-wavelength constituents in the spatial Fourier expansions. Therefore at least the short-wavelength spa-tial information of the panchromatic image is integrated within fusion. This process, however, entails quite an amount of arbi-trariness. Whereas the overall brightness of a pixel (apart from histogram matching) can be more or less directly adopted from the panchromatic information, the ratio of the grey values of the individual channels depends strongly on the respective pansharp-ening method.
More recently developed sensors suggest the application of pan-sharpening techniques, as those sensors frequently provide data in different resolution levels. Even more significant is the differ-ence between hyperspectral sensors and colour cameras. Hyper-spectral data usually feature a lower resolution than RGB images. However, pansharpening of hyperspectral imagery by a panchro-matic image imposes two distinct problems:
• Often the “panchromatic” image does not comprise the full wavelength range of the hyperspectral image but only a part of it. The panchromatic image might e.g. be derived from RGB imagery, whereas the hyperspectral image covers a wider range from the visible up to the shortwave infrared. In such a case, the panchromatic image is not “representative”, i.e. not a pixelwise average of the hyperspectral image. • Calibrated hyperspectral data ideally feature reflectivity
val-ues of the respective material surfaces (disregarding depen-dencies on the source - reflector - sensor geometry, i.e. the
BRDF function). Therefore, in contrast to common imagery, an absolute hyperspectral grey value carries physical signif-icance as a distinctive parameter of the material surfaces alone. Any “resolution enhancement” runs the risk of di-luting this significance by a distortion of the parameter.
In the present paper we compare several common pansharpening methods with respect to their impact or suitability for hyperspec-tral data. We present in addition an alternative pansharpening method, which is based on the segmentation of the panchromatic image. The interpolation on the finer grid is performed by us-ing data points from the same segment only. For the evaluation we apply visual inspection, profile analysis and some common quality measures. As more important, however, we rate a com-parison of the classification results which are achieved from the pansharpened images.
2 ESTABLISHED PANSHARPENING METHODS
In the last three decades, a lot of algorithms have been devel-oped which are, however, based on only few elementary prin-ciples. In any case, high-frequent panchromatic information is merged into spatially low resolution but spectrally differentiated data. We briefly outline the principles of some of the most com-mon pansharpening methods. Here we follow the more detailed representation in (Pohl and van Genderen 1998) or (Hirschmugl et al. 2005).
2–1 Gram-Schmidt Fusion
respect to their covariance as metric, exactly in the vein of the
HereGidenotes the greyvalue of an individual pixel in the orig-inal channeli,G¯¯kthe greyvalue of the same pixel in the (trans-formed) Gram-Schmidt channel¯k. µiis the mean greyvalue of channelitaken over all pixels. The covarianceCi,jbetween two original channelsi, jis empirically determined by
Ci,j= P
Pixels
(Gi−µi)(Gj−µj)
N
whereNdenotes the total number of pixels. Due to construction, the Gram-Schmidt channels are all uncorrelated.
The histogram of the high-resolving panchromatic image is matched to the histogram of the artificial, low-resolving panchromatic im-age. In this way at least the global (if not the local) grey value distribution of the panchromatic image is adjusted to the intensity distribution of the hyperspectral data. Then, the low-resolution panchromatic is replaced by the high resolution panchromatic, the remaining hyperspectral channels are upsampled and adopted. Finally, the Gram-Schmidt transform is inverted.
2–2 PCA Fusion
This method resembles very much the Gram-Schmidt Fusion. In contrast to the latter, the “artificial” low resolution panchromatic channel is constructed as that linear combination of all bands, which corresponds to the maximal eigenvalue of the principal component analysis. The eigenvectors of the PCA are by con-struction orthogonal; the corresponding combination bands are uncorrelated. The further processing is the same as with the Gram-Schmidt Fusion.
Obviously, PCA Fusion is based on the assumption that the pan-chromatic image corresponds best with the linear combination of bands which features the highest variance. As in the case of the Gram-Schmidt Fusion, a global histogram matching is employed. 2–3 Wavelet Fusion
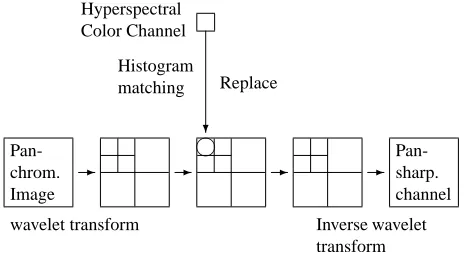
Wavelet Fusion is based on the concept of image pyramids, see e.g. (Ranchin and Wald 2000). Given a high resolution im-age, the base of the pyramid is just the image itself, whereas the higher levels of the pyramid consist in successive approxima-tions, i.e. each level consists in an approximation of the previous level. In a second pyramid the difference images between con-secutive approximations are represented. For the purpose of pan-sharpening, the high resolution panchromatic image is approxi-mated successively until the resolution of the hyperspectral data is reached. Then for each individual channel, the approximation of the panchromatic image is replaced by the respective hyper-spectral data. High resolution images are constructed by succes-sively adding the difference images of the panchromatic image to each individual channel.
Whereas many approximation methods are imaginable for this process, the Discrete Wavelet Transform constitutes a particu-larly elegant and – in view of the famous Mallat algorithm – also efficient possibility, see e.g. (Mallat 2009). The workflow of the wavelet fusion reminds to the workflow of PCA Fusion. For the former method, however, the transformations (forward and in-verse wavelet transform) act on the panchromatic image, whereas for the latter the transformations (forward and inverse PCA) work on the hyperspectral data.
Figure 1: Workflow of Wavelet Fusion according to (Hirschmugl et. al 2005)
Different from PCA and Gram-Schmidt Fusion, only local varia-tions of the panchromatic image affect the pansharpening result. This is due to the fact that only the wavelet coefficients (i.e. the difference images) of the panchromatic image remain, whereas the approximation coefficients of the low resolution level are re-placed by the corresponding coefficients of the respective hyper-spectral channel.
3 A SEGMENTATION-BASED PANSHARPENING METHOD
In a common RGB image the absolute grey and color values may differ noticeable from exposure to exposure. Hyperspectral data in contrast are usually calibrated in such a way, that the grey val-ues represent the absolute reflectivity of the respective surface materials for the respective wavelength, i.e. the ratio between reflected and incident radiation. The reflectivity is a property of the surface material alone; it is of particular value for the distinc-tion of surface materials. Therefore we aim at a pansharpening method which respects as much as possible the original hyper-spectral data. In a first step, we perform a segmentation of the high resolution panchromatic image. The segments are assumed to be homogeneous, ideally each segment should feature one ma-terial only. In a second step, the hyperspectral data are interpo-lated by means of an inverse distance method on the finer grid. Hereby only such pixels of the original hyperspectral image are used, which are located completely in the same segment as the interpolation position.
3–1 Segmentation of the Panchromatic Image (RGB-image)
The segmentation of the panchromatic image was performed by the well-known eCognition software, see (eCognition User Guide). This software enables the simultaneous processing of multiple channels in a hierarchical way. eCognition successively aggre-gates pixels with similar grey values to segments. Criteria for the aggregation of adjacent objects are on the one hand the hetero-geneity of the grey values of the combined object, on the other hand its geometric form. These criteria can be balanced by three parameters: “scale”, “color” and “shape”. Adequate parameters have to be selected by trial and error. Focused on application in urban areas, in most cases a one-to-one relation between seg-ments and building regions will be optimal, though roofs also may consist of different materials.
the orthophotos in the sense of a further subdivision; i.e. the bor-ders defined by the vector data are not changed, only additional borders introduced. For the parameters “scale”, “shape”, “com-pactness” the values 100, 0.2, and 0.9 were selected.
3–2 Interpolation of the Hyperspectral Channels on the Finer Grid by Inverse Distance Interpolation
For the interpolation on the finer grid we have chosen the In-verse Distance Method. This method on the one hand requires less computational effort than e.g. Minimum Curvature Interpo-lation, on the other hand avoids undesired oscillations as might appear with Kriging or Linear Prediction. The pixel centers of the hyperspectral image are considered as data points, whereas the pixel centers of the panchromatic grid (finer resolution) are considered as interpolation points. The workflow of the interpo-lation is as follows:
We run through all the segments and determine for each segment
Sa list of pixels of the finer grid which are contained inS; the centers of these pixels define the interpolation points. In addition, we select all the pixels of the coarser grid which are completely contained inS - they will give us the data points. The Inverse Distance Interpolation for any interpolation point and channel is performed according to the formula
b
yi= K X
k=1
ykwik P
lwil
wherewik= p
(ri−rk)2+ (ci−ck)2+α
Herey denotes the observation vector, i.e. the grey values of the data pixels for the respective channel, αis a regularizing parameter,K is the number of data points within the segment.
ri, rk, ci, ckare the row and column indices of the interpolation or data point with respect to the finer grid.
Higher powers of the distance are common for Inverse Distance Interpolation. As our data are somewhat noisy, we appreciate the smoothing effect within the segments due to the low power 1 of the distance.
For many small segments no pixel in the low resolution was en-countered, which was located completely inside the segment. For such cases all grey values in the pansharpened image were set to the corresponding values of the original hyperspectral image.
4 TEST DATA
For the evaluation of the pansharpening methods we use hyper-spectral data of Ludwigsburg, Germany. The data was recorded on August, 20 2010 with the HyMap sensor within the annual HyEurope-campaign of the German center of aviation and space flight (DLR); it comprises 125 channels in the range of0.45− 2.49µm. The ground resolution is 4 m. The test area consists in 6 strips with an overall extension of9.6×9.0km2. The
panchro-matic image was derived from an RGB-orthophoto which was registered in the spring of 2010. The ground resolution of this orthophoto amounted originally to 25 cm; it was degraded to 1m in order to keep the pansharpening factor moderate.
5 EVALUATION OF THE PANSHARPENING METHODS
5–1 General Visual Impression
The most obvious criterion for the quality of a pansharpening re-sult is the visual impression. This criterion might be misleading
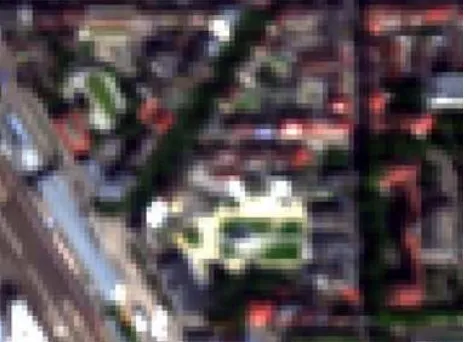
in some cases, hoewever, human vision is quite perceptive for im-age sharpness and color differences. Figures 2 – 6 show the RGB orthophoto, RGB-channels of the original HyMap data and the pansharpened data, achieved with three different methods, for a small region in the downtown in Ludwigsburg. In the lower left corner the station and some railway tracks are visible. As the re-sults of the PCA Fusion and the Gram-Schmidt Fusion can hardly be distinguished with bare eyes, only one of them is reproduced.
Figure 2: Original RGB-orthophoto
Figure 3: RGB channels of the original hyperspectral image
Figure 4: RGB channels of the Gram-Schmidt Fusion image
Figure 5: RGB channels of the Wavelet Fusion image
Figure 6: RGB channels of the Segmentation-based Fusion image
5–2 Profiles
The progression of greyvalues along profiles represents a value-able criterion for the evaluation of pansharpening methods. Par-ticularly critical are profiles where the visible and infrared chan-nels strongly diverge. (Hirschmugl et al. 2005) report for some fusion methods even trend reversals in the greyvalue progression.
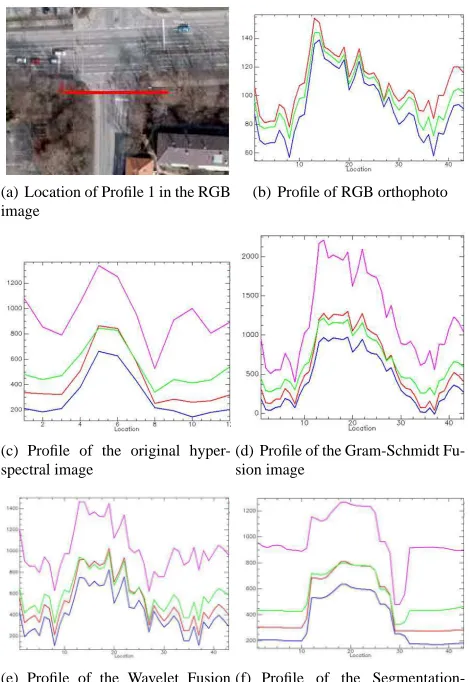
In Figures 7, 8 we consider two profiles in the original HyMap data and three pansharpening methods. For each profile of a pan-sharpened image we represent three visible (RGB) and one in-frared channels, viz. 454nm, 544nm, 635nm and 1500nm wave-lengths. The infrared channel is represented in pink in each case.
(a) Location of Profile 1 in the RGB image
(b) Profile of RGB orthophoto
(c) Profile of the original hyper-spectral image
(d) Profile of the Gram-Schmidt Fu-sion image
(e) Profile of the Wavelet Fusion image
(f) Profile of the Segmentation-based Fusion image
Figure 7: Profile 1 for different Fusion Methods
The absolute values of the Wavelet Fusion and the Segmentation-based Fusion are relatively close to the original HyMap data, whereas the absolute values of the Gram-Schmidt Fusion exceed the original ones by about 50%. This is evidently due to the fact that the Gram-Schmidt Fusion adapts the overall brightness to the panchromatic image (histogram matching is only performed globally), whereas the Wavelet Fusion introduces mostly short-wave components of the panchromatic image to the pansharpened image.
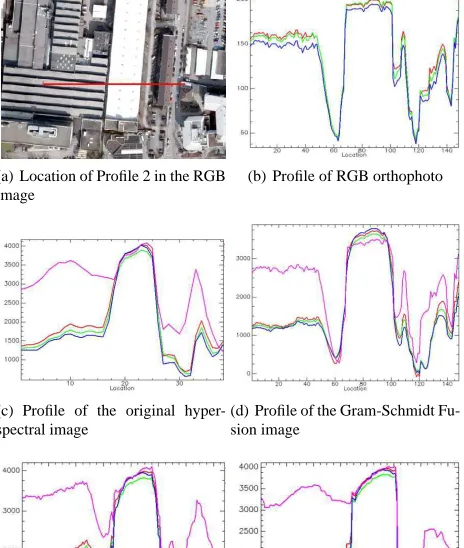
(a) Location of Profile 2 in the RGB image
(b) Profile of RGB orthophoto
(c) Profile of the original hyper-spectral image
(d) Profile of the Gram-Schmidt Fu-sion image
(e) Profile of the Wavelet Fusion image
(f) Profile of the Segmentation-based Fusion image
Figure 8: Profile 3 for different Fusion Methods
Profile 2 (Figure 8) is of special interest due to the different be-haviour of the infrared channel in the Gram-Schmidt and the Wavelet Fusion. The small dark strips between the inclined pan-els (shadowy areas) on the left building are too small to be re-solved in the hyperspectral image, whereas they do appear in the panchromatic image. The depths of the corresponding sinks in the Wavelet Fusion are more or less independent of the channel, whereas for the Gram-Schmidt Fusion they appear to be propor-tional to the “continuum” level of the respective channel. The Segmentation-based method exhibits its “generalizing” tendency again.
5–3 Quality Measures for the Comparison of the original and the pansharpened data
Some authors propose quality measures based on the differences between the original or upsampled hyperspectral data, respec-tively, and the pansharpened data. Here we evaluate the root mean square error, correlation coefficients and the universal quality in-dex proposed by (Wang and Bovik 2002).
Root mean square error:
The root mean square error is used to quantify the average amount of distortion in each pixel of the pansharpened images. The root mean square is computed between the original hyperspectral im-age (resampled to the resolution of the pansharpened hyperspec-tral data) and the pansharpened hyperspechyperspec-tral images. The results are shown in Table 1:
R G B I1 I2 I3
PCA 465 365 351 821 836 870
Gram-Schmidt 457 375 349 787 800 804 Wavelet 269 243 246 369 375 484 Seg.-based 231 195 193 365 371 490 Table 1: Root mean square error of different fusion methods com-pared to the upsampled original hyperspectral image (reflectivity values, range 0-10000)
The wavelengths of the represented bands are 0.635µm (R), 0.544
µm (G), 0.454µm (B), 1.50µm (I1), 1.805µm (I2) and 2.485µm (I3). It is obvious that for the most wavelengths the grey values of the Segmentation-based Fusion are least distorted.
Correlation Coefficients:
Table 2 compares the correlations between different channels and the panchromatic image. PCA and Gram-Schmidt Fusion show the highest correlation values, which means that for these two methods the contribution of the panchromatic image is the high-est. Particularly high are the correlation coefficients with the three infrared channels. On the opposite, the Segmentation-based Fusion image is closer to the original hyperspectral image which is desirable as the differences between the individual channels are levelled out to a lower extent.
R,P G,P B,P I1,P I2,P I3,P Original data 0.53 0.51 0.48 0.46 0.44 0.33 PCA 0.80 0.75 0.70 0.97 0.98 0.82 Gram Schmidt 0.79 0.76 0.70 0.93 0.93 0.74 Wavelet 0.69 0.68 0.65 0.61 0.59 0.51 Seg.-based 0.52 0.49 0.47 0.43 0.41 0.33 Table 2: Correlation coefficients between the panchromatic age and different bands of the original and the pansharpened im-ages
Universal Quality Index:
Quite common is the Universal Image Quality indexQgiven by (Wang and Bovik 2002):
Q:= 4σxyx¯y¯ (σ2
x+σy)[¯2 x2+ ¯y2] = σxy
σxσy · 2¯xy¯
¯
x2+ ¯y2 ·
2σxσy
σ2
x+σ2y
Herex={xi|i= 1,2,· · ·, N}, y={yi|i= 1,2,· · ·, N} de-note the original and test image signals, respectively,iis the pixel index.Qcan be applied to each channel individually. As the last term in the defining formula shows,Qcan be decomposed into three factors which comprise a) the correlation coefficient (corre-lation between the two images), b) a similarity measure between the arithmetic meansx¯andy¯and c) a similarity measure between the standard deviationsσxandσy.
are identical. Table 3 shows that by this criterion the Segmentation-based Fusion has the highest rank.
R G B I1 I2 I3
PCA 0.26 0.27 0.27 0.18 0.17 0.23 Gram Schmidt 0.26 0.26 0.27 0.19 0.19 0.26 Wavelet 0.49 0.34 0.32 0.45 0.15 0.42 Seg.-based 0.51 0.50 0.50 0.50 0.50 0.25 Table 3: Universal Quality Index according to (Wang and Bovik 2002) for different channels of the pansharpened images
5–4 Classification Results
As we use hyperspectral data mostly for material classication, we prefer to compare the pansharpening methods with respect to the result of a supervised classification which they provide. Here we present only first results of an ongoing research.
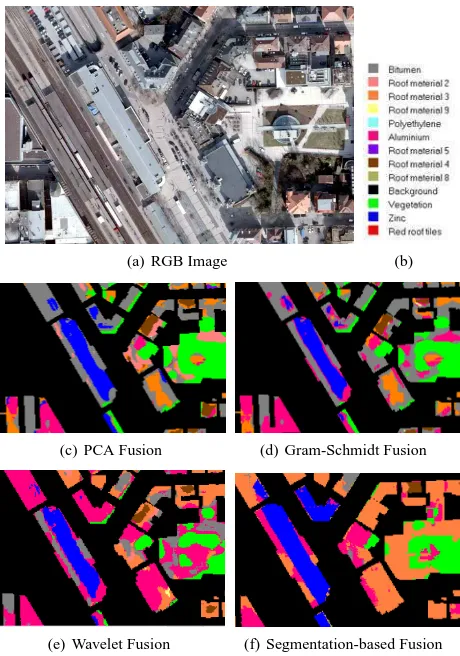
Before classifying the different pansharpened images, training re-gions for different surface materials were defined. We have used 18 training regions for 12 roof materials plus vegetation. In or-der to determine the accuracy of the classification, the results are compared with ground truth information. As test regions for the evaluation we use the training regions plus 33 additional regions. The ground truth has to be improved in the future, however.
(a) RGB Image (b)
(c) PCA Fusion (d) Gram-Schmidt Fusion
(e) Wavelet Fusion (f) Segmentation-based Fusion
Figure 9: Classification Example
Figures 9 gives an impression about the results of a SAM clas-sification. As expected, the Segmentation-based Fusion yields a good homogeneity of the segments. More significant are the evaluation measures which are reported in Table 4. The Overall Accuracy gives the ratio between correctly classified pixels and
the total number of pixels. The so-called kappa coefficient addi-tionally takes into account possible chance correct classifications (Cohen 1960). The results in Table 4 favour the Wavelet and the Segmentation-based Fusion – inspite of their minor visual qual-ity.
Fusion κ Overall
Method Accuracy
PCA 0.70 74.7 %
Gram Schmidt 0.72 76.7 % Wavelet 0.82 85.3 % Seg.-based 0.80 84.0 %
Table 4: Accuracy Measures of the Classification Results based on different Fusion Methods
6 CONCLUSIONS AND FUTURE WORK
Pansharpening in general not only affects the overall brightness of hyperspectral data, but also the shape of the hyperspectral sig-natures, which is important for material classification. In order to distort the original data as few as possible, we propose to per-form in a first step a segmentation of the panchromatic image, employing map vector data in addition if available. In a second step the data are resampled on the finer grid, whereby the inter-polation is performed only by means of data pixels which are located completely in the respective segment. A comparison of different pansharpening methods reveals very different rankings dependent on the quality criteria. We think that our method has a good potential for the pansharpening for classification purposes. Further investigations will be based on better ground truth in-formation and more sophisticated classification methods. They should also comprise a more detailed scrutiny of misclassified regions.
REFERENCES
Cohen, J., 1960. A coefficient of agreement for nominal scales. Educational and Psychological Measurement, 20, 37-46 Hirschmugl, M., Gallaun, H., Perko, R., and Schardt, M. 2005: “Pansharpening”-Methoden f¨ur digitale, sehr hoch aufl¨osende Fernerkundungsdaten. In: Beitr¨age zum 17. AGIT Symposium, Salzburg, Austria, July 06-08 2005.
Laben, C.A. and Brower, B.V. 2000: Process for enhancing the spatial resolution of multispectral imagery using pansharpening. United States Eastman Kodak Company (Rochester, New York). US Patent 6011875.
Mallat, S., 2009. A Wavelet Tour of Signal Processing. Elsevier Inc.
Pohl, C. and van Genderen, J.L. 1998: Multisensor image fusion in remote sensing: concepts, methods and applications. Interna-tional Journal of Remote Sensing, vol.19, no.5, pp.823- 854, Mar. 1998.