Measuring market power in the French
Comte´ cheese market
Pierre R. Me´rel
University of California, Davis, CA, USA
Received September 2007; final version received November 2008*
Abstract
A new empirical industrial organisation approach is used to measure seller market power in the French Comte´ cheese market, characterised by government-approved supply control. The estimation is performed on quarterly data at the wholesale stage over the period 1985 – 2005. Three different elasticity shifters are included in the demand specification, and the supply equation accounts for the existence of the European dairy quota policy. The market power estimate is small and statistically insignificant. Monopoly is clearly rejected. Results appear to be robust to the choice of functional form and suggest little effect of the supply control scheme on consumer prices.
Keywords: supply control, market power, NEIO, Comte´ cheese, protected designation of origin
JEL classification: L13, L41, Q18
1. Introduction
Comte´ is one of the most popular cheeses in France, with an annual production of about 50 thousand metric tons, making the Comte´ industry the largest cheese industry benefiting from a protected designation of origin (PDO) in the country.1Production has been increasing steadily since the early 1990s. The industry is characterised by the existence of industry-wide contracts between upstream producers (dairy cooperatives) and downstream processors (ripening facilities), as well as government-approved supply control.
In this article, a new empirical industrial organisation (NEIO) approach is used to assess the degree of seller market power exercised in the Comte´ cheese market. The question has policy relevance given the importance of the indus-try and the controversial nature of the supply control scheme. In 1998, the pro-ducer association, the Comite´ Interprofessionnel du Gruye`re de Comte´
(hereafter CIGC), was fined by the French antitrust authority, the Conseil
*Review coordinated by Alison Burrell.
1 Most of the production is consumed nationally.
de la Concurrence, for implementing a production plan without government support (Conseil de la Concurrence, 1998). The plan consisted of imposing penalties on individual producers for production in excess of a predetermined quota. A similar plan was approved by the government immediately after-wards, and such production plans are still in place today. The authority’s 1998 ruling stated:2
[. . .] it remains undisputed that, on the one hand, the [supply control] measure targeted all Comte´-producing firms and, on the other hand, [. . .] the criticised measure had a deterrent effect that limited the price decrease and made Comte´ production less attractive for Emmental producers wishing to shift to Comte´ production; [. . .] finally, that several firms were indeed charged a penalty for producing above their allocated quota, for a total amount of 1,156,509 French Francs; that, as a result, the measure had a significant effect on the market in question [. . .].
In a 2000 report, the Organisation for Economic Cooperation and Develop-ment expressed concerns regarding the existence of market power associated with certain European PDOs, explicitly referring to specialty cheese markets (Lucatelli, 2000). In addition, approval of the Comte´ production plan by public authorities, in particular, the French Ministry of Finance, has some-times been difficult to obtain.3
Nonetheless, the empirical importance of the existing distortion remains unknown. An empirical analysis that estimates the extent of market power being exercised in the Comte´ market is thus of interest to policymakers and potentially to antitrust authorities. More generally, economists have been prompt in describing European PDOs as cartelised markets. This argument may be used to oppose the recognition of PDOs at the international level.4 Although focused on a particular commodity, this study sheds doubt on the ability of collective marketing arrangements such as those observed in certain PDO markets to sustain supercompetitive prices.
Traditionally, the NEIO methodology has been used to measure the effects of industry concentration on buyer or seller competition and the efficiency of markets.5It has also been used, in agricultural applications, to test whether marketing institutions such as producer cooperatives or marketing orders ben-efiting from antitrust exemptions have been successful in extracting oligopoly rents (Crespi and Sexton, 2003; Crespi and Chaco´n-Cascante, 2004). The present paper belongs to this latter branch of literature.
2 Translated from French by the author.
3 A Comte´-producing firm brought a case to the French antitrust authority in late 2006 regarding potential antitrust infringements contained in a proposed amendment to the Comte´ regulations (Conseil de la Concurrence, 2007). The new provisions, which have since been adopted by the French government, include several limitations on the production capacity of Comte´-producing entities.
4 For an overview of the debate over geographical indications between the EU and the US, see, for instance, Josling (2006).
This article addresses the concern that the NEIO methodology has often been implemented on overly aggregated industries (Kaiser and Suzuki, 2006). By focusing on one cheese variety, without ignoring the possibility of substitution with other cheeses, the study narrowly defines the potentially imperfectly competitive industry and tailors the estimation procedure to a close observation of policy, technology and demand conditions.
The existence of a pre-existing distortion due to the EU dairy quota policy is taken into consideration by specifying cost as the opportunity cost of not pro-ducing a substitute, namely Emmental cheese.6This constitutes an interesting adaptation of the standard NEIO model. A fundamental reason for defining the cost of producing Comte´ as the opportunity cost of not producing Emmental is that this opportunity cost includes any dairy quota rent accruing to the dairy production sector and is therefore a better indication of the true cost of pro-ducing Comte´ than a sum of physical input costs. In fact, ignoring the possi-bility that the dairy quota has been binding over the period of investigation could lead the analyst to spuriously attribute a significant price – cost margin to the presence of market power at the level of the Comte´ industry, while such a margin could be due, in part or in total, to the dairy quota, and exist in other dairy markets as well. By specifying marginal cost as the opportunity cost of not producing Emmental, we thus seek to detect any additional
mark-up beyond that originating in the European dairy quota.7
The estimation is performed on quarterly data at the wholesale stage over the period 1985 – 2005. It leads to the conclusion that if market power has been exerted by the Comte´ industry, it is hard to detect econometrically and is likely to be very small. This finding suggests that consumers have not been hurt by supply control and that the social cost of the policy has been negligible.
2. The French Comte´ cheese market
Comte´ is a pressed, cooked cheese made from raw cows’ milk, aged for at least four months, which comes in large wheels weighing between 66 and 106 lb. The specificity of Comte´ cheese was recognised by a Court decision in 1952, and its production was first codified in 1958. Comte´ was intro-duced in the European register of protected designations of origin in 1996, the date the register was created (Council of the European Union, 2006). Production of Comte´ is currently regulated by a 2007 governmental decree (Re´publique
6 Emmental cheese is the main type of pressed, cooked cheese manufactured in France, with an annual production of about 250,000 metric tons.
Franc¸aise, 2007). The decree contains provisions such as the delimitation of the area of production, the physical characteristics of the cheese and restric-tions on the production methods to be used at each stage of fabrication, includ-ing the farm level. Notable production constraints include restrictions on cow breeds and feed, and limits on the stocking rate and the distance travelled for collecting milk.
The production process unfolds in three stages: milk production, cheese fabrication and cheese ripening. All stages must take place within a delimited geographical area covering several districts of the Franche-Comte´ region.8In January 2005, there were about 3,300 milk producers, 190 cheese factories and 20 ripening facilities involved in Comte´ cheese production. Notably, 85 per cent of the cheese factories were owned by milk producers through cooperatives (Comite´ Technique du Comte´, 2005).
Milk producers, dairy cooperatives and ripening facilities are represented by a producer association, CIGC, whose stated missions are to guarantee the specificity of Comte´ cheese and help producers maintain a sustainable activity in the region. CIGC fulfils its first mission by controlling producers at various stages of the production process, filing lawsuits against imitators and participating in the development of standards.
The second mission is fulfilled through technical assistance to producers, generic advertising and the promotion of Comte´ cheese in export markets. CIGC also makes a yearly production plan to limit the quantity of Comte´ cheese produced, paired with model contracts designed to redistribute income between milk producers and ripening facilities.
The production plan is enforced through the delivery of certification marks necessary to authenticate cheese wheels. Marks are purchased from CIGC by cheese factories and applied onto unripe cheese wheels. Each factory is allo-cated a quota and charged a penalty for each mark purchased beyond that quota. The penalty is adjusted to account for any modification in the average weight of wheels.9The production plan is subject to yearly approval by the government.10
The main purpose of the model contracts, to be adopted by ripening facili-ties and the cheese factories supplying them, is to set the price of unripe cheese.11The contract also compels the ripening facility to purchase all the cheese produced by its suppliers.
Therefore, the Comte´ production sector can be modelled as a vertically inte-grated entity, with CIGC choosing the total quantity to be produced and real-locating rents through the contractual price of unripe cheese. These rents
8 The geographical constraint is not binding. Between 60 and 70 per cent of the milk produced in the eligible region is transformed into Comte´ cheese.
9 Colinetet al.(2006) estimated the over-quota premium to be about 36 per cent of the wholesale price of Comte´ cheese in 2006.
10 The production plan is approved by theOffice National du Lait et des Produits Laitiers, the Min-istry of Agriculture and the MinMin-istry of Finance.
include the quota rent from the EU dairy quota scheme, as well as any additional rent generated by the supply control scheme at the expense of buyers of ripened cheese. In what follows, we refer to the vertically integrated Comte´ production sector as ‘the Comte´ industry’.
3. The theoretical model
Assume that producers in the Comte´ region can produce two goods, Comte´ cheese and Emmental cheese,12 according to the aggregate cost function
C(QC, QE,22), where QC and QE,22 denote the quantities of Comte´ and Emmental produced. The two-period lag on the Emmental quantity reflects the fact that Comte´ cheese is ripened for a longer period than Emmental cheese. We assume that Emmental is sold in the same quarter it is produced, whereas Comte´ is ripened for two extra quarters.13Therefore, the functionC
represents the total cost, as of the current period, of producing QC units of Comte´ to be sold in the current period and QE,22units of Emmental to be sold two periods earlier. It includes all costs, from the production of milk to the ripening of cheese. The functionCis assumed to have all desirable prop-erties, in particular, it is non-decreasing in its arguments and convex. Pro-ducers are endowed with M¯ milk quotas, and the milk quota is binding.14 Although producers located in the Comte´ region are the sole producers of Comte´ cheese, they produce only a small share of the total milk supply, and there-fore we assume that they cannot influence the price of generic milk.15Entry into the Emmental market is free.16We assume that the transformation of milk into Emmental cheese involves a fixed-proportion, constant-returns-to-scale
12 The share of Comte´ and Emmental among the four main cheeses produced in Franche-Comte´ (Comte´, Emmental, Morbier and Raclette) was 96.5 per cent at the beginning of the study period and decreased to 83.9 per cent in 2005. Over the period, the mean was about 89.8 per cent (Min-iste`re de l’Agriculture et de la Peˆche, 2007b). These shares are rough estimates computed by comparing the quantities of each cheese variety, and do not account for differences in their milk content. It is expected that the milk content of Comte´ and Emmental is higher than that of the other two cheeses, which are not cooked. Notably, the vast majority of new entrants in the Comte´ industry over the period of investigation have originated in cheese factories pre-viously specialised in Emmental production (Comite´ Interprofessionnel du Gruye`re de Comte´, 2006; Ministe`re de l’Agriculture et de la Peˆche, 2007a).
13 Over the period, Comte´ cheese was ripened about 5.5 months longer than Emmental, that is, about two quarterly periods. Emmental cheese is ripened for a minimum of 6 weeks. 14 EU dairy quota appears to have been binding in the Comte´ region. While milk deliveries in
Franche-Comte´ had been increasing at a rate of over 1 per cent per year in the decade preceding the quota policy, this trend stopped with the introduction of quota in 1984. Milk quota for 2004 – 2005 was 1 per cent below the average of milk deliveries over the period 1981 – 1983 in this region (Ministe`re de l’Agriculture et de la Peˆche, 2005). Colinetet al.(2006) reported that between 1992 and 2004, milk quota in the Comte´ eligible area (Departments of Doubs and Jura) has also limited milk deliveries.
15 Milk deliveries in the Franche-Comte´ region represented about 4.8 per cent of all French milk deliveries in 2005 (Ministe`re de l’Agriculture et de la Peˆche, 2007b).
technology, so that the price of Emmental, which is then equal to the price of generic milk plus a unit processing cost, does not depend on the quantities of Comte´ (QC) or Emmental (QE,22) produced in the Comte´ region.
Denote bykCthe coefficient of conversion of milk into Comte´ cheese and by kE the coefficient of conversion of milk into Emmental cheese, both assumed to be fixed. That is, one unit of dairy quota can be used to produce
kC units of Comte´ cheese or kE units of Emmental cheese. The inverse demand function for Comte´ cheese is denoted by P(.), and PE,22 denotes the price of Emmental in period 22. To capture the opportunity cost of time, we assume that the revenue from selling Emmental two periods earlier than Comte´ can grow at the interest rate INT22, expressed in per cent at 6 months. We denote by P˜E,22the lagged price of Emmental as of the current period, that is,P˜E,22¼PE,22(1þINT22/100).
CIGC is assumed to behave as a tentative monopolist seeking to maximise net returns to milk quota ownership in the Comte´ region.
We first assume that CIGC acts as a joint profit-maximising cartel, subject to the quota constraint. It is further assumed that CIGC has perfect foresight of the future demand conditions in the Comte´ market and knows the cost function
C. CIGC’s allocation problem in period 22 can thus be written as
max
whereCi, i[{1,2} denotes the first derivative ofC with respect to itsith argument. This optimisation condition can be rewritten as
MRðQCÞ ¼ kE kC ~
PE;2þfðQCÞ; ð3Þ
where MR denotes the marginal revenue function for Comte´ and
fðQCÞ ¼C1 QC;kE
It is easy to show from the convexity ofCthatfis a non-decreasing func-tion ofQC.17
Suppose now that CIGC does not exercise its full monopoly power, so that, following the NEIO paradigm, the market-level, imperfectly competitive
equilibrium is described by an equation of the type
PMRðQCÞ ¼ kE kC ~
PE;2þfðQCÞ; ð4Þ
with PMR(QC) denoting theperceivedmarginal revenue schedule. Following Bresnahan (1982), it is convenient to write the function PMR (QC) as a convex combination of the market inverse demand P(QC) and the true marginal revenue MR(QC), that is,
PMRðQCÞ ¼ ð1uÞPðQCÞ þuMRðQCÞ ð5Þ
for someu[[0,1]. The weighting parameterucan then be interpreted as an overall degree of non-competitiveness, as suggested in Hyde and Perloff (1995).18 It is referred to in the NEIO literature as the market power or conduct parameter, and is equal to zero if the industry is competitive and to 1 if the industry behaves as a monopolist. Intermediate values ofucorrespond to market equilibria between perfect competition and pure monopoly. The parameteruis directly related to the Lernex indexLof imperfect competition for this industry, u¼LjhCCj, wherehCCdenotes the own-price elasticity of demand for Comte´ cheese.
Equations (4) and (5) can be combined and rearranged to yield the pricing equation
PC 1þ
u hCC
¼kE
kC ~
PE;2þfðQCÞ; ð6Þ
wherePCdenotes the price of Comte´. The coefficientkE/kCon the lagged price of Emmental reflects the difference in milk content between the two cheese varieties, whereas the non-decreasing functionf(QC) represents the marginal cost difference between Comte´ and Emmental (i.e. the cost of producing one more unit of Comte´ andkE/kCfewer units of Emmental).
The idea behind the cost specification on the right-hand side of equation (6) is that, by producing one unit of Comte´ cheese, the industry forfeits the rent that it would earn if it produced and sold the quantity of Emmental cheese cor-responding to the amount of EU milk quota used to produce this unit. There-fore, in equilibrium, the industry equates the perceived marginal revenue from producing an additional unit of Comte´ cheese to the marginal opportunity cost of doing so, which is equal to the marginal revenue forfeited from potential sales of Emmental cheese plus the difference in marginal costs, C12(kE/
kC)C2. This opportunity cost specification assumes that the milk content of both cheese varieties is fixed and does not depend on the quantities produced, an assumption parallel to the traditional fixed-proportions assumption ubiqui-tous in the NEIO literature. Given that slightly more milk is used to produce 1
kg of Emmental than 1 kg of Comte´, the coefficientkE/kCshould be close to, but less than, 1. More precisely, the productivity of milk in Comte´ is about 10 per cent (i.e. 10 kg of Comte´ can be made from 100 kg of milk), whereas that of Emmental ranges between 8 and 9 per cent. Thus,kE/kCis expected to be between 0.8 and 0.9.19
4. Estimation strategy
Using time-series data on the price and quantity of Comte´ cheese, we esti-mated equation (6), together with the demand equation, in order to determine jointly the demand parameters, the parameters of the opportunity cost function and the market power parameter,u. As is apparent from equation (6), identi-fication ofurelies on temporal variation in the demand elasticity, and so we need to introduce demand shifters that also shift the demand elasticity.
4.1. Demand
The elasticity shifters included in the demand equation are the price of Emmental cheese, income and quarterly dummies. By ‘elasticity shifters’, we mean variables that interact with the price of Comte´ cheese on the right-hand side of the demand equation (quantity being the dependent variable), and therefore allow the calculated demand elasticity to vary across time periods.20 To our knowledge, this is the first NEIO study to incorporate three or more different elasticity shifters in the demand equation.21
The demand for Comte´ cheese is specified as
qC¼a1þ
X4
i¼2
aiSiþ b1þ
X4
i¼2
biSiþbEPEþbII
!
PCþgPEþdIþed; ð7Þ
whereqCdenotes the per capita quantity of Comte´ cheese sold,Siare quarterly dummy variables for the 2nd, 3rd and 4th quarters, respectively,PCandPEare the real wholesale prices of Comte´ and Emmental, respectively, andIdenotes the real per capita net disposable income. Prices and income are adjusted for inflation using the general consumer price index.
This demand specification has the desirable property of allowing each of the shifters (price of Emmental, income and quarter) to change demand additively
andchange the demand slope. This flexibility is necessary to avoid spurious effects of those shifters on the implied demand elasticity.
19 Colinetet al.(2006) assumed that 10.8 and 12 litres of milk are required to produce 1 kg of ripened Comte´ and Emmental, respectively. This would correspond to a value ofkE/kCequal to 0.9
exactly.
20 In addition, the demand elasticity may vary due to functional form assumptions.
To assess the importance of functional form assumptions, we also estimated a log – log version of equation (7):
logqC¼a1þ
X4
i¼2
aiSiþ b1þ
X4
i¼2
biSiþbElogPEþbIlogI
! logPC
þglogPEþdlogIþud: ð8Þ
4.2. Supply
The supply relationship is given by equation (6). We further assume that the functionf(QC) is linear inQC, so that the equation used for estimation is
PC 1þ
u hCC
¼c0þc1PE;2 1þ
INT2
100
þc2QCþes; ð9Þ
where the demand elasticity hCCis a function of the demand parametersbi (i[f1, 2, 3, 4g),bE andbIderived from specification (7) or (8) andc0,c1 andc2are cost parameters to be estimated.22
The pricesPCandPE,22are expressed in real terms adjusted for inflation and therefore the interest rate INT22 represents the real interest rate, also adjusted for inflation. This real interest rate is computed from the equation 1þi¼(1þINT)(1þp), where i denotes the nominal interest rate and p
the rate of inflation (Perloff, 2009).
The presence of the termc2QCon the right-hand side of equation (9) allows us to test for scale in the conversion from Emmental production to Comte´ pro-duction. In particular, if farms were heterogeneous in their ability to shift from Emmental to Comte´ production, we would expect the coefficientc2to be posi-tive. As argued in Section 3, the coefficientc1should reflect the difference in milk content between Comte´ and Emmental, and is expected to range between 0.8 and 0.9.
4.3. Choice of instruments
The contemporaneous and lagged prices of Emmental cheese were used as instruments in the empirical estimation procedure. The assumption that these prices are exogenous to the demand equation (7) or (8) and the supply relation (9) is justified by the fact that entry is free in the Emmental market, so that the Emmental market can be assumed to be competitive. In addition, if generic milk is transformed into Emmental cheese according to
22 Lagged values of the interest rate were added as explanatory variables in the empirical specifi-cation off(QC), to capture the fact that some costs are incurred in earlier periods. The associated
a fixed-proportion, constant-returns-to-scale technology, as assumed, then the exogeneity of the Emmental price is satisfied as long as random shocks to the demand for Comte´ cheese and to its supply relation are uncorrelated with the equilibrium price of generic milk, which under the milk quota system is determined by the available quota and the total milk demand. These random shocks in the Comte´ market may potentially affect the equili-brium price of generic milk in two ways: by shifting the total supply of generic milk or the demand for dairy products other than Comte´ cheese. We argue that both effects should be negligible, given that the milk market can be considered European-wide. First, even though random shocks to the demand for Comte´ or its supply relation affect the quantity of milk quotas used for Comte´ pro-duction, and therefore that available to produce generic milk, this is unlikely to affect the total milk supply, since Comte´ represents about 2 per cent of the total milk collected in France. Second, random shocks to the price of Comte´ may shift the demand for substitutes of Comte´, but again this is unlikely to affect the derived demand for milk (and therefore its equilibrium price), because substitutes for Comte´ cheese represent a relatively small share of total milk use in France and in the EU.
Other instruments include the seasonal dummies and the income variable.
4.4. Data frequency
Most of the variables needed, except income and population, are available with a monthly frequency. Since the production plan sets production caps for a one-year period, it seems to call for the use of annual data. Such an approach, however, would not only considerably reduce the sample size (in the present case, to 21 observations), but would also ignore specific provisions of the production plan. First, the plan can be revised during the year (Re´pub-lique Franc¸aise, 1977). Second, CIGC can adopt exceptional compulsory or voluntary measures, such as withdrawals of eligible milk or unripe cheese wheels, whenever the market situation is deemed unfavourable. Although compulsory withdrawals have been exceptional, voluntary (but financially encouraged) withdrawals have been used more frequently. The possibility of adjustments to the production plan during the year may therefore partly justify the use of higher frequency data.
frequency was low enough to assume that all cheese wheels are ripened within one period.
Taking all these considerations into account, we chose to use quarterly data. Although this does not totally solve the issue of endogenous ripening, it should be less critical than with monthly data, especially because the bulk of the pro-duction is sold between 6 and 8 months of age, with a tendency towards longer ripening times at the end of the period of investigation.23
5. Data description
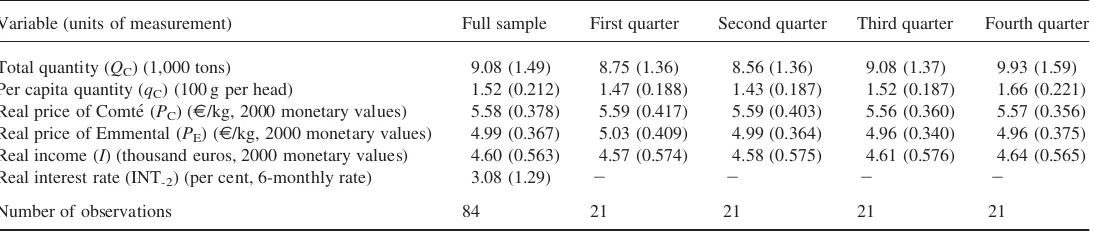
The data cover the period from the first quarter of 1985 to the fourth quarter of 2005. The starting date was chosen as 1985 because the EU milk quota scheme was introduced in April 1984. Industry data on the wholesale price and mar-keted quantity of Comte´ cheese comes from CIGC. It is not possible to dis-tinguish between domestic and export sales. However, given the very small share of exports (about 5 per cent), total quantity should be a reasonable proxy for sales in the French market. Industry data on the wholesale price of Emmental cheese comes from SIGF (Syndicat Interprofessionnel du Gruye`re Franc¸ais).24 The net disposable national income for France was obtained from Eurostat, as was the population variable used to construct the per capita Comte´ cheese consumption and net disposable income variables. The general CPI for France was obtained from the OECD database, and the nominal interest rate from theBanque de Francewebpage. Summary statistics are reported in Table 1.
6. Estimation and results
The simultaneous equation system consisting of the demand equation (7) or (8) and the pricing equation (9) was estimated using the iterative non-linear optimal generalised method of moments (Hansen, 1982).
Instruments for equation (7) or (8), denoted by the row vectorZd, include a constant, the logarithms ofPEandI, seasonal dummies, and a series of inter-action terms constructed fromP˜E,22to instrument for each of the endogenous regressors involving the price of Comte´. Instruments for equation (9), denoted by the row vectorZs, include a constant,P˜E,22, the logarithms ofPEandI, and seasonal dummies. The weighting matrix is constructed allowing for hetero-scedasticity and autocorrelation up to three lags and assuming that the error termsed(ud) andesare uncorrelated.
23 To test the sensitivity of estimates to the choice of data frequency, a model using monthly data was also estimated. Income, which was available only at a quarterly frequency, was distributed over the months within each quarter. Estimates were close to those obtained using quarterly data, and conclusions regarding market power were unaffected.
Table 1. Summary statistics: sample means (standard deviations in parentheses)
Variable (units of measurement) Full sample First quarter Second quarter Third quarter Fourth quarter
Total quantity (QC) (1,000 tons) 9.08 (1.49) 8.75 (1.36) 8.56 (1.36) 9.08 (1.37) 9.93 (1.59)
Per capita quantity (qC) (100 g per head) 1.52 (0.212) 1.47 (0.188) 1.43 (0.187) 1.52 (0.187) 1.66 (0.221)
Real price of Comte´ (PC) (E/kg, 2000 monetary values) 5.58 (0.378) 5.59 (0.417) 5.59 (0.403) 5.56 (0.360) 5.57 (0.356)
Real price of Emmental (PE) (E/kg, 2000 monetary values) 4.99 (0.367) 5.03 (0.409) 4.99 (0.364) 4.96 (0.340) 4.96 (0.375)
Real income (I) (thousand euros, 2000 monetary values) 4.60 (0.563) 4.57 (0.574) 4.58 (0.575) 4.61 (0.576) 4.64 (0.565) Real interest rate (INT-2) (per cent, 6-monthly rate) 3.08 (1.29) 2 2 2 2
Number of observations 84 21 21 21 21
Pierre
R.
Me
For the system consisting of (7) and (9), we denote
e¼ ed
es
and Z¼ Zd 0 0 Zs
:
The moment conditions used for estimation are
E eð jZÞ ¼0; ð10Þ
whereEdenotes the expectation operator. The vector of unknown model par-ameters is denoted byl¼(a1,a2,a3,a4,b1,b2,b3,b4,bE,bI,g,d,c0,c1,c2,
u). Using bold letters to denote the sample equivalents of each random
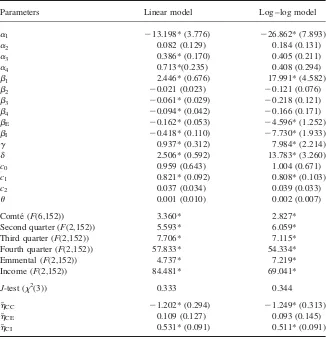
Table 2. Parameter estimates obtained from the iterated NLOGMM estimation
Parameters Linear model Log – log model
a1 213.198* (3.776) 226.862* (7.893)
a2 0.082 (0.129) 0.184 (0.131)
a3 0.386* (0.170) 0.405 (0.211)
a4 0.713*(0.235) 0.408 (0.294)
b1 2.446* (0.676) 17.991* (4.582)
b2 20.021 (0.023) 20.121 (0.076)
b3 20.061* (0.029) 20.218 (0.121)
b4 20.094* (0.042) 20.166 (0.171)
bE 20.162* (0.053) 24.596* (1.252)
bI 20.418* (0.110) 27.730* (1.933)
g 0.937* (0.312) 7.984* (2.214)
d 2.506* (0.592) 13.783* (3.260)
c0 0.959 (0.643) 1.004 (0.671)
c1 0.821* (0.092) 0.808* (0.103)
c2 0.037 (0.034) 0.039 (0.033)
u 0.001 (0.010) 0.002 (0.007)
Comte´ (F(6,152)) 3.360* 2.827* Second quarter (F(2,152)) 5.593* 6.059* Third quarter (F(2,152)) 7.706* 7.115* Fourth quarter (F(2,152)) 57.833* 54.334* Emmental (F(2,152)) 4.737* 7.219* Income (F(2,152)) 84.481* 69.041*
J-test (x2(3)) 0.333 0.344
h¯CC 21.202* (0.294) 21.249* (0.313)
h¯CE 0.109 (0.127) 0.093 (0.145)
h¯CI 0.531* (0.091) 0.511* (0.091)
Standard errors are indicated in parentheses. The reportedF-statistics relate to the joint significance of regressors that include the variable of interest. The third part of the table reports statistics for theJ-test of overidentifying restrictions. The last part reports the implied own-price, cross-price and income elasticities of demand at the mean of the sample.
variable, the estimateslˆ were chosen so as to minimise
QT¼
1
Te
0Z ˆS1Z0e ;
whereTdenotes the sample size. The weighting matrixSˆwas estimated recur-sively as the HAC Newey – West estimate of
S¼ 1
T
XT
i¼1
XT
i¼1
E Zi0eie0jZj
h i
:
The results from estimating parameterslusing the linear and double-log demand specifications are displayed in Table 2. Reported standard errors are heteroscedasticity-robust and corrected for autocorrelation with three lags according to the Newey and West (1987) procedure. A three-lag specifi-cation is chosen because the production plan is adopted on a yearly basis, and therefore the quantity marketed in each quarter is likely to be correlated with that marketed in the other quarters of the same year. Hansen’s (1982)J-test of over-identifying restrictions fails to reject the model or the set of stochastic assumptions (10) used for identification. In particular, the exogeneity of the contemporaneous and lagged prices of Emmental to demand and the supply relation cannot be empirically rejected.
6.1. Demand estimates
The implied own-price, cross-price and income elasticities, evaluated at the mean of the sample, all have the expected signs and reasonable magnitudes, and are consistent between the two models.25The own-price and income elas-ticities of demand are statistically significant in the two models. Although the implied cross-price elasticity is not significant at the sample mean, we can reject the null hypothesis that bE¼g¼0 in the two models, at the 5 per
cent significance level.
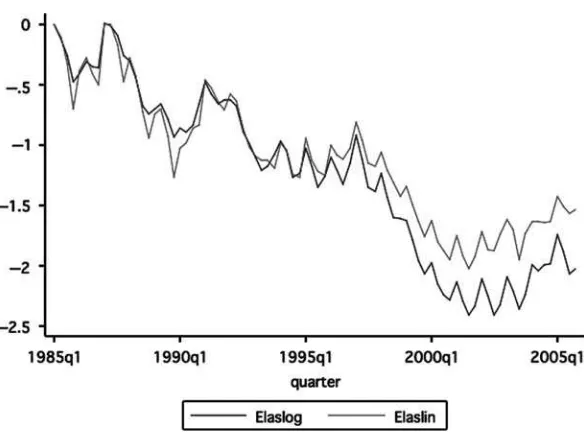
The implied own-price elasticity of demand at the sample mean is21.202 for the linear model and 21.249 for the double-log model, which seem reasonable given available elasticity estimates for the entire cheese group in France (e.g. 20.83 according to Combriset al.(1998);20.648 for the com-pensated demand elasticity (Niche`le, 2003)). These figures are also consistent with the estimate of21.28 reported in Colinetet al.(2006) for the own-price elasticity of demand for Comte´ cheese. The temporal variation in the own-price elasticity of demand is shown in Figure 1, and is consistent between the two models. The secular trend in the absolute elasticity of demand has been increasing over the 20-year period, with a slight downward adjustment
in the last 3 years. Overall, demand for Comte´ appears to have become more elastic over time.
All demand shifters included in the demand specifications (7) and (8) are sig-nificant, based on theF-tests reported in the second part of Table 2. Therefore, seasonality, the price of Emmental and the income variable all seem to affect demand. Although the separate effects of the Emmental price and income shif-ters on the intercept and the slope of demand are statistically significant, this is not always the case for the quarterly shifters taken individually. However, when tested for their joint effect on the intercept and the slope, all three seasonal effects taken individually are highly significant, particularly the fourth-quarter effect. Furthermore, the signs of the seasonal effects are consistent across the two tested models. In particular, demand intercepts are larger and demand slopes steeper, during the last three quarters, compared with the baseline first quarter. More interestingly, we confirm statistically that demand for Comte´ cheese reaches a peak during the fourth quarter, a trend that is well understood by industry representatives and can be attributed to increased consumption during the Christmas holiday period. This conclusion can be drawn by conduct-ing pairwise tests that compare, for any two seasons, thecombinedeffects of the slope and intercept seasonal dummies on the quantity demanded, the price of Comte´ being set at its sample mean.26
Figure 1. Own-price elasticities derived from the log – log (elaslog) and linear (elaslin) models.
26 For instance, to see whether demand was significantly higher in the fourth quarter than in the third, other factors being held constant, we tested the hypothesis
H0:a4þb4
PC ða3þb3
PCÞ ¼0 against H1:a4þb4
PC ða3þb3
6.2. Cost and conduct estimates
Cost and conduct estimates seem plausible and are only marginally sensitive to the demand specification.
The coefficient of the lagged price of Emmental cheese,c1, is highly signifi-cant and is smaller than 1 under the two demand specifications. We can reject the hypothesis thatc1¼1, based on the testc1¼1 vs.c1,1, at the 5 per cent significance level. The point estimates are within the expected range of [0.8, 0.9] and the value of 0.9 lies within the 95 per cent confidence interval.
Thep-values for the estimates of coefficientc2(0.278 for the linear speci-fication and 0.240 for the double-log specispeci-fication) imply that the hypothesis of constant returns to scale in the conversion from Emmental to Comte´ cannot be rejected, at the 5 per cent significance level. In terms of the functionf, this means that we fail to reject the hypothesis thatdf/dQC¼0, at least locally. Given that the milk processing and ripening stages for the two cheeses are more likely to involve constant returns to scale than farm operations, this result may be an indication of a certain farm homogeneity among those pro-ducers who have shifted from Emmental to Comte´ over the period of investi-gation. In other words, the result could mean that farm heterogeneity is not sufficient, around the observed equilibrium, to link the observed increase in the quantity of Comte´ cheese produced to higher production costs.
Finally, and most importantly, given the purpose of this article, the market power estimate is positive, small and statistically insignificant in both models. The null hypothesis of perfect competition in the Comte´ market cannot be rejected at the 5 per cent significance level, based on the testu¼0 vs.u.
0. In contrast, monopoly is easily rejected, based on the testu¼1 vs. u,
1. Market power estimates are well within values traditionally considered to be close enough to perfect competition not to raise economic efficiency con-cerns (Sexton and Zhang, 2001).27
7. Conclusion
In this article, an NEIO approach was used to measure the degree of seller market power in the French Comte´ cheese industry, characterised by vertical contracts between milk producers and ripening facilities, and a government-sanctioned supply control scheme that has caught the attention of the French antitrust authority. The inclusion of a set of elasticity shifters in the
demand specification permitted identification of the market power parameter. One original feature of the model lies in the cost specification, which includes the price of Emmental cheese, to take account of the EU milk quota policy and the substitutability between the two cheeses in production. Since milk quota is likely to create a wedge between the marginal cost of milk and its market price, defining the opportunity cost of producing Comte´ in terms of the net revenue forgone from potential sales of Emmental, rather than a sum of input expenses, is critical to avoid attributing any significant price – cost margin solely to market power exercised at the level of the Comte´ industry.
The hypothesis of perfect competition could not be rejected. In contrast, monopoly was clearly rejected. Elasticity, cost and market power estimates were robust to the demand specification.
This study sheds serious doubt on the ability of the observed supply control scheme to allow the Comte´ cheese industry to exert significant market power towards buyers. Small values of the market power parameter imply that the associated deadweight loss has been negligible over the period. This con-clusion contrasts with the assumptions underlying the ruling of the French antitrust authority and provides some reassurance regarding the efficiency of PDO markets that allow collective marketing arrangements.
A possible interpretation of the lack of measurable market power in the Comte´ market is that the control exercised by the governmental entities in charge of approving the yearly production plan effectively prevents CIGC from restricting supply far from the competitive level. Unless explicitly approved through an administrative procedure that involves the ministerial departments in charge of agriculture and competition, the production plan is not legally enforceable by CIGC and becomes subject to scrutiny by the
Conseil de la concurrence(Re´publique Franc¸aise, 1977). While it is difficult to infer, from purely anecdotal evidence, the extent of governmental control exercised through this administrative process over the period of investigation, it is noteworthy that theConseilwrote, in its 1998 ruling:28
In the period preceding the decision of 4 March 1995, [CIGC], having acknowledged in a decision of 6 July 1993 the refusal of the Ministry of Finance to approve a production limitation,29had therefore deemed necess-ary to stimulate sales through promotion.
The fact that the Ministry of Finance explicitly refused any production limit-ation in 1993 suggests that later approvals were possible only because the pro-posed quantity was sufficiently close to the competitive quantity.30CIGC has
28 Translated from French by the author.
29 The Ministry of Finance is in charge of competition policy.
30 While the government would not have sufficient information to determine precisely the competi-tive quantity in each period, our results suggest that the monopoly quantity would be signifi-cantly lower than the competitive one. Therefore, it is unlikely that the industry could have obtained any government agreement on a quantity close to the monopoly quantity. Using the linear demand specification and setting exogenous factors at their sample mean, we calculated the average quarterly competitive quantity to beQCc8,789 tons, and the monopoly quantity
also faced the credible threat that individual producers might bring an antitrust case to theConseil, as occurred for the 1998 ruling, and more recently regard-ing proposed changes in the production requirements for Comte´ cheese (Conseil de la Concurrence, 2007).
One element that our result fails to explain is the notable attractiveness of Comte´ production for dairy farmers located in the eligible region. The rate of satisfaction of new potential entrants (i.e. the ratio of newly attributed pro-duction rights to the total demand for new propro-duction rights each year) is about 10 per cent, suggesting that the production of Comte´ milk is more profit-able for milk producers than that of generic milk (Colinetet al., 2006). One explanation to this fact is that the share of the milk quota rent that accrues to dairy farmers could be larger in the Comte´ sector than in other sectors. This is plausible given the existence of purchasing contracts between dairy cooperatives (still mostly owned by milk producers) and ripening facilities, which are negotiated through CIGC. Such industry-wide contracts have the ability to mitigate the bargaining power of ripeners and therefore to reallocate a larger share of the quota rent to milk producers than elsewhere in the dairy sector, where processors are free to exercise their bargaining power. In such a scenario, it becomes necessary for CIGC to limit the entry of new milk produ-cers into Comte´ production, in order to maintain the quota rent at a level com-parable to that in other sectors. Excessive entry into the Comte´ market would mechanically result in a decrease in the price of ripened Comte´ cheese, which would erode the size of the milk quota rent available to the industry as a whole and to milk producers in particular.
Appendix
A.1. Data treatment
costs.31 This seems reasonable since the method used by CIGC during the 1990s to retrieve the producer price net of transportation cost was to deflate all prices by a factor of 10 per cent.32
For Emmental cheese, we used the wholesale price of Emmental Est-Central rather than that of generic Emmental, because Emmental Est-Est-Central was the main variety produced in the Comte´ eligible region during the period.33The share of Emmental cheese sold in grated form increased from 18 per cent in 1985 to 57 per cent in 2004. Grated Emmental cheese is mainly used as an ingredient in cooking and is not a good substitute for Comte´ cheese, which is traditionally consumed by itself (Comte´ cheese was never sold in grated form during the study period). Therefore, only non-grated Emmental cheese was included in the calculation of the average price of Emmental. A price gap due to a change in methodology occurs between December 1989 and January 1990. The series was corrected by the same method as for the Comte´ price series. This amounted to inflating prices from January 1985 to December 1989 by 17.5 per cent.34A second, minor adjustment had to be made to account for a change in methodology that occurred in January 2001.
Finally, the population variable, used to normalise consumption and income, did not come at a quarterly frequency. Therefore, we replicated the yearly observation in each quarter.
A.2. Derivative of the functionf
The functionfis defined as
fðQCÞ ¼C1 QC;kE
MQC
kC
kE
kC
C2 QC;kE
MQC
kC
:
31 This choice was made because there are more observations after the break than before, so that fewer observations had to be adjusted.
32 This latter price series was not available. Furthermore, the 10 per cent deflation was based on a cost estimation made by ripening facilities. Since the deflated price was then used to calculate the contractual price of unripe cheese, there was an incentive on the part of ripening facilities to overstate the cost of transportation in order to pull down the price of unripe cheese. 33 The statistical series for Emmental Est-Central and Emmental were merged by theSyndicat
Interprofessionnel du Gruye`re Franc¸aisin January 1990. By that date, both varieties had become
almost perfect substitutes in consumption and there was no distinguishable price gap between the two. The price series is for non-grated Emmental cheese.
To prove thatfis a non-decreasing function ofQC, we note that
where the last inequality follows from the convexity ofC.
Acknowledgements
The author thanks Richard Sexton, James Chalfant, Arthur Havenner, Colin Carter, Daniel Sumner, four anonymous referees and the editor for helpful comments. All errors are mine. Financial support from the French Ministry of Agriculture is greatly acknowledged.
References
Arnade, C. and Pick, D. (1999). Alternative approach to measuring oligopoly power: a wheat market example.Applied Economics Letters6: 195 – 197.
Bresnahan, T. (1982). The oligopoly solution concept is identified.Economics Letters10: 87 – 92.
Colinet, P., Desquilbet, M., Hassan, D., Monier-Dilhan, S., Orozco, V. and Re´quillart, V. (2006). Comte´ case study. In:Economics of Food Quality Assurance and Certification Schemes Managed Within an Integrated Supply Chain. Seville, Spain: European Com-mission, Joint Research Centre, 69 – 79.
Combris, P., Niche`le, V., Robin, J. M. and Xime´nes, V. (1998). Consommation et demande de produits laitiers en France. Working paper. INRA ESR, Ivry, France.
Comite´ Interprofessionnel du Gruye`re de Comte´ (2006). Plan de Campagne 2006 – 2007. Internal Document, Poligny, France.
Comite´ Technique du Comte´ (2005). Guide des bonnes pratiques d’hygie`ne pour la fabri-cation et l’affinage du Comte´. Internal Document, Poligny, France.
Conseil de la Concurrence (1998). De´cision n898-D-54 du 8 juillet 1998 relative a` des pra-tiques releve´es dans le secteur de la production du gruye`re de Comte´. http://www. conseil-concurrence.fr/user/avis.php?avis=98d54. Accessed 1 January 2009.
Conseil de la Concurrence (2007). De´cision n807-D-10 du 28 mars 2007 relative a` une plainte a` l’encontre du Comite´ interprofessionnel du gruye`re de Comte´. http://www. conseil-concurrence.fr/user/avis.php?avis=07d10. Accessed 1 January 2009.
Council of the European Union (2006). Council Regulation (EC) No 510/2006 of 20 March 2006 on the protection of geographical indications and designations of origin for agri-cultural products and foodstuffs.Official Journal of the European Union L93: 12 – 25.
Crespi, J. M. and Sexton, R. J. (2003). Concurrence, coope´ratives de producteurs et Mar-keting Orders aux E´ tats-Unis.E´ conomie Rurale277 – 278: 135 – 151.
Hansen, L. P. (1982). Large sample properties of generalized methods of moments estima-tors.Econometrica50: 1029 – 1054.
Hyde, C. E. and Perloff, J. M. (1995). Can market power be estimated?Review of Industrial Organization10: 465 – 485.
Josling, T. (2006). The war on terroir: geographical indications as a transatlantic trade con-flict.Journal of Agricultural Economics57: 337 – 363.
Kaiser, H. M. and Suzuki, N. (eds) (2006).New Empirical Industrial Organization and the Food System. New York: Peter Lang Pub Inc.
Lucatelli, S. (2000). Appellations of origin and geographical indications in OECD member countries: economic and legal implications. Unpublished report. Paris, France: Organ-isation for Economic Co-operation and Development (OECD).
Ministe`re de l’Agriculture et de la Peˆche (2005). Les quotas laitiers en Franche-Comte´.
Agreste Franche-Comte´105, Besanc¸on, France.
Ministe`re de l’Agriculture et de la Peˆche (2007a). La baisse du prix du lait se poursuit en 2005.Agreste Franche-Comte´119, Besanc¸on, France.
Ministe`re de l’Agriculture et de la Peˆche (2007b). Les chiffres du lait 2005. Agreste Franche-Comte´118, Besanc¸on, France.
Newey, W. K. and West, K. D. (1987). A simple, positive semi-definite, heteroskedasticity and autocorrelation consistent covariance matrix.Econometrica55: 703 – 708.
Niche`le, V. (2003). Health information and food demand in France. In Chern, W. S. and Rickertsen, K. (eds), Health, Nutrition and Food Demand. Wallingford, UK: CAB International, 131 – 152.
Perloff, J. M. (2009).Microeconomics. Boston, MA: Pearson /Addison-Wesley.
Re´publique Franc¸aise (1977). Arreˆte´ du 23 mars 1977 portant homologation d’un accord conclu dans le cadre de l’organisation interprofessionnelle laitie`re. Journal Officiel de la Re´publique Franc¸aise du 26 mars 1977, France.
Re´publique Franc¸aise (2007). De´cret du 11 mai 2007 relatif a` l’appellation d’origine con-troˆle´e “Comte´”. Journal Officiel de la Re´publique Franc¸aise du 12 mai 2007, France.
Sexton, R. J. and Zhang, M. (2001). An assessment of the impact of food industry market power on U.S. consumers.Agribusiness17: 59 – 79.
Syndicat Interprofessionnel du Gruye`re Franc¸ais (2004). Statistiques fromages a` paˆte presse´e cuite 2004. Internal document, Paris, France.
Trade liberalisation, agricultural
productivity and poverty in the
Mediterranean region
Nadia Belhaj Hassine
Faculty of Economics and Management of Nabeul, Tunisia
Magda Kandil
International Monetary Fund, Washington, DC, USA
Received August 2007; final version received January 2009*
Summary
A widely held view in the economic literature is that productivity growth is an import-ant pathway through which trade liberalisation may alleviate poverty. This paper explores the link between trade openness, agricultural productivity growth and poverty reduction in a panel of Mediterranean countries. Technical efficiency scores and total factor productivity indexes are computed using the latent class sto-chastic frontier model to account for cross-country heterogeneity in farming pro-duction technologies. The relevance of agricultural productivity gains for poverty reduction is investigated through joint estimation of real per capita GDP growth and inequality changes in a dynamic panel setting. The findings illustrate the positive effects of openness on farming efficiency and productivity and give strong support to the view that agricultural productivity growth is a channel for poverty alleviation.
Keywords: openness, agriculture, productivity, poverty, latent class model
JEL classification: C24, C33, D24, F43, Q17
1. Introduction
The impact of international trade on economic growth and poverty is a central issue in the debate surrounding globalisation. Despite the controversy about the causal link between trade openness and economic performance in the lit-erature, the virtues of trade’s contributions to faster growth and poverty alle-viation are generally recognised.1 More recently, the Uruguay Round commitments and the ongoing Doha Round of agricultural trade negotiations
*Review coordinated by Paolo Sckokai.
1 See Winterset al.(2004) and Nissanke and Thorbecke (2006) for a survey of recent evidences.
doi:10.1093/erae/jbp002
Advance Access Publication 25 March 2009
refocused attention on the economic linkages between trade, agricultural development and poverty and gave a new impetus to the re-examination of the actual contribution of agricultural growth to poverty reduction. The emphasis given to agricultural development goes far beyond its direct benefit to rural poor livelihoods. Agriculture is convincingly argued to have considerable potential for stimulating broader economic growth through its strong linkages to the wider economy and to offer one of the most promising avenues to poverty alleviation.
The empirical evidence provided by Thirtleet al.(2003) illustrates the sig-nificant positive contribution of research-led agricultural productivity growth to poverty reduction in Africa and Asia. Ravallion and Chen (2007) emphasise the fundamental role of agricultural development in explaining China’s pro-gress against poverty and show that agriculture and rural growth are far more poverty alleviating than non-farm activities. In a cross-country study of the importance of agricultural productivity for economic development, Self and Grabowski (2007) find that agricultural technology plays a crucial role in generating growth and in improving well being. These analyses and others support the beneficial role of agricultural development for the poor.2 However, although many recognise the potential for trade to generate agricul-tural productivity gains, they confine their empirical investigations to the links between agriculture, growth and poverty.
International trade is presumed to foster productivity growth through the transfer of technology from more advanced countries, which would confer strong pro-poor benefits on recipient developing economies (Winters, 2002; Cline, 2004; Bardhan, 2006). The productivity-enhancing effects of trade have been widely documented in both macro and case studies, although mainly focusing on manufacturing and industry, with very little specific work on agriculture.3 Despite the importance of productivity in non-farm activities to sustain poverty alleviation, agricultural productivity would be of most direct interest to the majority of the poor.
The potential of trade and agricultural productivity growth to alleviate poverty will depend upon both the magnitude of overall economic growth and the change in income distribution. The dynamic productivity effects of trade liberalisation can bring about distributional changes, and concerns have been raised about the effects of adverse distributional outcomes that may offset the positive poverty alleviation implications. Although the litera-ture contributes to advancing our understanding of the complex relationships among trade openness, growth, inequality and poverty, it is difficult at present to make convincing generalisations about how productivity and international trade might interact in their effects on growth, inequality and poverty (Nissanke and Thorbecke, 2006; Harrison and McMillan, 2007). The benefits
2 See, for example, Datt and Ravallion (1998), Irzet al.(2001), Bravo-Ortega and Lederman (2005),
Christiaensenet al.(2006).
3 Evidence of a positive stimulus from exports to productivity in the industrial sector may be found
of the trade-induced agricultural growth for poverty reduction remain worthy of further investigation.
The purpose of this paper is to investigate whether agricultural productivity is an important pathway through which trade liberalisation affects the poor. To address this question, we use panel data for 14 Mediterranean countries for 1990 – 2005 to explore the links between: (i) trade openness and agricultural productivity change, and (ii) farming performance, economic growth and inequality. The countries under investigation have taken steps towards greater integration in the global economy. Indeed, their profile is commensu-rate with the paper’s objectives in many respects. First, these countries are about to start implementing a new agreement on trade in agricultural products under the EU –Mediterranean partnership and the Doha Round of the WTO agreement on agriculture. Second, agriculture is a major sector in these countries, although highly distorted because of trade barriers and protective policies.
As Mediterranean countries go ahead with liberalisation within the frame-work of the Barcelona Agreement, speculations have arisen regarding the impact of liberalisation in accelerating agricultural development via technol-ogy transfer, as well as on the potential impact of this higher agricultural pro-ductivity in enhancing growth and reducing poverty.
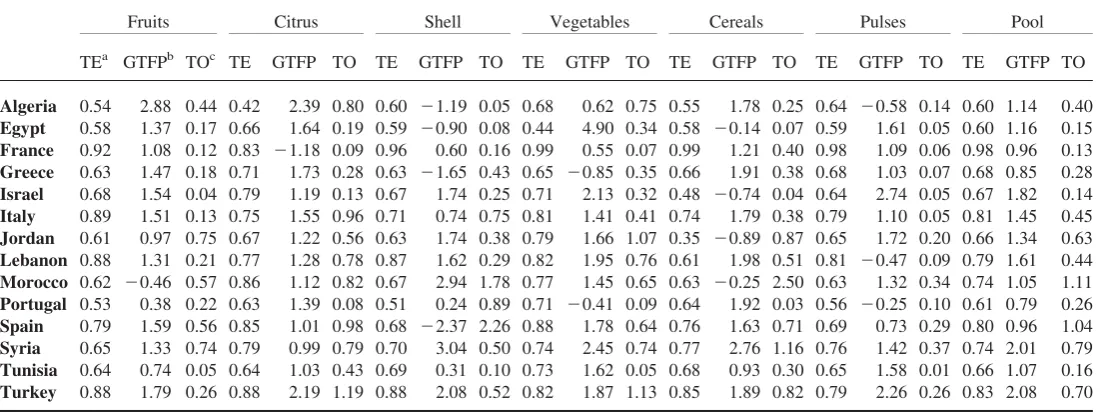
To shed some light on these issues, the paper’s analysis embraces two main objectives: (i) estimating technical efficiency (TE) and total factor pro-ductivity (TFP) growth in the Mediterranean agricultural sector, examining the role of international trade in stimulating this growth and (ii) investigating the simultaneous influence of agricultural productivity on income growth and income distribution in order to analyse its impact on poverty. The paper uses appropriate econometric techniques to address these two objectives.
The structure of the paper is as follows: Section 2 presents the methodology for the empirical investigation, Section 3 reviews the data and Section 4 reports the empirical results. Finally, Section 5 synthesises the main findings and draws some conclusions.
2. Methodology
2.1. Efficiency, productivity and the role of trade
The evolving concerns regarding food security, natural resources, rural employment and poverty have sparked a growing literature on agricultural productivity and efficiency. Among the several alternative approaches to esti-mating agricultural efficiency and multifactor productivity, stochastic frontier models have become very popular.4 In these models, all producers are assumed to use the same technology. However, farmers who operate in differ-ent regions, under various agro-climatic conditions and resource endowmdiffer-ents, might not share the same production possibilities. Ignoring the technological
differences in the stochastic frontier model may result in biased efficiency estimates, as unmeasured heterogeneity might be confounded with producer-specific inefficiency (Orea and Kumbhakar, 2004).
The model developed by Greene (2005), and applied by Abdulai and Tietje (2007), considers heterogeneity in the production process through the inclusion of firm-specific random effects. This approach helps to scrutinise inefficiency and heterogeneity. One limitation, however, is in treating hetero-geneity as an additional error component, thereby ignoring variations in the parameters of the core production frontier capturing technological differences across producers (Tsionas, 2002).
The random parameter models and the more recently proposed latent class models offer more general approaches to modelling technological hetero-geneity (Tsionas, 2002; Orea and Kumbhakar, 2004; Greene, 2005). In the random parameters formulation, heterogeneity takes the form of continuous parameter variation across producers. Besides the practical complications involved in estimating models of this kind and in analysing efficiency, allow-ing each firm to produce with different technology parameters might not appropriately reflect the fact that some producers in the sample may share the same underlying technology and that they could be efficient relative to their own-group frontier but inefficient compared with other groups using different technologies (Tsionas, 2002).
An alternative formulation that should be better suited to modelling cross-country technological heterogeneity in panel data is the latent class stochastic frontier model (LCSFM).5 This approach combines the stochastic frontier model with a latent sorting of individuals into discrete groups. Countries within a specific group are assumed to share the same production technology, but this is allowed to differ between groups. Heterogeneity across countries is accommodated through the simultaneous estimation of the probability for class membership and a mixture of several technologies.6
The latent class framework assumes the simultaneous coexistence of J different production technologies. Countries in the sample are grouped into different clusters, each using one of these technologies. The number of groups and the class membership are a priori unknown to the analyst. The technology for thejth group is specified as:
lnðyitÞ ¼lnf ðxit;t;bjÞ þnitjjuitjj j¼1;. . .;J; i¼1;. . .;N;
t¼1;. . .;T;
ð1Þ
where subscripti indexes countries,t indicates time,bjis the vector of
par-ameters for group jandyitandxitare, respectively, the output level and the
5 According to Greene (2005), the latent class model can be considered as an approximation to the random parameters model, in which heterogeneity is modelled as generated by a discrete distribution. He carried out a comparison of both methods, but failed to conclude which model is preferable.
vector of inputs. The error componentvitjjis assumed to be independently and
identically distributed (iid) N(0, snj
2) and is also independently distributed
with respect to the non-negative inefficiency componentuitjj.7
We adopt the scaled specification foruitjjby writing it as:
uitjj¼exp z0itdj
eitjj; ð2Þ
wherezitis a vector of country-specific control variables associated with
inef-ficiencies anddjis a vector of parameters to be estimated. As common in the
literature, the random variable eitjj is assumed to follow an iid half-normal
distribution.8
The unconditional likelihood for country i is constructed as a weighted average of itsJlikelihood functions, with the probabilities of class member-ship used as weights. The overall log-likelihood function can then be written as:
where LFijtis the group-specific conditional likelihood function for countryi
at timet,Q
t¼1
T
LFijt¼LFijrepresents the contribution of countryito the
con-ditional likelihood andPijis the prior probability of class membership.
An attractive feature of the latent class model is that country-specific prob-abilities of belonging to a groupjcan be obtained by conditioning these mem-bership probabilities on a set of country characteristics. These class probabilities can be parameterised as a multinomial logit form:
Pij¼
where qi is a vector of country-specific and time-invariant variables that
explain probabilities and lj is the associated group-specific vector of
par-ameters.l1is normalised to zero to ensure identification of the model.
Maximum likelihood parameter estimates of this mixture of frontier func-tions can be obtained using the expectation maximisation (EM) algorithm9 (Caudill, 2003; Greene, 2005). Conventional gradient methods may also be used.
7 Most applications of the LCSFM specify the inefficiency component as iid half-normal (Caudill, 2003; Greene, 2005). We follow Orea and Kumbhakar (2004) in allowing some systematic variation in the inefficiency function.
8 eitjjNþ(0,sej
2), where ‘þ’ refers to truncation on the left of zero.
Using the estimated parameters and Bayes’ theorem, we compute the
This procedure classifies the sample intoJdifferent groups and assigns each country to a group on the basis of the highest posterior probability.10Each country’s efficiency score can be determined relative to the frontier of the group to which that country belongs. However, this approach ignores uncer-tainty about the true partitioning in the sample. This somewhat arbitrary selec-tion of the reference frontier can be avoided by evaluating the weighted average efficiency score as follows:
technology of classjas the reference frontier.
From the estimated LCSFM, we obtain technical efficiency measures for each country. We now turn to evaluating agricultural TFP growth and to examining the contribution of international trade to productivity improve-ments. Productivity growth is composed of technological change (TC), tech-nical efficiency change (TEC) and scale economies (SE). Consequently, TFP growth can be computed from:11
GTFP¼TCþTECþSE¼@lnf
where GTFP is agricultural TFP growth,1kjis the elasticity of output for group
jwith respect to thekth input and1jis the sum of all these input elasticities for
a given groupj.12
TFP growth is explicitly related to the change in efficiency, which is assumed to be a function of a set of variables including international trade. Thus, the parameter estimates of the efficiency term in equation (2) can be
10 The number of classesJis assumed to be given. As estimation with a smaller or a larger number
of classes than the trueJmay result in biased estimates, information criteria such as the Schwarz
Bayesian information criteria (SBIC) or the Akaike information criteria (AIC) can be used to
deter-mine the appropriate number of classes. These statistics are given by: SBIC(J)¼22LF(J)þ
K(J)ln(n) and AIC(J)¼22LF(J)þ2K(J). LF(J) is the value of the likelihood function with J
classes,K(J) is the number of independent parameters to be estimated andnis the number of
observations. The decision rule is to take the model with the lowest AIC or SBIC. 11 See Kumbhakar and Lovell (2000) for the tri-partite decomposition of productivity growth. 12 Since input elasticities vary across groups, productivity change estimates are group-specific.
used to evaluate the contribution of trade openness to technological catch up (efficiency improvement) and agricultural productivity change.
2.2. Agricultural productivity, growth and poverty
Our analysis of the contribution of agriculture to poverty reduction follows the framework established in Lopez (2004). It takes into account the simultaneous influence of agricultural productivity on growth and income distribution in a dynamic panel setting, inferring their combined effects on poverty.
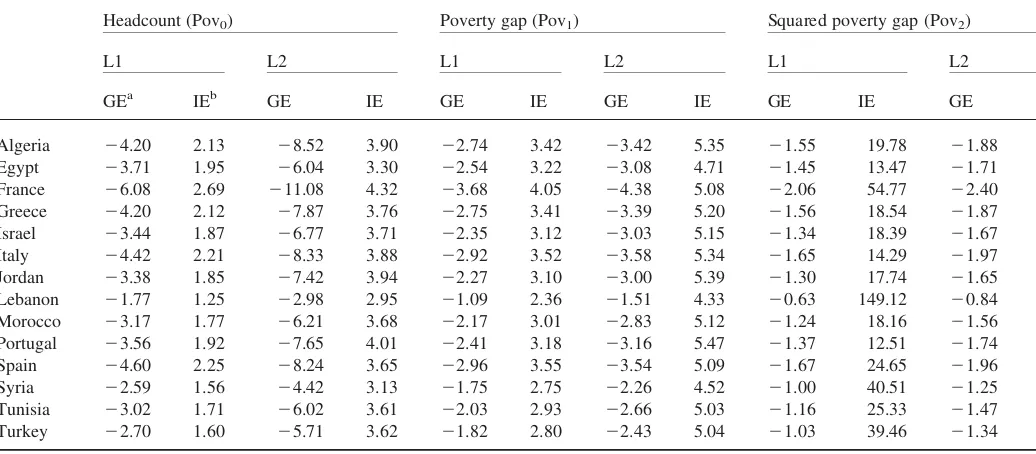
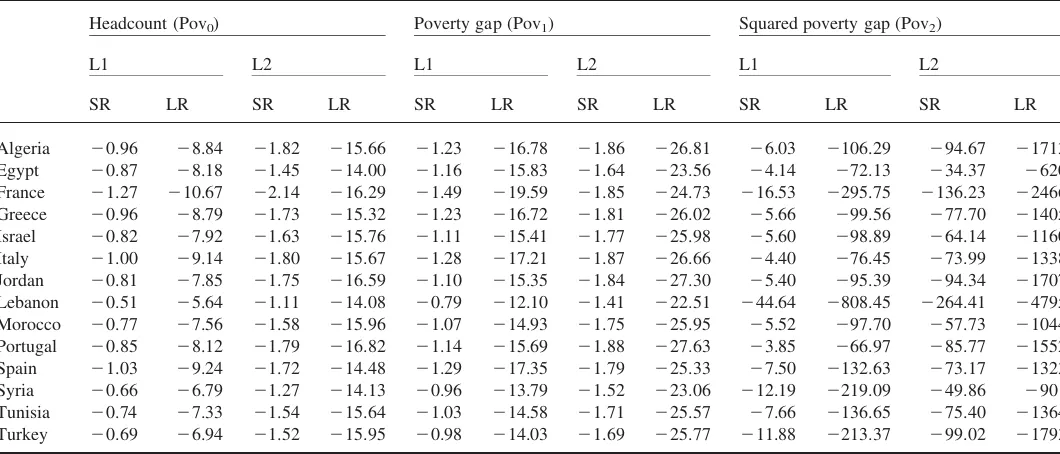
Following the common practice, poverty measures are characterised in terms of a poverty line, which is defined with respect to the average per capita income and the extent of income inequality (Lopez, 2004; Lopez and Serve´n, 2006). In this paper, we compute three common poverty measures: the headcount index (Pov0), the poverty gap index (Pov1) and the squared
poverty gap index (Pov2). The headcount index (or the ‘incidence of
poverty’) gives the proportion of the population with income below the poverty line. The poverty gap index (or the ‘intensity of poverty’) indicates how far below the poverty line the poor are. The squared poverty gap (or the ‘severity of poverty’) captures the inequality among the poor. Assuming a log-normal distribution of income, these poverty measures can be expressed as:13
where Lis the poverty line, YR is the average per capita income, F is the cumulative normal distribution and s is the standard deviation of the log-normal distribution, given by s¼p2 F21 ((Gþ1)/2), with G being the income Gini index.14
On the basis of these poverty measures, the impact of agricultural pro-ductivity growth on poverty can be decomposed into a growth component
13 See Lopez and Serven (2006) for details.
14 The poverty measures presented here belong to the Foster – Greer – Thorbecke class (Fosteret al.,
1984) given by Povu¼Ð0
L
[(L2r)/L]uh(r)dr, whereuis a parameter of inequality aversion,ris
and an inequality component and may be expressed as:
wherehandkdenote, respectively, the income growth elasticity of poverty and the inequality elasticity of poverty.
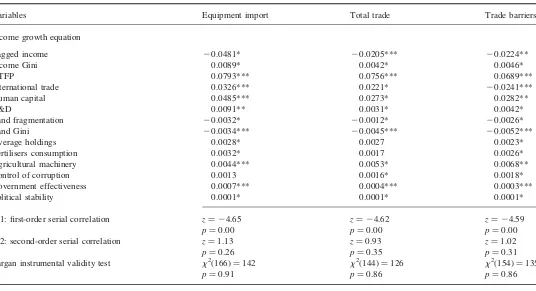
Following Lopez (2004), we estimate the contribution of agricultural pro-ductivity to both growth and inequality using the following dynamic simul-taneous model:
lnYitRlnYitR1¼clnYitR1þt0WitþglnGitþriþjtþw y
it; ð10Þ
lnGitlnGit1¼alnGit1þf0WitþxlnYitR1þqiþ6tþwgit; ð11Þ
whereWrepresents the set of explanatory variables including agricultural pro-ductivity growth,randqare unobserved country-specific effects,jand6are time-specific effects andwit
y
andwit g
are the error terms.15
Equations (10) and (11) can be employed to obtain estimates of how poverty changes would be associated with agricultural productivity growth. The dynamic structure of the system differentiates between the short- and long-run impacts of agricultural productivity on growth, inequality and poverty. The contribution of farming productivity to poverty changes in the short-term is:
@ln Pov
@GTFP ¼ tmþgfm
hþkfm; ð12Þ
whereas, in the long-run, it is:
@ln Pov
where the subscript m refers to the mth component of the vector W, which includes agricultural productivity.
3. Data
Our empirical application is based on country-level panel data referring to nine southern Mediterranean countries (SMC) (Algeria, Egypt, Israel,
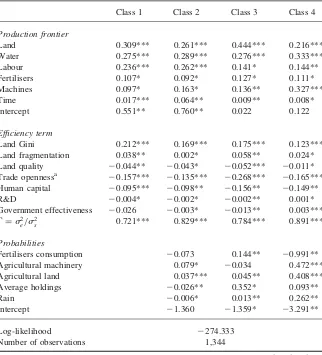
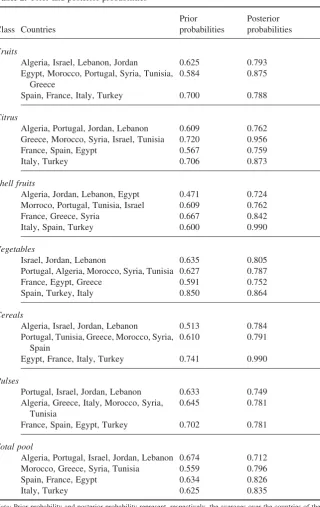
Jordan, Lebanon, Morocco, Syria, Tunisia and Turkey) involved in partner-ship agreements with the EU and the five largest EU Mediterranean countries (France, Greece, Italy, Portugal and Spain) during 1990 – 2005. Our data set includes observations on agricultural production and input use, international trade, income distribution and a number of other variables that are frequently associated with agricultural productivity and growth. These variables, whose definitions, sources and descriptive statistics are provided in Tables A1 and A2, are used to estimate the stochastic production function [equation (1)], the parametric function of the inefficiency component [equation (2)], the class probabilities [equation (4)], the productivity growth [equation (7)] and the growth and inequality [equations (10) and (11)].
The stochastic production frontier is estimated using data on production of 36 agricultural commodities belonging to six product categories (fruits, shell-fruits, citrus shell-fruits, vegetables, cereals and pulses) and on the corresponding use of five inputs (cropland, irrigation water, fertilisers, labour and machines).16 The six product categories include the main produced and traded commodities in the Mediterranean region.
The inefficiency effect model and the productivity growth equation incor-porate an array of control variables representing trade openness, human capital, land holdings, agricultural research effort, land quality and insti-tutional quality.
Three different measures are used to proxy the degree of trade openness of each country: total agricultural trade, agricultural trade barriers and agricul-tural equipment imports. Agriculagricul-tural commodities are currently protected with a complex system of ad-valorem tariffs, specific tariffs, tariff quotas and are subject to preferential agreements. The determination of the appropri-ate level of protection is a fairly complex task. The MAcMaps database con-structed by the CEPII provides ad-valorem tariffs, and estimates of ad-valorem equivalent of applied agricultural protection, taking into account trade arrangements (Boue¨tet al., 2004). Our data on agricultural trade barriers are drawn from this database.17The use of agricultural equipment imports as a measure of trade openness is explained by the fact that technology diffusion takes place mainly through capital goods. Accordingly, the productivity effects of openness might then be suitably captured by this variable.
Human capital is included to capture the impact of labour quality and the ability to absorb advanced technology. Land quality, land fragmentation and the distribution of agricultural holdings are often cited as potential sources of inefficiency in agriculture (Vollrath, 2007), and agricultural research has been shown to contribute to production efficiency and to sus-tained productivity by developing yield increasing technologies.
Institutional quality includes various institutional variables considered as indicators of a country’s governance, namely, political stability, government