h
en and Now
BILINGUAL EDUCATION
Texas Public Policy Foundation www.TexasPolicy.com
September 2009
Christine Rossell, Ph.D.
Does Bilingual
Education Work?
Executive Summary ... 3
Bilingual Education in Texas ... 4
Ef ectiveness of Bilingual Education in Texas ... 5
Cost of Bilingual Education ...11
Conclusion ...12
Recommendations ...13
References ...15
Appendix ...16
Christine Rossell, Ph.D.
Boston University
Executive Summary
Texas is a large growing state due in part to high-birth rates and individuals choosing to move to Texas from other states and countries. According to the state de-mographer, one rapidly expanding demographic is the Hispanic population, which is expected to double be-tween 2000 and 2025 from 6.6 million people to more than 13.4 million people.
The number of students in Texas public schools that are not proi cient in English* continues to grow. In the 2008-09 school year, Texas had 448,917 students in bilingual education.† Between 1992 and 2006,
Tex-as’ English Language Learner student population in-creased by 84 percent. Currently, 99 percent of the stu-dents enrolled in Texas bilingual education programs are Hispanic.
As Texas’ Hispanic population and immigrant popu-lation continues to grow, it is critically important that state leaders and policymakers look at the facts on how to best teach English to non-English speaking children.
The goal of any type of program teaching English to non-English speaking children should be learning Eng-lish. Yet, opinions vary and tempers l are over which program—bilingual education or sheltered English immersion—teaches English most ef ectively.
Sometimes the term “bilingual education” is used loosely to refer to any type of English teaching pro-gram. For the purposes of this study, bilingual educa-tion is dei ned as instruceduca-tion provided to students in their native tongue in all subjects in a self-contained classroom with other students that speak the same language. English is typically taught by the bilingual education teacher. English-as-a-Second Language (ESL) instruction is dei ned as a program of small group English instruction by a certii ed ESL teacher whose students typically spend the rest of the day in a main-stream classroom. Sheltered English immersion is
de-i ned as de-instructde-ion provde-ided to students de-in Englde-ish at a pace they can understand, taught by a trained ESL teacher, in a self-contained classroom with other stu-dents learning a second language.
Consider some key facts:
Texas is one of only four states currently requiring •
bilingual education. The other three states are Il-linois, New Jersey, and New York.
Texas is one of only 10 states that have ever re-•
quired bilingual education. The other nine states are California, Connecticut, Illinois, Indiana, Massa-chusetts, New Jersey, New York, Washington, and Wisconsin.
Bilingual education is more expensive
• ‡ than other
programs and is the least educationally ef ective. (Bilingual education is more expensive than main-streaming or sheltered English immersion, and is less ef ective.)
Students in bilingual education are not required •
to be tested on the English TAKS for the i rst three years. Testing all English Language Learners in Eng-lish is the best way to hold schools accountable for the English language acquisition of their students and an excellent way to give schools credit for the extraordinary job they do of teaching English and content such as math and science to non-English speaking students.
Recommendations:
Adopt sheltered English immersion as the default •
for Texas public schools;
Give parents choice to pick the program that best •
meets their child’s needs in learning English; and
Test all English Language Learner students on the •
English TAKS.
* Non-English speaking children are often referred to as Limited English Proi cient (LEP) or English Language Learners (ELL). † In the 2007-08 school year, Texas had 424,039 students in bilingual education. In the 2006-07 school year, Texas had 396,951 students enrolled in bilingual education. This data was provided to the author by the Information Analysis Division of the Texas Education Agency by email, as the state lumps bilingual education and ESL instruction enrollment data together.
Bilingual Education in Texas
Bilingual education, according to theory and in Tex-as state law, is instruction in which students learn to read and write in the native tongue while grad-ually transitioning to English. Although this dei ni-tion seems straightforward, much confusion exists nationwide over exactly what bilingual education is. Programs taught in English are often called bi-lingual education if the students in that program are classii ed as English Language Learners (ELL) or Limited English Proi cient (LEP).* The purpose of this
report is to explain what bilingual education actu-ally is, to show how educationactu-ally ef ective it is for ELL students, and to discuss its cost. Finally, this re-port provides recommendations for changes in Tex-as law and regulations having to do with bilingual education.
According to a recent Education Week survey, Texas is one of only four states in the U.S. that currently require bilingual education.† Moreover, Texas is one
of only 10 states that have ever required bilingual
education.‡ As shown in Appendix 1, among the
50 states, Texas is second in the total number of ELL students (638,863) and i fth in the percentage of the public school population classii ed as ELL (14.1 per-cent). None of the states having more ELL students or a higher percentage of ELL currently requires bilin-gual education, as Texas does.
Bilingual education began in Texas on June 3, 1973, with enactment of the Bilingual Education and Training Act (SB 121) mandating that all Texas public elementary schools enrolling 20 or more children of limited English ability in a given grade level provide bilingual instruction. This abolished the English-only teaching requirement then in ef ect. According to
current Texas law,§ bilingual education is dei ned as
“a full-time program of dual-language instruction that provides for learning basic skills in the primary language of the students enrolled in the program” and “incorporates the cultural aspects of the stu-dents’ backgrounds.”
The Act asserts the superiority of native-tongue in-struction and requires the districts af ected to of er:
a bilingual education program in
• elementary
school beginning with kindergarten;
a choice of bilingual education, instruction in •
English-as-a-Second-Language (ESL), or other transitional language instruction approved by the agency in middle school; and
English-as-a-Second-Language in grades
• 9
through 12.
To be clear, then, as to the dei nition: Bilingual educa-tion is instruceduca-tion provided to students in their native tongue in all subjects in a self-contained classroom with other students who speak the same language. The students are also taught English, typically by their bilingual education teacher. English-as-a-Sec-ond-Language is a pullout program with instruction in English in a small group setting taught by a certi-i ed ESL teacher. If a student certi-is labeled as becerti-ing certi-in an ESL program that indicates that the students is be-ing pulled out from a mainstream classroom. Shel-tered English immersion is instruction provided to students in English at a pace they can understand, taught by a trained ESL teacher, in a self-contained classroom with other students learning a second language. It is not mentioned in Texas law.
* The more recent term English Language Learners is used in this report. However, the term Limited English Proi cient (LEP) is also used in Texas and in the past almost exclusively.
† The other three are Illinois, New Jersey, and New York (see also Education Week and Zehr, 2007, although she errs in including New Mexico).
‡ The 10 states are California, Connecticut, Illinois, Indiana, Massachusetts, New Jersey, New York, Texas, Washington, and Wisconsin. Garcia and Morgan (1997) err in including Alaska and New Mexico in this list.
Trends in ELL Enrollment and Enrollment Ethnicity and Race
Appendix 2 shows the trends in enrollment by eth-nicity and race in Texas public schools as well as the number of students who are designated ELL from the 1992-93 school year through the 2006-07 school year.* The public school population of Texas
as of 2006-07 was about two-thirds nonwhite and 46 percent Hispanic, an increase in the Hispanic population of about 10 percentage points since 1992-93. The ELL population has increased by about 84 percent from more than 398,000 in 1992-93 to more than 731,000 in 2006-07.†
Appendix 3 shows trends by race/ethnicity in bi-lingual education enrollment and the ELL popula-tion in Texas public schools from 1992-93 through 2006-07.‡ Although 93 percent of the ELL
popula-tion is Hispanic (Appendix 3), only 32 percent of His-panics are classii ed as ELL (Appendix 2). Neverthe-less, only 2 percent of non-Hispanic students are ELL. The bilingual education enrollment is 99 percent Hispanic. Therefore, we can say that the ELL popu-lation in Texas is Hispanic and that it is the Hispanic ELL students who are in bilingual education.
In the 2006-07 school year, 396,951 students were enrolled in bilingual education in Texas (Appendix 4).§ As shown in Appendix 4, almost all the ELL stu-dents enrolled in bilingual education are in grades PK-5. This is what one would expect, given that Tex-as Education Code 29.051-29.064 states that only
el-ementary schools (with 20 or more ELL students in any language classii cation in the same grade level)
must of er a bilingual education program
begin-ning in kindergarten. Middle schools have a choice of bilingual education, instruction in English-as-a-Second Language, or some other “approved” transi-tional language program.
High schools need provide ESL only in grades 9 through 12, although there is no prohibition against of ering bilingual education. With only one percent of the bilingual education enrollment at the middle school level (grades 6, 7, 8 in Appendix 4) and al-most none at the high school level, it appears that, given a choice, schools do not opt for bilingual edu-cation. Indeed, I predict that if elementary schools were given a choice between bilingual education and English instruction, we would see a sharp de-cline in bilingual education enrollment in Texas (see Rossell, 2002).
The Eff ectiveness of Bilingual Education
in Texas
This section will examine two important outcomes for grades 3, 4, and 5, the elementary grades in which achievement tests are administered, and which also have signii cant bilingual education enrollment. The i rst outcome is the percentage of ELL students in a school tested in English on the Texas Assessment of Knowledge and Skills (TAKS) and the second is the
* The data for 2000 on in both Appendices 2 and 3 were downloaded from the Academic Excellence Indicator System online at http://www.tea.state.tx.us/perfreport/aeis/2005/DownloadData.html. Data for years earlier than that were provided by the Informa-tion Analysis Division of the PEIMS Ad Hoc Reporting and the Student Assessment Division, both in the Texas EducaInforma-tion Agency. In addition, because the public AEIS data does not distinguish between bilingual education and ESL programs, labeling both as bilingual education, I often had to make special requests for data that distinguished between the two. Sometimes it was available (enrollment by school and grade, for example) and thus provided to me by email. Sometimes it was not available at all (budgetary data, for example). Although the TEA staf were quite helpful and generous with their data and time and often provided me with better data than was available on their web site, privacy restrictions meant that I could not receive individual level data that the as-sessment staf have access to. The smallest aggregation that I could receive was groups of students in schools.
† These numbers, obtained from the Texas Education Agency, are estimates that vary slightly depending on the source.
‡ The data were provided by the Information Analysis Division of the Texas Education Agency by email as the state website lumps bilingual education and ESL instruction together.
Bilingual education is instruction provided to students in their native tongue in all
subjects in a self-contained classroom with other students who speak the same language.
average school ELL scale scores on the TAKS tests in English.
According to Texas state regulations, all school dis-tricts that are required to provide bilingual educa-tion and/or ESL programs must establish and oper-ate a Language Proi ciency Assessment Committee (LPAC) in the schools where these programs are pro-vided. This committee makes decisions regarding the identii cation, education, and assessment of ELL students.*
The TAKS, mandated by the Texas Legislature in 1999 and i rst administered in 2002-03, assesses read-ing/English Language Arts, writing, mathematics, science, and social studies. It is currently the high school exit test.† The TAKS is administered in Spanish
and in English in grades 3-6 only.
The Language Proi ciency Assessment Committee (LPAC) in elementary schools determines who takes which version. The LPAC also determines who is ex-empted from the TAKS altogether. The goal, accord-ing to state law, is to limit Spanish test-takaccord-ing and/or exemption to three years.
The English TAKS is not an overly demanding test. Peterson and Hess (2005) assigned grades from A to F, depending on the degree to which the age proi cient on a state test matched the percent-age proi cient on the National Assessment of
Educa-tional Progress (NAEP) in the same year. An A meant that the state percentage proi cient was at or below the NAEP percentage proi cient. An F meant the state percentage proi cient was far above the NAEP percentage proi cient. The percentage of Texas stu-dents ranked as proi cient on the 2003 TAKS was far higher than on the NAEP that same year. And thus, Texas was one of only two states to which Peterson and Hess gave an F. Texas’ 2005 TAKS scores, com-pared with their NAEP scores, promoted the state to a D+ overall (Peterson and Hess, 2006). In 2007, how-ever, Texas’ TAKS scores were again so much higher than its NAEP scores that its overall rating fell to a D (Peterson and Hess, 2008).
Percentage of ELL Students Tested in English on TAKS Tests
Because ELL students can take the Spanish, rather than the English, version of the TAKS, or be exempt-ed altogether, the extent to which English test-taking varies by program can be thought of as an impor-tant outcome of the program. If one program has a higher rate of ELL students who are able to take the TAKS in English, that program should be thought of as more successful in teaching English.
As explained in Appendix 5, across all grades (the bottom row), the total percentage of ELL students tested in reading in English is 60 percent, the per-centage of non-ELL students is 88 percent.‡ There is
also little dif erence among reading, social studies,
* See 19 Texas Administrative Code (TAC) Chapter 89. Adaptations for Special Populations. Subchapter BB.
† The high school TAKS tests and exit exam will be replaced by a series of end-of-course exams starting with the 2011-12 school year per S.B. 1031 passed by the 80th Texas Legislature.
writing, math, and science testing rates for ELL stu-dents, although most people would think the math and science tests, being less language-based, would produce higher rates. In fact, as noted elsewhere, ELL math testing rates in English are not much higher than ELL reading testing rates in English. This is be-cause translating math facts and procedures learned in one language to another language can be hard at the elementary level, where much math learning is language-based (Rossell, 2002; Rossell and Baker, 1996a, 1996b).
The public Texas database does not separate the test scores of ELL students enrolled in bilingual edu-cation from those in English instruction. Therefore, this study uses a common statistical method, mul-tiple regression analysis, to estimate the ef ect of the percentage of ELL students enrolled in bilingual education in grades 3, 4, and 5 in a school on the percentage of ELL students taking tests.*
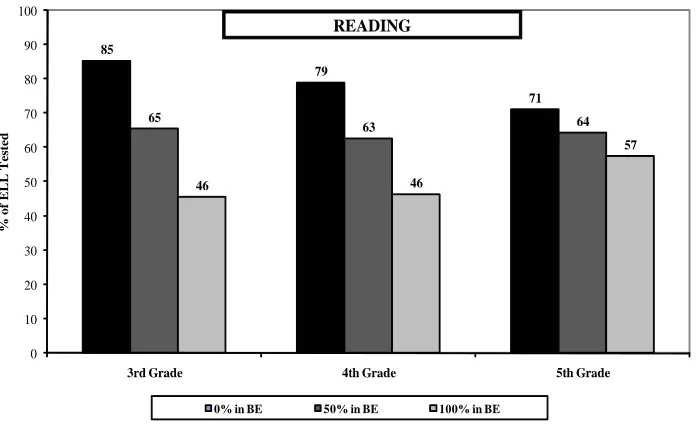
Figure 1 illustrates the ef ect of bilingual education by mathematically solving the equations (explained in Appendix 6 and shown in Appendix 6a, 6b, and 6c) for 0, 50, and 100 percent of ELL students enrolled in bilingual education and for the mean of the other explanatory variables: the percentage ELL in a grade and the percentage of poor† students in a school. If
no third grade ELL students are enrolled in bilingual education, the percentage of those students tested on the TAKS English Reading exam is 85 percent. If all are enrolled in bilingual education, the percentage tested falls to 46 percent. This means a gap of 39 per-centage points for third graders after what amounts to i ve years of bilingual education for many of them. In short, the ef ect of bilingual education is strongly negative, not just in the third but also in the fourth and i fth grades. That assessment includes some i fth graders who have received seven years of bilingual education.
* The number of ELL students in bilingual education in a grade and school were obtained by special request.
† The dei nition of poverty (labeled “economically disadvantaged” in the database) is 1) being eligible for free or reduced lunch or 2) being at or below the poverty line, receiving TANF/public assistance, a Pell grant, JTPA Title II, or food stamps in 1977.
85
79
71 65
63 64
46 46
57
0 10 20 30 40 50 60 70 80 90 100
3rd Grade 4th Grade 5th Grade
% of ELL Tested
Figure 1
% of ELL Students in a Grade Tested in TAKS Reading by % ELL in Bilingual Education in Grade, Controlling for % ELL in Grade, and % Poor in School,
Texas Public Schools* 2006-07
0% in BE 50% in BE 100% in BE
* Excludes charter and special education schools and schools with <10 ELL students in the grade analyzed.
READING
Figure 1: % of ELL Students Tested in English on the TAKS Reading Test by % of ELL Students in Bilingual Education, Texas Public Schools* 2006-07
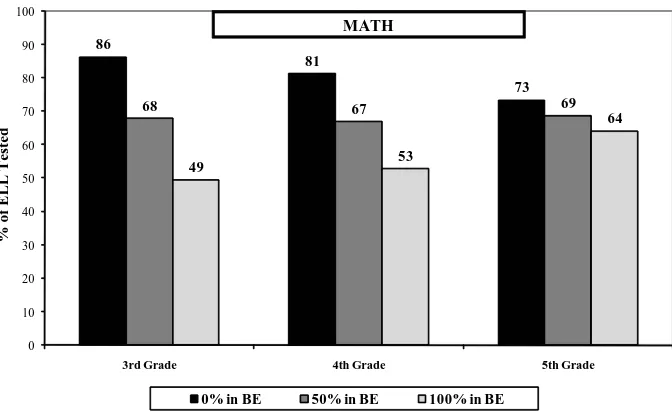
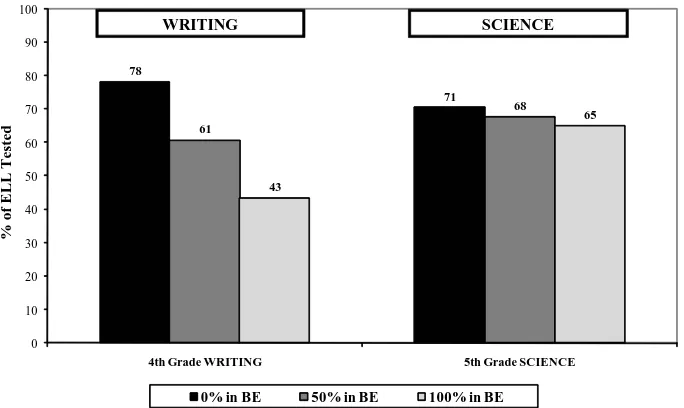
Figure 2, which illustrates the ef ect of bilingual ed-ucation on math, shows much the same pattern as reading. The negative ef ect, though greatest for third grade, is still negative for grades 4 and 5, after six or seven years of bilingual education for many of these students. Figure 3 (next page) illustrates the ef ect of bilingual education on writing and science. The TAKS writing test is administered only in grade 4, the TAKS science test only in grade 5 for elementary students. After six years of bilingual education for many of these students, the ef ect of it is strongly negative on testing in English writing. The gap for the i fth grade science test between no bilingual education and to-tal bilingual instruction is only six percentage points. This is nonetheless statistically signii cant, and more important than the percentage poor in a school and the percentage ELL in that grade.
What these results show is that bilingual education is given an unfair advantage in comparison to other programs for ELL students because it tests fewer ELL students in English. In other words, the untested stu-dents disappear from public scrutiny. The small num-ber of researchers who have looked at this issue in other states, and on a nationwide basis, have discov-ered a similar phenomenon (Rossell, 2002; Bali, 2000; Los Angeles Unii ed, 1998; Ramirez, et al. 1998).
What I have done here is to treat this bias as an impor-tant outcome showing that bilingual education does not keep up with English instruction for ELL students in preparing students to take academic achievement tests in English. Some might object that because the school’s Language Proi ciency Assessment Commit-tee has the option of testing an ELL child in Spanish or English, the percentage tested in English in bilin-gual education is irrelevant. I disagree. It is clear from reading state law and regulations that the purpose of bilingual education is to prepare the child for tak-ing the TAKS in English as soon as possible. Why else the provision for a maximum of three years of Span-ish test taking?
Indeed, the only reason a proi ciency assessment committee would schedule an ELL child for an exam in Spanish is that the committee thought the child would score higher in Spanish than in English. Any dif erence between types of ELL programs in English testing rates can be considered an outcome of the program. It can also be considered a systematic “bias” that invalidates a simple assessment of achievement outcomes between programs. That is because the students who would score lowest in English are ex-empted from testing in English.
86
3rd Grade 4th Grade 5th Grade
% of ELL Tested
g
% of ELL Students in a Grade Tested in TAKS Math by % ELL in Bilingual Education in Grade, Controlling for % ELL in Grade, and % Poor in School,
Texas Public Schools,* 2006-07
0% in BE 50% in BE 100% in BE
* Excludes charter and special education schools and schools with <10 ELL students in the grade analyzed.
MATH
Figure 2: % of ELL Students Tested in TAKS Math Test by % ELL Students in Bilingual Education, Texas Public Schools* 2006-07
TAKS Achievement Scores in English
The state of Texas has a complicated achievement rating system that involves students meeting various performance standards, most of them federally man-dated. These data are available at the school, district, and state level as percentages of students in various groups in each grade who meet each of these stan-dards. The idiosyncratic nature of these standards, along with their sheer number, make them less use-ful for statistical analysis than the more common, nationally used test scores, such as percentiles,* nor-mal curve equivalents, and scale scores.
Fortunately, the TEA student assessment division web site† includes the average scale scores for each
grade and test and group. These are the scores used in the analyses that follow.‡ Appendix 7a, 7b, and 7c
show that, as hypothesized above, the lower the per-centage of ELL students tested in a grade, the high-er the average reading, math, writing, and science
score in English for ELL students in that grade. This is indisputable evidence that the lower-scoring ELL students are indeed the ones not being tested.
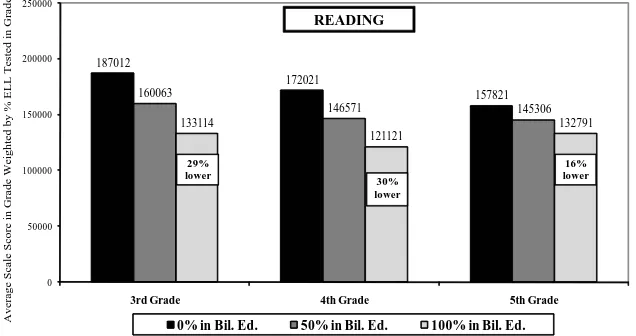
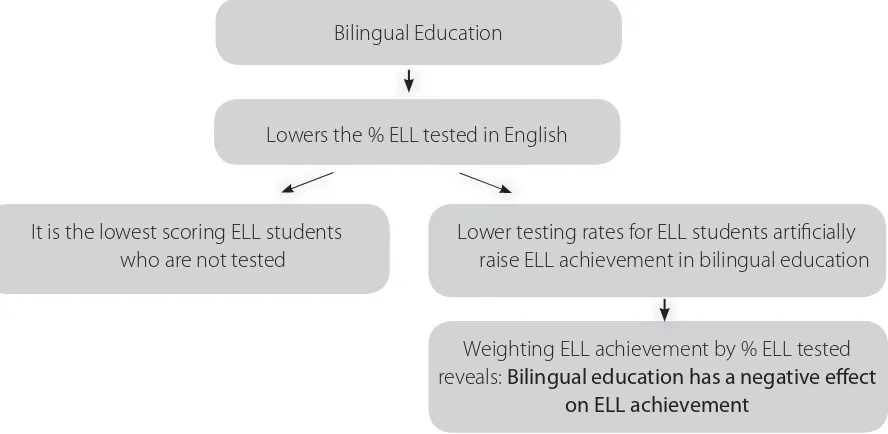
Appendices 8a, 8b, and 8c and Figures 4, 5, and 6 show a solution to removing this bias—weighting§ the average ELL achievement score in English by the ELL testing rate in English for that subject. Thus, schools with higher ELL testing rates get more credit for their ELL achievement than do those with lower testing rates. Figures 4, 5, and 6 show that bilingual education has a negative ef ect on reading, math, writing, and science achievement in English. Figure 7 summarizes the path by which this occurs and the outcome. Lower testing rates for ELL students ar-tii cially raise ELL achievement, because the lowest scoring students are not tested, as demonstrated in Appendices 7a, 7b, and 7c. When this is taken into account, bilingual education has a negative ef ect on ELL achievement.
* Percentiles are not recommended for statistical analysis.
† See http://www.tea.state.tx.us/student.assessment/reporting/taksagg/dnload.html.
‡ A scale score is created from a raw score (number right) by weighting items by their diffi culty. On the TAKS, the scale score ranges from approximately 1000 to 3200 for each test.
§ To weight means to multiply by some relevant value. In this case, the scale score for ELL students in a grade, test, and school, which ranges from about 1700 to 2700, is multiplied by the percentage of ELL students tested on that test, grade, and school, which ranges from 0 to 100. This produces a weighted scale score for ELL students which ranges from about 10,000 to about 253,000.
78
4th Grade WRITING 5th Grade SCIENCE
% of ELL Tested
Figure 3
% of ELL Students in Grade Tested in TAKS Writing, Science by % ELL in Bilingual Education in Grade, Controlling for % ELL in Grade, and % Poor in School,
Texas Public Schools,* 2006-07
0% in BE 50% in BE 100% in BE
* Excludes charter and special education schools and schools with <10 ELL students in the grade analyzed.
WRITING SCIENCE
Figure 3: % of ELL Students Tested in TAKS Writing & Science Test by % ELL Students in Bilingual Education, Texas Public Schools* 2006-07
187012
3rd Grade 4th Grade 5th Grade
Average Scale Score in Grade Weighted by % ELL Tested in Grade
Figure 4
Average Weighted TAKS Reading/ELA Scale Scores of ELL Students Controlling for % ELL in Bilingual Education in Grade, % ELL in Grade, and % Poor in School,
Texas Public Schools,* 2006-07
0% in Bil. Ed. 50% in Bil. Ed. 100% in Bil. Ed.
* Excludes charter and special education schools and schools with less than 10 ELL students in the grade analyzed.
READING
3rd Grade 4th Grade 5th Grade
Average Scale Score in Grade Weighted by % LEP Tested in Grade
Figure 5
Average Weighted TAKS Math Scale Scores of ELL Students Controlling for % ELL in Bilingual Education in Grade, % ELL in Grade, and % Poor in School,
Texas Public Schools,* 2006-07
0% in Bil. Ed. 50% in Bil. Ed. 100% in Bil. Ed.
* Excludes charter and special education schools and schools with less than 10 ELL students in the grade analyzed.
MATH
4th Grade WRITING 5th Grade SCIENCE
Average Scale Score in Grade Weighted by % LEP Tested in Grade
Figure 6
Average Weighted TAKS Writing and Science Scale Scores of ELL Students Controlling for % ELL in Bilingual Education in Grade, % ELL in Grade, and % Poor in School,
Texas Public Schools,* 2006-07
0% in Bil. Ed. 50% in Bil. Ed. 100% in Bil. Ed.
* Excludes charter and special education schools and schools with less than 10 ELL students in the grade analyzed.
SCIENCE
Figure 4: Average Weighted TAKS Reading/ELA Scale Scores of ELL Students, Texas Public Schools* 2006-07
Figure 5: Average Weighted TAKS Math Scale Scores of ELL Students, Texas Public Schools* 2006-07
Figure 6: Average Weighted TAKS Writing & Science Scale Scores of ELL Students, Texas Public Schools* 2006-07
The Cost of Bilingual Education
The Methodology
The cost of bilingual education cannot be deter-mined by looking at the budget allocation, ei-ther nationally or in Texas. The state budget shows $181,693,445 allocated to “bilingual education” in 2006-07 and $223,051,856 in 2007-08. This is neither the cost of bilingual education nor the amount of money spent on it by the state. One reason for this is that state law makes no distinction between money spent on bilingual education and money spent on ESL content programs (i.e., sheltered English immer-sion) or ESL pullout programs. The expenditures la-beled “bilingual education” in the state data base are the sum of all expenditures for ELL students.
Even if state law did make a distinction between funding for bilingual education and funding for other programs for ELL students, it would be diffi -cult to determine the added cost of bilingual educa-tion, in Texas or elsewhere. The total cost, which is typically the only cost made public, is inl ated and misleading. That is because it includes the salaries of teachers and the cost of supplies and services that students would receive regardless of what program they were in. The added cost, by contrast, is only that
amount of money spent solely because the ELL child is in a bilingual education program, rather than an-other type of program. This “added cost” is, of course, always much less than the total cost.
The extensive data on other characteristics of schools that I have either downloaded or acquired by special request allow me to estimate the “added cost” of bi-lingual education by examining the relationship in a given school between bilingual education enroll-ment and per-pupil expenditures. This is explained in Appendix 9 and shown as two equations, one for total expenditures per pupil and another for instruc-tional expenditures per pupil, in Appendix 9a.
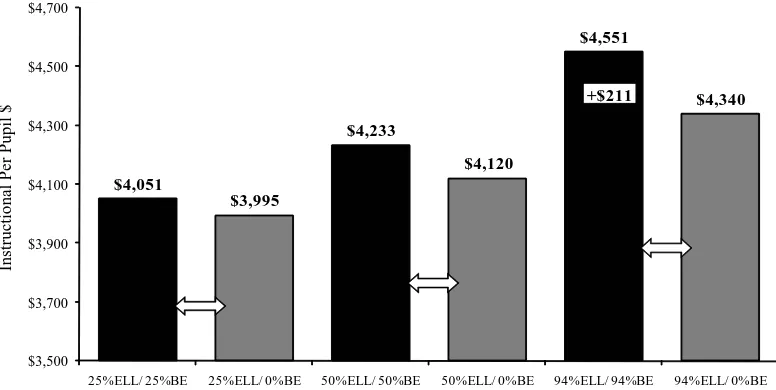
Figure 8 (next page) shows that in Texas, a school with all its students in bilingual education spends $402 more per pupil than one with no students in bilingual education. Figure 9 (next page) shows that the i rst kind of school spends $211 more for
instruction per pupil than does the second kind. In short, bilingual education costs more (i.e., has an added cost) than do alternative programs, such as a mainstream classroom with ESL pullout or shel-tered English immersion. Other studies have also found that bilingual education costs more than al-ternative programs for ELL students ($200 to $700 Bilingual Education
Lowers the % ELL tested in English
It is the lowest scoring ELL students who are not tested
Lower testing rates for ELL students artii cially raise ELL achievement in bilingual education
Weighting ELL achievement by % ELL tested reveals: Bilingual education has a negative eff ect
on ELL achievement Figure 7: The Relationship between Bilingual Education and ELL Achievement in English
$4,961
$4,854
$5,216
$5,002
$5,665
$5,263
$4,400 $4,600 $4,800 $5,000 $5,200 $5,400 $5,600 $5,800
25%ELL/ 25%BE 25%ELL/ 0%BE 50%ELL/ 50%BE 50%ELL/ 0%BE 94%ELL/ 94%BE 94%ELL/ 0%BE
Total Per Pupil $
Figure 8
Total Per Pupil Expenditures by % of School in Bilingual Education (BE) and % ELL Controlling for School Size, Special Education, and Poverty,
Texas Elementary Schools,* 2005-06
* Including only regular schools with at least 80 ELL students.
+$402
more per pupil, according to Carpenter-Huf man and Samulon, 1983; $205 more per pupil, accord-ing to Garcia, 1977; and $680 more per pupil, ac-cording to Prince and Hubert, 1994).
Conclusion
The data analyzed in this study suggest that bilin-gual education is the least ef ective program for ELL students if one’s goal is achievement in English.
ELL students in bilingual education are tested in English on the TAKS at signii cantly lower rates than those students not in bilingual education. This indi-cates that bilingual education is less ef ective than all-English programs in teaching ELL students Eng-lish and subject matter that they will have to know in English. The fact that Texas law allows such a discrep-ancy does not excuse it.
$4,051
$3,995
$4,233
$4,120
$4,551
$4,340
$3,500 $3,700 $3,900 $4,100 $4,300 $4,500 $4,700
25%ELL/ 25%BE 25%ELL/ 0%BE 50%ELL/ 50%BE 50%ELL/ 0%BE 94%ELL/ 94%BE 94%ELL/ 0%BE
Instructional Per Pupil $
Figure 9
Instructional Per Pupil Expenditures by % of School in Bilingual Education (BE) and % ELL Controlling for School Size, Special Education, and Poverty,
Texas Elementary Schools,* 2005-06
* Including only regular schools with at least 80 ELL students.
+$211
Figure 8: Total Per Pupil Expenditures by % of School in Bilingual Education (BE) and % ELL, Texas Elementary Schools* 2005-06
Figure 9: Instructional Per Pupil Expenditures by % of School in Bilingual Education (BE) and % ELL, Texas Elementary Schools* 2005-06
The statistical analyses presented in this report dem-onstrate that it is the lowest-scoring students who are not tested in English. The correlation is clear: the lower the testing rate for ELL students, the higher the ELL achievement. The fact that Texas law allows lo-cal language proi ciency committees to designate a Spanish rather than an English test, or exempt an insuffi ciently prepared ELL student altogether, does not invalidate a reality, namely, that both possibili-ties grow likelier if the student is in a bilingual ed-ucation program rather than an alternative. When more weight is given to ELL TAKS English test scores in schools where ELL students have higher testing rates, bilingual education has a negative ef ect on achievement in English.
Finally, as noted in every other study of the question, bilingual education in Texas is more expensive than other programs for ELL students. That it is also the least educationally ef ective suggests that it is not the best program for Texas.
Recommendations
1) Adopt sheltered English immersion as the default assignment for ELL students.
Given that bilingual education is both more costly and less ef ective than other programs for ELL stu-dents, it is recommended that Texas follow the lead of other states and adopt sheltered English immer-sion as the default assignment for ELL students. At the very least, Texas should consider giving schools a choice as to the program that elementary ELL stu-dents receive, particularly in light of the fact that only three other states mandate bilingual education.
Research indicates that sheltered English immer-sion is the most successful program for ELL students
if one’s goal is the highest level of achievement in English that a child is capable of (Rossell and Baker, 1996a, 1996b; Bali, 2001; Rossell, 2002; Rossell and Kuder, 2005). A sheltered English immersion course involves second language learners only, taught by a teacher trained in second language acquisition tech-niques. Instruction is almost entirely in the second language, but at a pace the child can understand.
Sheltered English immersion is mandated as the de-fault assignment for English Language Learners by Proposition 227, passed in June 1998 in California; by Proposition 203, passed in November 2000 in Arizo-na; and by Question 2, passed in November 2002 in Massachusetts. It is also implemented at the discre-tion of schools and districts throughout the United States.
My analyses (Rossell, 2002) and those of Bali (2001) of the ef ectiveness of sheltered English immersion in California show a positive ef ect on reading and math achievement from dismantling bilingual edu-cation in a school. Through teacher and principal in-terviews (Rossell, 2002) in California in Spring 1999 and Fall 2001, strong support was revealed among teachers and principals for sheltered English immer-sion, even among those who had lobbied to stop the initiative from passing.
The former bilingual education teachers were now the sheltered English immersion teachers. The ones I talked to, loved it. In their previous experience as bi-lingual education teachers, they had worried about how much English their students were learning, but did not want to send their students to a mainstream classroom. Now these teachers felt they had the best of all possible worlds—a sheltered classroom in which they could use Spanish when needed to com-municate with a parent or new child, but in which almost all of the instruction was in English.
2) Parents should be given choice.
One of the more shocking i ndings in years of talk-ing to parents of ELL children assigned to biltalk-ingual education is that, despite being notii ed of the as-signment, the parents had no idea of all its implica-tions. They were unaware their child would be in a classroom in which instruction was at least partly in Spanish: almost completely so in the case of kinder-gartners. This confusion is undoubtedly a problem in Texas, where the default assignment is bilingual education. Although parents have the authority to opt out of a bilingual education program in Texas (as in every other state with mandated bilingual educa-tion), they are more prone to approve than to reject the default assignment made by the school, because they do not understand what their child is being as-signed to and assume the educational experts know best (Rossell, 2002). Thus, it is important to make the default assignment the program that is the most ef ective—sheltered English immersion—and not the one that is least ef ective—bilingual education. Then parents can become educated about the pro-grams before they switch their child.
3) All ELL students must be tested on the English TAKS.
This is the most ef ective way to hold schools account-able for the English language acquisition of their ELL students. Interestingly, it is also an excellent way to give schools credit for the extraordinary job they do of teaching English and subject matter in English to non-English speaking students. If a school or district tests ELL students only in English on the state proi -ciency tests many years after their arrival, they miss out on being given credit for the gains in English that ELL children made in the years before that.
Universal testing of ELL students on the state proi -ciency tests in English is required in California, so it is
possible to do this. English language proi ciency tests designed solely for ELL students—the Texas English Language Proi ciency Assessment System (TELPAS)*—
are not a substitute for the state proi ciency test, as one cannot compare the scores for, and the gains in, a test taken only by ELL students to the scores on a dif erent test taken by non-ELL students.
The above recommendations are based on empiri-cal research nationally and in Texas. Instruction in English (and the elimination of bilingual education) is overwhelmingly supported by the public, accord-ing to a number of national surveys (see Rossell and Baker, 1996; Gallup, 1998; Gallup, 2005) and by vot-ers in three states (California in 1998, Arizona in 2000, and Massachusetts in 2002).
A large majority of immigrant parents want their chil-dren taught in English, not the native tongue (see Rossell and Baker, 1996a). Sheltered English immer-sion has already been adopted and accepted in Cali-fornia, Arizona, and Massachusetts—all states with large Spanish-speaking immigrant populations— as a more ef ective method of teaching English to English language learners.† The Texas Legislature
should consider embracing sheltered English im-mersion as the default program in place of bilingual
education.
Õ
* See http://ritter.tea.state.tx.us/student.assessment/resources/guides/test_admin/2009/TELPAS_Manual_2009.pdf.
References
Bali, Valentina. 2000. “’Sink or Swim’: What Happened to California’s Bilingual Students After Proposition 227?” Unpublished paper, Pasadena, CA: California Institute of Technology.
Bali, Valentina. 2001. “’Sink or Swim’: What Happened to California’s Bilingual Students After Proposition 227?” State Politics and Policy Quar-terly, 1(3): 295-317.
Carpenter-Huf man, Margaret, and Marta K. Samulon. 1983. “Case Studies of Delivery and Cost of Bilingual Education.” In Bilingual Education, Ed. Keith Baker and Adrianna DeKanter. Lexington, MA: Lexington Books.
Carpenter-Huf man, Polly, and Marta Samulon. 1981. “Case Studies of Delivery And Cost of Bilingual Education.” Prepared for The U.S. Depart-ment of Education.
Garcia, Anita and Cynthia Morgan. 1997. A 50 State Survey of Requirements for the Education of Language Minority Children. Washington, D.C., Read Institute. Available at http://www.ecs.org/html/of site.asp?document=http://www.ceousa.org/READ/50state.html, accessed Novem-ber 2007.
Garcia, S.O. 1977. “Analyzing Bilingual Education Costs.” In Bilingual Education: Current Perspectives. Ed. G. Blanco et al. Arlington, VA: Center for Applied Linguistics.
Haager, D., Gersten, R., Baker, S., Graves, A. 2001. An observational study of i rst grade reading instruction for English language learners us-ing sheltered immersion methodology. Paper presented at the Pacii c Coast Research Conference. February, La Jolla, CA.
Krashen, S. (1985). Inquiries and Insights. Hayward, CA: Alemany Press.
Los Angeles Unii ed School District. 1998. “Clarii cation of English Academic Testing Results for Spanish-Speaking LEP Fifth Graders.” Peterson, Paul E. and Frederick Hess. “Johnny Can Read … in Some States,” Education Next, Summer 2005. Available at http://www.hoover. org/publications/ednext/3219636.html, accessed November 2007.
Peterson, Paul E and Frederick Hess. 2006. Keeping an eye on state standards. Education Next, 6(3): 28-29. Available at http://media.hoover. org/documents/ednext20063_28.pdf, accessed November 2007.
Peterson, Paul E and Frederick Hess. 2008. “Few States Set World-Class Standards.” Education Next, 8(3): 70-73. Available at http://media. hoover.org/documents/ednext_20083_70.pdf, accessed June 2008.
Prince, Cynthia D. and John A. Hubert. “Measuring The Cost Of Bilingual Education.” The Journal of Educational Issues of Language Minority Students, v13 p. 121-135, Spring 1994.
Rossell, Christine H., “Making Uneven Strides: State Standards for Achieving English Language Proi ciency Under the No Child Left Behind Act,” September 2005, a report for the Lexington Institute, Arlington, VA. Available at http://lexingtoninstitute.org/docs/696.pdf.
Rossell, Christine H., “Dismantling Bilingual Education, Implementing English Immersion: the California Initiative,” August 20, 2002. Available at http://www.bu.edu/polisci/CROSSELL/CRossell.html.
Rossell, Christine H. “The Federal Bilingual Education Program: Title VII of the Elementary and Secondary Education Act,” in Brookings Papers on Education Policy, 2000, edited by Diane Ravitch, Washington, D.C.: Brookings Institution, 2000a: 215-244. Available at http://www. bu.edu/polisci/CROSSELL/CRossell.html.
Rossell, Christine H. “Teaching Language Minorities: Theory and Reality,” in City Schools: Lessons From New York, edited by Diane Ravitch and Joseph Viteritti, Baltimore: Johns Hopkins University Press, 2000b: 187-218. Available at http://www.bu.edu/polisci/CROSSELL/CRossell.html Rossell, Christine H. and Julia Kuder. 2005. “Meta-Murky: A Rebuttal to Recent Meta-Analyses of Bilingual Education,” in Janina Söhn, Ed., The Eff ectiveness of Bilingual School Programs for Immigrant Children. Berlin, Germany: Wissenschaftszentrum Berlin für Sozialforschung. Available at http://www.bu.edu/polisci/CROSSELL/CRossell.html
Rossell, Christine and Baker, Keith 1996(a). Bilingual Education in Massachusetts: the Emperor Has No Clothes. Boston, MA: Pioneer Institute. Rossell, Christine and Baker, Keith 1996(b). “The Educational Ef ectiveness of Bilingual Education,” Research in the Teaching of English, 30(1): 7-74.
Rossell, Christine H. and Keith Baker. “Selecting and Exiting Students in Bilingual Education Programs,” Journal of Law and Education, 17 (4), Fall, 1988, 589-624. Available at http://www.bu.edu/polisci/CROSSELL/CRossell.html.
Rossell, Christine H. “Dismantling Bilingual Education, Implementing English Immersion: the California Initiative.” Boston, MA: Boston Univer-sity, 2002. Available at http://www.bu.edu/polisci/CROSSELL/CRossell.html.
Appendix 1: State LEP Populations Served by Federal Bilingual Education (Title III), 2005-06
Alphabetical List of States
LEP Title III, 2005-06
% LEP of PK-12 Student Enrollment,
2005-06
Total Enrollment, 2005-06
States Ranked by Size of Title III LEP Population, 2005-06
States Ranked by % LEP of PK-12 Student Enrollment, 2005-06
U.S. Total 4,222,849 9% 48,912,085 U.S. Total 4,222,849 U.S. Total 9%
U.S. Mean 82,801 9% 959,060 U.S. Mean 82,801 U.S. Mean 9%
U.S. Median 25,767 4% 641,685 U.S. Median 25,767 U.S. Median 4%
Alabama 15,088 2% 741,547 California 1,565,675 California 24.8%
Alaska 18,475 14% 133,292 Texas 638,863 New Mexico 19.5%
Arizona 152,568 14% 1,094,454 Florida 242,343 Nevada 17.9%
Arkansas 17,723 4% 474,206 New York 229,470 Texas 14.1%
California 1,565,675 25% 6,312,103 Illinois 155,810 Arizona 14.0%
Colorado 83,709 11% 779,826 Arizona 152,568 Alaska 13.9%
Connecticut 27,216 5% 575,058 Colorado 83,709 Colorado 10.7%
Delaware 6,015 5% 120,937 North Carolina 83,010 Utah 10.3%
D.C. 3,843 5% 76,876 Nevada 74,009 Florida 9.1%
Florida 242,343 9% 2,675,024 Washington 73,499 Hawaii 8.8%
Georgia 56,465 4% 1,598,461 Michigan 65,419 New York 8.1%
Hawaii 16,190 9% 184,925 New Mexico 63,650 Illinois 7.4%
Idaho 18,884 7% 261,844 Georgia 56,465 Idaho 7.2%
Illinois 155,810 7% 2,111,706 Minnesota 55,531 Washington 7.1%
Indiana 33,942 3% 1,034,782 Utah 52,582 Minnesota 6.6%
Iowa 14,742 3% 481,099 New Jersey 52,285 Rhode Island 6.6%
Kansas 25,767 6% 466,266 Massachusetts 43,820 Oregon 6.5%
Kentucky 10,043 2% 641,685 Virginia 39,862 North Carolina 5.9%
Louisiana 7,317 1% 654,397 Pennsylvania 37,268 Kansas 5.5%
Maine 2,726 1% 195,498 Oregon 34,803 D.C. 5.0%
Maryland 29,778 3% 860,020 Indiana 33,942 Delaware 5.0%
Massachusetts 43,820 5% 971,909 Wisconsin 31,802 Connecticut 4.7%
Michigan 65,419 4% 1,711,544 Maryland 29,778 Oklahoma 4.7%
Minnesota 55,531 7% 839,084 Oklahoma 29,564 Massachusetts 4.5%
Mississippi 3,611 1% 494,954 Connecticut 27,216 Michigan 3.8%
Missouri 15,559 2% 915,850 Kansas 25,767 New Jersey 3.7%
Montana 3,582 2% 145,416 Ohio 21,257 Arkansas 3.7%
Nebraska 8,839 3% 286,646 South Carolina 19,540 Wisconsin 3.6%
Nevada 74,009 18% 412,407 Idaho 18,884 Georgia 3.5%
New Hampshire 3,532 2% 205,767 Tennessee 18,671 Maryland 3.5%
New Jersey 52,285 4% 1,395,602 Alaska 18,475 Virginia 3.3%
New Mexico 63,650 19% 326,758 Arkansas 17,723 Indiana 3.3%
New York 229,470 8% 2,838,209 Hawaii 16,190 Nebraska 3.1%
North Carolina 83,010 6% 1,416,436 Missouri 15,559 Iowa 3.1%
North Dakota 2,684 3% 98,284 Alabama 15,088 South Carolina 2.8%
Ohio 21,257 1% 1,836,991 Iowa 14,742 North Dakota 2.7%
Oklahoma 29,564 5% 634,739 Kentucky 10,043 Montana 2.5%
Oregon 34,803 7% 534,823 Rhode Island 10,000 South Dakota 2.2%
Pennsylvania 37,268 2% 1,828,287 Nebraska 8,839 Pennsylvania 2.0%
Alphabetical List of States
LEP Title III, 2005-06
% LEP of PK-12 Student Enrollment,
2005-06
Total Enrollment, 2005-06
States Ranked by Size of Title III LEP Population, 2005-06
States Ranked by % LEP of PK-12 Student Enrollment, 2005-06
U.S. Total 4,222,849 9% 48,912,085 U.S. Total 4,222,849 U.S. Total 9%
U.S. Mean 82,801 9% 959,060 U.S. Mean 82,801 U.S. Mean 9%
U.S. Median 25,767 4% 641,685 U.S. Median 25,767 U.S. Median 4%
South Carolina 19,540 3% 701,544 Delaware 6,015 Tennessee 2.0%
South Dakota 2,649 2% 122,008 D.C. 3,843 New Hampshire 1.7%
Tennessee 18,671 2% 953,798 Mississippi 3,611 Missouri 1.7%
Texas 638,863 14% 4,523,873 Montana 3,582 Kentucky 1.6%
Utah 52,582 10% 508,430 New Hampshire 3,532 Maine 1.4%
Vermont 1,216 1% 96,638 Maine 2,726 Vermont 1.3%
Virginia 39,862 3% 1,214,229 North Dakota 2,684 Ohio 1.2%
Washington 73,499 7% 1,031,985 South Dakota 2,649 Louisiana 1.1%
West Virginia 1,140 0% 280,703 Vermont 1,216 Wyoming 1.0%
Wisconsin 31,802 4% 875,066 West Virginia 1,140 Mississippi 0.7%
Wyoming 813 1% 84,409 Wyoming 813 West Virginia 0.4%
Sources: 1) Biennial Evaluation Report to Congress on the Implementation of Title III, Evaluation Element 3; and 2) National Center for Educational Statistics/Common Core of Data Public Elementary and Secondary Students, Staf , Schools, and School Districts: School Year 2005-06.
Total Hispanic Asian White Black
Nat. Am.
% Hispanic
%
Non-White ELL
Hispanic ELL
% of Hispanics
who are ELL
% Non-Hispanics
who are ELL
Change 1,035,162 875,900 73,117 -76,226 155,075 7,296 11% 13% 332,527 309,319 2% 1%
2006-07 4,576,933 2,118,867 149,817 1,631,680 660,785 15,784 46% 64% 731,304 679,821 32% 2%
2005-06 4,505,572 2,040,449 141,589 1,644,308 664,242 14,984 45% 64% 711,237 661,768 32% 2%
2004-05 4,383,871 1,961,549 133,010 1,653,008 621,999 14,305 45% 62% 684,007 637,142 32% 2%
2003-04 4,311,502 1,886,319 126,875 1,669,842 614,714 13,752 44% 61% 660,308 615,281 33% 2%
2002-03 4,239,911 1,811,882 122,229 1,686,534 606,141 13,125 43% 60% 630,148 585,809 32% 2%
2001-02 4,160,968 1,734,388 116,222 1,700,622 596,962 12,774 42% 59% 601,448 558,694 32% 2%
2000-01 4,071,433 1,650,560 108,605 1,713,436 586,712 12,120 41% 58% 570,603 530,376 32% 2%
1999-00 4,002,227 1,582,538 103,686 1,727,733 576,977 11,293 40% 57% 555,470 516,601 33% 2%
1998-99 3,954,434 1,526,713 100,143 1,746,896 568,757 11,925 39% 56% 533,805 496,790 33% 2%
1997-98 3,900,488 1,478,984 95,136 1,755,385 560,405 10,578 38% 55% 519,921 483,320 33% 2%
1996-97 3,837,096 1,435,521 91,051 1,750,930 549,667 9,927 37% 54% 514,263 479,359 33% 1%
1995-96 3,799,032 1,397,109 88,264 1,756,966 546,861 9,832 37% 54% 479,576 447,174 32% 1%
1994-95 3,730,544 1,347,613 84,933 1,750,213 538,742 9,043 36% 53% 455,331 422,698 31% 1%
1993-94 3,672,198 1,310,267 82,107 1,742,151 529,285 8,388 36% 53% 426,059 396,437 30% 1%
1992-93 3,541,771 1,242,967 76,700 1,707,906 505,710 8,488 35% 52% 398,777 370,502 30% 1%
Appendix 2: Trends in the Student Population by Race/Ethnicity and ELL Status, Texas Public Schools, 1992-2007
Bilingual Education Enrollment ELL Population
2006-07 203 777 458 393,864 1,049 396,351 99% 530 34,918 7,135 679,821 9,375 731,779 93% 54% 58% 5%
2005-06 185 755 379 375,038 888 377,245 99% 523 33,350 6,555 661,768 9,059 711,255 93% 53% 57% 4%
2004-05 178 664 359 355,062 951 357,214 99% 547 31,717 5,856 637,142 8,810 684,072 93% 52% 56% 5%
2003-04 145 723 268 336,646 960 338,742 99% 487 30,733 4,948 615,281 9,143 660,592 93% 51% 55% 5%
2002-03 157 804 337 320,027 1,137 322,462 99% 513 29,937 4,575 585,809 9,352 630,186 93% 51% 55% 5%
2001-02 194 777 309 303,383 1,097 305,760 99% 578 28,560 4,205 558,694 9,197 601,234 93% 51% 54% 6%
2000-01 183 701 242 283,650 1,010 285,786 99% 541 26,832 3,742 530,376 8,952 570,443 93% 50% 53% 5%
1999-00 175 700 226 274,849 1,038 276,988 99% 537 26,471 3,214 516,601 8,497 555,320 93% 50% 53% 6%
1998-99 175 662 284 267,435 994 269,550 99% 534 25,507 3,028 496,790 7,753 533,612 93% 51% 54% 6%
1997-98 163 673 290 260,126 991 262,243 99% 508 25,807 2,828 483,320 7,289 519,752 93% 50% 54% 6%
1996-97 152 775 288 251,676 1,056 253,947 99% 473 24,543 2,648 479,359 6,990 514,013 93% 49% 53% 7%
1995-96 133 763 320 239,076 1,067 241,359 99% 494 23,253 2,197 447,174 6,229 479,347 93% 50% 53% 7%
1994-95 127 1,102 255 225,006 1,106 227,596 99% 455 23,991 1,896 422,698 6,065 455,105 93% 50% 53% 8%
1993-94 112 862 201 207,677 1,012 209,864 99% 392 21,851 1,643 396,437 5,543 425,866 93% 49% 52% 7%
1992-93 103 2,525 271 193,471 1,255 197,625 98% 363 20,872 1,570 370,502 5,204 398,511 93% 50% 52% 15%
Appendix 3: Trends in Bilingual Enrollment and ELL Population, Texas Public Schools, 1992-2007
*Note: To avoid the erratic data in 1992-93, the change for Asians is calculated from 1993-94 to 2006-07. Source: Texas Education Agency
Total % of Total % of ELL in Bilingual
PK 78,999 59,790 10.7% 15.1% 75.7%
KG 96,076 69,872 13.0% 17.6% 72.7%
1 100,637 71,299 13.7% 18.0% 70.8%
2 92,665 63,564 12.6% 16.0% 68.6%
3 84,919 56,748 11.5% 14.3% 66.8%
4 59,329 39,592 8.1% 10.0% 66.7%
5 47,970 29,917 6.5% 7.5% 62.4%
6 34,765 5,363 4.7% 1.4% 15.4%
Total 736,707 396,951 100% 100% 53.9%
Appendix 4: % ELL and Bilingual Education by Grade,* Texas Public Schools, 2006-07
*Note: These and other enrollment data will vary slightly because one unfortunate decision made by someone in the Texas Education Agency is to not only mask student achievement outcomes where there are 1-4 students of a group in a school in records made available to the public, but also to mask the number of students in that group if there are 1-4. The only legal requirement of FERPA (Fam-ily Education Right to Privacy Act), however, is to mask the outcomes. Indeed, since -999 in the Texas data base means that the number of students in that group is 1, 2, 3, or 4, the anonymity of the group is not protected since one knows the number is either 1, 2, 3, or 4. Masking the outcome is sensible since one has no way of knowing what that is as it could vary tremendously. I was, however, unable to persuade the one bureaucrat I communicated with of the foolishness of the rule of “masking” a small group’s size when one knows that it is 1, 2, 3, or 4. This is hardly “mask-ing” and it is completely unnecessary since the outcomes for these groups are masked. Since I was unable to get the actual number in a group for schools that have -999, I chose the midpoint between 1-4 which is 2.5. All schools with 2.5 in actuality have anywhere from 1-4 in a group. These data points were only used for the descriptive tables, not for any statistical analysis.
Reading Math Writing Social Studies Science
*Note: Charter and special education schools excluded. Source: Texas Education Agency
Appendix 5: % of Students Tested in English TAKS Tests Grades 3-11, Texas Public Schools, 2006-07*
Appendix 6: Technical Note on Solving Equations
Appendix 6a, 6b, 6c shows multiple regression equations, one for each elementary grade (3, 4, 5) and one for each test (reading, math, writing, and sci-ence). These equations explain the causes of variation in the percentage of ELL students tested on the TAKS in English at each grade (the dependent variable) for regular elementary schools (excluding special education, alternative, and charter schools) and schools with enough ELL students in a grade (10) to actually make it i scally feasible to have a bilingual education program by combining two grades. The explanatory variables (aka the independent variables) are the percentage of ELL students in that grade enrolled in bilingual education, the percentage poor in the school, and the percentage ELL of that grade. In order to know the independent ef ect of bilingual education on the percentage of ELL tested, one must control for the percentage ELL in a grade. Since ELL students, and ELL students enrolled in bilingual education, tend to be poorer than others and poor students have relatively high absentee rates and mobility rates, we would want to control for that as well in order to know the independent ef ect of bilingual education on the percentage of ELL tested.
In the following tables, the column labeled “b” shows the change in the percentage tested for a one unit change in the independent variable. The column labeled “Beta” shows the relative importance of the independent variable compared to the other independent variables. The column labeled “Sig.” is the statistical signii cance of the variable. If the signii cance level is .000, this means that the relationship could not have happened by chance. If the signii -cance level is .05 or less, the relationship could have happened by chance only 5 or less times out of 100. If the signii -cance level is between .05 and .10, the relationship could have happened by chance only 10 times or less out of 100.
3rd Grade 4th Grade 5th Grade
Dependent Variable Avg. b Std.
Error Beta Sig. Avg. b
Std.
Error Beta Sig. Avg. b
Std.
Error Beta Sig.
% ELL Tested in Grade 60.9 57.1 62.3
Independent Variables
% ELL in BE in Grade 61.2 -.397 .018 -.49 a 0.000 67.0 -.326 .018 -.43 a 0.000 64.2 -.137 .016 -.234 a 0.000
% Poor in School 73.7 -.160 .034 -.12 a 0.000 77.8 .032 .040 .02 0.425 78.5 .012 .036 .010 a 0.743
% ELL in Grade 37.7 .055 .035 .04 0.119 32.9 -.109 .042 -.07 a 0.009 28.2 -.008 .042 -.006 0.849
Constant 94.998 1.947 a 0.000 79.999 2.561 a 0.000 70.362 2.476 a 0.000
Adjusted R2 .290 .201 0.052
Number of Schools 2,103 1,625 1,418
Appendix 6a: Social and Program Characteristics that Aff ect the % of ELL Students Tested on TAKS English Reading, Texas Public Schools,* 2006-07
3rd Grade 4th Grade 5th Grade
Dependent Variable Avg. b Std.
Error Beta Sig. Avg. b
Std.
Error Beta Sig. Avg. b
Std.
Error Beta Sig.
% ELL Tested in Grade 63.7 62.1 67.4
Independent Variables
% ELL in BE in Grade 61.2 -0.369 0.019 -0.45 a 0.000 67.0 -0.284 0.019 -0.38 a 0.000 64.2 -0.093 0.015 -0.17 a 0.000
% Poor in School 73.7 -0.198 0.035 -0.14 a 0.000 77.8 0.018 0.040 0.01 0.651 78.5 -0.006 0.035 -0.01 0.860
% ELL in Grade 37.7 0.133 0.036 0.09 a 0.000 32.9 -0.097 0.042 -0.06 a 0.022 28.2 0.032 0.040 0.03 0.430
Constant 95.765 2.020 a 0.000 82.944 2.600 a 0.000 72.933 2.357 a 0.000
Adjusted R2 0.242 0.159 0.025
Number of Schools 2,103 1,625 1,418
Appendix 6b: Social and Program Characteristics that Aff ect the % of ELL Students Tested on TAKS English Math, Texas Public Schools, 2006-07
Appendix 6c: Social and Program Characteristics that Aff ect the % of ELL Students Tested on TAKS English Writing & Science, Texas Public Schools,* 2006-07
4th Grade Writing 5th Grade Science
Dependent Variable Avg. b Std.
Error Beta Sig. Avg. b
Std.
Error Beta Sig.
% ELL Tested in Grade 54.8 66.9
Independent Variables
% ELL in BE in Grade 67.0 -0.348 0.019 -0.45 a 0.000 64.2 -0.056 0.016 -0.10 a 0.000
% Poor in School 77.8 0.028 0.041 0.02 0.495 78.5 -0.016 0.036 -0.01 0.656
% ELL in Grade 32.9 -0.100 0.043 -0.06 a 0.019 28.2 0.052 0.042 0.04 0.211
Constant 79.194 2.615 a 0.000 70.344 2.434 a 0.000
Adjusted R2 0.213 0.007
Number of Schools 1,625 1,418
Notes for Appendices 6a-6c: a Statistically signii cant at .05 or better.
3rd Grade 4th Grade 5th Grade
Dependent Variable Avg. b Std.
Error Beta Sig. Avg. b
Std.
Error Beta Sig. Avg. b
Std.
Error Beta Sig.
Reading/ELA 2241 2152 2119
Independent Variables
% ELL in BE in Grade 57.5 0.061 .048 .04 .203 64.5 0.036 .056 .02 .523 63.9 0.163 .053 .09 a .002
% Poor in School 72.5 -1.128 .084 -.39 a .000 77.4 -1.135 .113 -.32 a .000 78.9 -1.189 .118 -.32 a .000
% ELL in Grade 37.8 0.184 .090 .06 a .041 32.8 0.719 .120 .19 a .000 28.6 0.853 .135 .21 a .000
% ELL Tested in Grade 67.6 -0.436 .064 -.17 a .000 62.9 -0.405 .084 -.14 a .000 65.0 -0.270 .097 -.08 a .005
Constant 2342 7.540 a .000 2240 9.934 a .000 2195 10.910 a .000
Adjusted R2 0.115 0.080 .081
Number of Schools 1,866 1,442 1,333
Notes for Appendices 7a-7c: a Statistically signii cant at .05 or better.
*Selecting only regular schools (excluding charter, X, Alt. 1, 2, 3) and selecting schools with ELL in grade >=10.
3rd Grade 4th Grade 5th Grade
Dependent Variable Avg. b Std.
Error Beta Sig. Avg. b
Std.
Error Beta Sig. Avg. b
Std.
Error Beta Sig.
Math 2215 2204 2212
Independent Variables
% ELL in BE in Grade 57.7 0.136 .061 .06 a .027 64.9 .206 .066 .09 a .002 64.1 .449 .068 .19 a .000
% Poor in School 72.5 -1.370 .109 -.38 a .000 77.5 -1.198 .136 -.28 a .000 78.9 -.900 .153 -.19 a .000
% ELL in Grade 37.9 0.473 .116 .13 a .000 32.8 .611 .142 .14 a .000 28.6 .784 .175 .15 a .000
% ELL Tested in Grade 70.3 -0.345 .080 -.11 a .000 67.3 -0.437 .100 -.12 a .000 69.3 -.140 .130 -.03 .281
Constant 2313 9.578 a .000 2293 12.065 a .000 2242 14.621 a .000
Adjusted R2 .085 .065 .059
Number of Schools 1,878 1,476 1,360
4th Grade Writing 5th Grade Science
Dependent Variable Avg. b Std.
Error Beta Sig. Avg. b
Std.
Error Beta Sig.
Writing & Science 2255 2089
Independent Variables
% ELL in BE in Grade 63.7 .009 .064 .00 .891 64.5 .196 .080 .07 a .014
% Poor in School 77.2 -1.095 .131 -.28 a .000 79.0 -1.035 .180 -.19 a .000
% ELL in Grade 32.9 .893 .139 .21 a .000 28.8 1.156 .204 .19 a .000
% ELL Tested in Grade 61.8 -.267 .095 -.08 a .005 69.4 -.348 .150 -.06 a .021
Constant 2327 11 a .000 2149 17 a .000
Adjusted R2 .056 .039
Number of Schools 1,403 1,344
Appendix 7a: Social and Program Characteristics Aff ecting the Average Scale Score of ELL Students on TAKS English Reading, Texas Public Schools,* 2006-07
Appendix 7b: Social and Program Characteristics Aff ecting the Average Scale Score of ELL Students on TAKS English Math, Texas Public Schools,* 2006-07
Notes for Appendices 8a-8c: a Statistically signii cant at .05 or better. b Statistically signii cant at .10 or better.
*Selecting only regular schools (excluding charter, X, Alt. 1, 2, 3) and selecting schools with ELL in grade >=10.
3rd Grade 4th Grade 5th Grade
Dependent Variable Avg. b Std.
Error Beta Sig. Avg. b
Std.
Error Beta Sig. Avg. b
Std.
Error Beta Sig.
Reading/ELA 160569 143158 143480
Independent Variables
% ELL in BE in Grade 49.1 -539 32 -0.39 a 0.000 56.7 -509 30 -0.41 a 0.000 57.3 -250 28 -0.24 a 0.000
% Poor in School 67.8 -97 53 -0.04 b 0.071 73.5 -23 61 -0.01 0.707 75.7 -69 58 -0.03 0.239
% ELL in Grade 32.9 -509 63 -0.21 a 0.000 28.9 -423 71 -0.16 a 0.000 25.6 -319 74 -0.13 a 0.000
Constant 210270 2808 a 0.000 185955 3605 a 0.000 171165 3723 a 0.000
Adjusted R2 0.326 0.261 0.115
Number of Schools 2,260 1,726 1,587
Appendix 8a: Social and Program Characteristics that Aff ect the Weighted Average Scale Score of ELL Students Tested on TAKS English Reading, Texas Public Schools,* 2006-07
3rd Grade 4th Grade 5th Grade
Dependent Variable Avg. b Std.
Error Beta Sig. Avg. b
Std.
Error Beta Sig. Avg. b
Std.
Error Beta Sig.
Math 163662 154904 158601
Independent Variables
% ELL in BE in Grade 49.2 -464 32 -0.35 a 0.000 57.051 -420 31 -0.35 a 0.000 57.5 -169 28 -0.17 a 0.000
% Poor in School 67.8 -165 54 -0.08 a 0.002 73.611 -42 62 -0.02 0.500 75.6 -148 58 -0.08 a 0.010
% ELL in Grade 32.9 -346 64 -0.14 a 0.000 28.869 -374 72 -0.14 a 0.000 25.4 -178 74 -0.07 a 0.017
Constant 209046 2853 a 0.000 192745 3654 a 0.000 184035 3692 a 0.000
Adjusted R2 0.253 0.195 0.064
Number of Schools 2,275 1,770 1,627
Appendix 8b: Social and Program Characteristics that Aff ect the Weighted Average Scale Score of ELL Students Tested on TAKS English Math, Texas Public Schools,* 2006-07
Appendix 8c: Social and Program Characteristics Aff ecting the Weighted Scale Score of ELL Students on TAKS English Writing & Science, Texas Public Schools,* 2006-07
4th Grade Writing 5th Grade Science
Dependent Variable Avg. b Std.
Error Beta Sig. Avg. b
Std.
Error Beta Sig.
Writing & Science 147433 148991
Independent Variables
% ELL in BE in Grade 56.2 -535 33 -0.40 a 0.000 58.5 -110 27 -0.11 a 0.000
% Poor in School 73.5 26 78 0.01 0.694 76.3 -125 57 -0.07 a 0.028
% ELL in Grade 29.1 -496 67 -0.18 a 0.000 25.8 -168 71 -0.07 a 0.018
Constant 189960 3958 a 0.000 169331 3698 a 0.000
Adjusted R2 .26 0.039
Appendix 9: Technical Note on Estimating the Cost of Bilingual Education in Texas
Appendix 9a shows the relationship between the percentage of an elementary school enrolled in bilingual education and the total and instructional expenditures of a school in regular public schools (excluding charter and special education schools) with at least 80 ELL students (the equivalent of 10 per grade PK-6) in 2005-06, the latest year available as of the writing of this report. As expected, size is negatively related to both total and instructional expenditures because of economies of scale. In addition, the percentage of students who are special education is far and away the biggest predictor of expenditures because the state funding weight given to special education is far greater than the other categories, including bilingual/ESL.
The percentage ELL of a school is a stronger predictor of total and instructional expenditures than is the percentage of the school enrolled in bilingual education. This is not surprising since the funding legislation includes all programs for ELL students, not just bilingual education. Since the dependent vari-able is school, not grade, expenditures, the percentage of the school enrolled in bilingual education seemed to be a better explanatory varivari-able than the percentage of the ELL population in a grade enrolled in bilingual education, used in earlier analyses that had outcome data by grade.
Appendix 9a: Social and Program Characteristics that Aff ect the Per Pupil Expenditures, Texas Elementary Schools,* 2005-06
Total Expenditures Instructional Expenditures
Dependent Variable Avg. b Std.
Error Beta Sig. Avg. b
Std.
Error Beta Sig.
Total Per Pupil Expenditures 5062 4130
Independent Variables
Total Enrollment of School 655 -1.757 .073 -.468 a .000 655 -1.174 .060 -.403 a .000
% Special Education of School 9.0 78.586 5.118 .302 a .000 9.0 61.300 4.210 .303 a .000
% Poor in School 76.8 .088 .858 .002 .919 76.8 -.209 .706 -.008 .767
% of School in Bilingual Education 29.3 4.284 1.566 .120 a .006 29.3 2.246 1.288 .081 b .081
% ELL of School 38.9 5.918 1.769 .148 a .001 38.9 5.001 1.455 .161 a .001
Constant 5143 103.04 a .000 4103 84.765 a .000
Adjusted R2 .379 .304
Number of Schools 1,784 1,784
Notes for Appendix 9a: a Statistically signii cant at .05 or better. b Statistically signii cant at .10 or better.
The Texas Public Policy Foundation is a 501(c)3 non-proi t, non-partisan research institute guided by the core principles of individual liberty, personal responsibility, private property rights, free
markets, and limited government.
The Foundation’s mission is to lead the nation in public policy issues by using Texas as a model for reform. We seek to improve Texas by generating academically sound research and data on state
issues, and recommending the i ndings to policymakers, opinion leaders, the media, and general public.
The work of the Foundation is primarily conducted by staf analysts under the auspices of issue-based policy centers. Their work is supplemented by academics from across Texas and the nation.
Funded by hundreds of individuals, foundations, and corporations, the Foundation does not accept government funds or contributions to inl uence the outcomes of its research. The public is demanding a dif erent direction for their government, and the Texas Public Policy
Foundation is providing the ideas that enable policymakers to chart that new course.
Texas Public Policy Foundation
Christine Rossell, Ph.D.holds the Maxwell Chair in United States Citizenship and is the former chairman of the Political Science Department at Boston University. Her research interests include
bilingual education, school desegregation, and educational policy. She has been conducting research and writing on school desegregation for more than 34 years and on bilingual education
for more than 29 years.
Dr. Rossell has written i ve books. Her most recent book on bilingual education, co-authored with Keith Baker is Bilingual Education in Massachusetts, published in 1996 by Pioneer Institute of Boston. Her most recent book on school desegregation, School Desegregation in the 21st Century, co-edited
with David Armor and Herbert Walberg, was published in 2002 by Praeger. She has published numerous articles, book chapters, and technical reports on school desegregation, bilingual education, and other educational issues for numerous journals and for research organizations such
as the Lexington Institute, the Wissenschaftszentrum Berlin für Socialforschung (WZB), the Rand Corporation, American Institutes for Research, and for the U.S. Government, several states, and
many school districts throughout the U.S.
Dr. Rossell has been a consultant to and/or expert witness in more than 60 educational equity court cases, and has helped design and defend 11 magnet-voluntary desegregation plans. In