LOCAL BUDGETS STUDY 2010 (AAD)
An analysis of local budgets in 5 provinces and 42 kabupatens and cities throughout Indonesia
Based on research conducted by 28 NGOs under the overall direction of the National Secretariat of the Indonesian Forum for Budget Transparency (Seknas FITRA)
Sponsored by:
The Asia Foundation
UKaid Royal Netherlands Embassy
Published: February 2011
Table of Contents
Glossary of Terms and Abbreviations ... 4
1. Preface ... 6
1.1 Introduction ... 6
1.2 Research Objectives ... .. 6
1.3 Methodology ... 7
2. Analysis of Local Revenue ... 10
2.1 Analysis of Growth of Local Revenue... 10
2.2 Analysis of Revenue per Person... . 11
2.3 Analysis of Local Revenue Sources... 12
2.4 Regional Fiscal Transfers ... . 13
2.5 Other Lawful Own-Source Revenue... 15
2.6 Local Own-Source Revenue... . 18
3. Analysis of Local Expenditure... 19
3.1 General Analysis of Expenditure... 19
3.2 Analysis of Components of Expenditure... 21
3.3 Direct Per Capita Expenditure... 22
3.4 Expenditure on Social Aid and Grants... 22
4. Analysis of Planning, Financing and Fiscal Space ... 24
4.1 Budget Planning and Revision Processes... . 24
4.2 Budget Surpluses (SiLPA) ... 25
4.3 Analysis of Fiscal Space... . 27
5. Analysis of Local Infrastructure Budgets... 28
5.1 Expenditure on Public Works... 28
5.2 Direct and Indirect Expenditure on Public Works………... 29
5.3 Expenditure on Roads and Bridges... 31
5.4 Expenditure on Irrigation Programs... 33
5.5 Expenditure on Clean Water Programs... 33
6. Analysis of Education Budgets ... ... 35
6.1 General Analysis of Expenditure of Local Education Departments... 35
6.2 Direct and Indirect Expenditure of Local Education Departments... 37
6.3 Ratio between Education Expenditure and Pupil/Teacher Numbers... 38
6.4 Programs Supporting Increased School Participation Rates (APS)... 38
6.5 Programs Supporting Better Quality Education……... 39
6.6 Programs Supporting Non-Formal Education... 40
7. Analysis of Health Budgets……... 41
7.1 Analysis of Expenditure on Health ... 41
7.2 Direct and Indirect Expenditure on Health Services and Hospitals…… ... 42
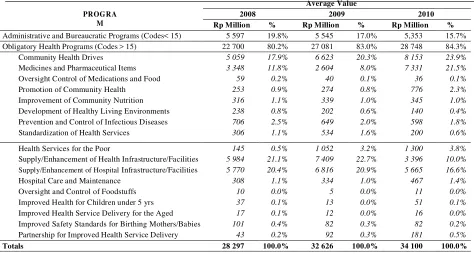
7.3 Health Services and Hospital Programs Involving Direct Expenditure... 44
8. Analysis of Budgets for Womens Empowerment…..... 45
... ... 46
8.3 Programs Supporting Enhanced Womens Participation in Development... 47
8.3 Programs Supporting Protection of Women and Children………. ... 48
9. Conclusions and Recommendations... 50
Translator’s Note re Graphs:
Unfortunately, the many graphs that feature in the Indonesian text of this document—titled ―Studi
4
Glossary of Terms and Abbreviations
AAD Analasis Anggaran Daerah—Analysis of local budgets
Adjustment funds Dana penyesuaian—a form of fiscal transfer from the Center to regions: a source of ―other local own-source revenue‖ (LPDS) (see Tables 1.2 (p.8) and 2.1 (p. 16))
APBD Anggaran Pendapatan dan Belanja Daerah—local government budget as
approved by DPRD
APBD-M Anggaran Pendapatan dan Belanja Daerah-Murni—(unaltered) local government
budget as approved by DPRD and not yet revised: same as APBD
APBD-P Anggaran Pendapatan dan Belanja Daerah-Perubahan—(mid-year) revised local government budget as approved by DPRD
APBD-R Anggaran Pendapatan dan Belanja Daerah-Realisasi—realized local government
budget (end-of-year local budget outcomes)
APBN Anggaran Pendapatan dan Belanja Negara—State Budget as approved APS Angka Partisipasi Sekolah—school participation rate
BL Belanja langsung—direct expenditure (see that entry below)
BTL Belanja tidak langsung—indirect expenditure (see that entry below)
DAK Dana Alokasi Khusus—Special Purpose Fund
DBH Dana Bagi Hasil—Reven ue Sharing Fund, a mechanism for fiscal transfers fr om Center to region s
DAU Dana Alokasi Umum—Gen eral Allocation Fund, a mechanism for fiscal
transfers fr om Center to region s
bansos bantuan sosial: social aid, a line item of indirect expenditur e in Indon esian budgets available for expen diture for specific deser ving social causes dana perimbangan Fiscal balance transfers fr om the Center to local governments in region s to
reduce fiscal imbalances between the Center and region s and among region s dana pen yesuaian adjustment funds (see entr y above)
dekon sentrasi the delegation of auth ority (and funds) fr om the Center to a regional
government or a central govern ment official station ed a region to perfor m a not yet decentralized function
direct expenditure Belanja langsung (BL): also known as ―development expenditure‖: costs incurred by a work unit in implementing a specific program or activity (cf. indirect expenditure) DPD Dewan Perwakilan Daerah—House of Representatives of the Regions, the ―upper‖
chamber of the Indonesian Parliament
PDF PPD Dana Penguatan Desentralisasi Fiskal Percepatan Pembangunan Daerah—Fund to
Strengthen Fiscal Decentralization to Speed up Regional Development, a dana penyesuaian program
DPID Dana Infrastruktur Daerah—Fund for the Strengthening of Local Infrastructure, a dana penyesuaian program
DPIP Dana Percepatan Infrastruktur Pendidikan —Fund to Speed up Development of
Educational Infrastructure, a dana penyesuaian program
DPIPD Dana Penguatan Infrastruktur dan Prasarana Daerah –Fund to Strengthen Local
Infrastructure and Public Facilities, a dana penyesuaian program
DPR De wan Perwakilan Rakyat—the House of Repr esentatives (national parliament)
DPRD Dewan Perwakilan Rakyat Daerah—local legislative assembly: the legislative
5
wing of government at the provincial, kabupaten and city level
DISP Dana Infrastruktur Sarana dan Prasarana—Fund for Infrastructure and Public Facilities, a dana penyesuaian program
FGD Focus group discussion
Fiscal space a government’s degree of spending discretion (see footnote 13, page 27)
GDP Gr oss Domestic Product
HDI Human Development Index
HOG head of local government (govern or (pr ovin ce), bupati (kabupaten) or
mayor (city))
indirect expenditure Belanja tidak langsung (BTL): also termed ―routine expenditure‖: common costs incurred by a work unit in implementing the whole gamut of its programs (cf. direct expenditure)
kabupaten One of sub-national governments in Indonesia, along with provinces and cities kecamatan sub-district: unit of government administration immediately below level of
kabupaten and city
local government Pemerintah daerah—any sub-national government (provincial, kabupaten or city)
LPDS Lain Pendapatan Daerah yang Sah—other lawful local revenue
PAD Pendapatan Asli Daerah—local own-source revenue
PND Pendapatan Dalam Negeri—domestic revenue at the national level
Pemda Pemerintah daerah—any sub-national government (province, kabupaten or city)
Pemekaran daerah the splitting of an existing region to form two new autonomous regions Pilkada Pemilihan kepala daerah: popular election (every 5 years) of a local head of
government (HOG: see entry above)
PMK Peraturan Menteri Keuangan—Minister of Finance regulation
Posyandu Pos Pelayanan Terpadu—integrated (health) service post (most often at village level)
PP Peraturan Pemerintah—central government regulation
Puskesmas Pusat Kesehatan Masyarakat—community health center (usually located at
kabupaten or kecamatan level)
RAPBD Rancangan Anggaran Pendapatan dan Belanja Daerah—draft local budget
Region any sub-national government area (province, kabupaten and city) in Indonesia
Retribusi fees and charges collected by government for goods & services rendered
SIKD Sistem Informasi Keuangan Daerah—Regional Financial Information System
SiLPA Sisa Lebih Penggunaan Anggaran—budget surplus carried forward to next fiscal
year
6
1.
Preface
1.1
Introduction
One of the indicators of the extent to which government pays special attention to the poor and women is its budget policies. By looking at governmental decisions on budget allocations, a community can get a sense of whether government is promoting economic growth and delivering an adequate level of basic public services. Accordingly, local budgets are reflections of political intent and determine the level of welfare enjoyed by the general public.
As a continuation of their study in 2009, 28 community organizations resumed the study of local budgets (Local Budgets Study (LBS)) and completed it during 2010-11.Coordinated by the National Secretariat of the Indonesian Forum for Budget Transparency (Seknas Fitra) and The Asia Foundation, the study embraced 42 kabupatens and cities and 5 provinces in Indonesia. The LBS covered two areas:
(i) An evaluation of the performance of local governments throughout the entire budget cycle and of the extent to which their budgetary processes were in accord with principles of good governance, viz. transparency, participation, public accountability and gender-responsiveness. This study is called Performance in Management of Local Budgets (KIPAD).
(ii) An analysis of local budgets to ascertain the extent to which they have been structured and used to meet the needs of the community, especially the poor and women. This second study is called Analysis of Local Budgets (AAD).
This current document only presents the findings of the AAD study. KIPAD is the subject of a separate report.
1.2
Research Objectives
The aims of the AAD project were to assess the latest state of local fiscal management and to undertake a comparative study of performance in the provinces, kabupatens and cities studied. The study focused principally on three key elements of local budgets: revenue, expenditure and financing. In order to form a judgment on the extent to which expenditure was pro-poor, the study had a close look at public works, education and health spending in the regions studied. The extent to which governments observed gender-mainstreaming principles was also analyzed.
This research represented an effort by civil society to provide inputs to government. We hope that the research findings will become a resource for kabupatens and cities in their efforts to achieve a higher level of pro-poor and pro-women spending, to reduce poverty and to deliver better public services. In the case of provinces and the central government, we hope that our research findings can be used as a tool for monitoring the quality of local government budget management performance; and will help refine budget policies and identify the kinds of technical assistance local governments need in their efforts to lift their performance. Hopefully our research will contribute to improved budget management by government at all levels—the Center, provinces, kabupatens and cities— and help to streamline the supervisory and supportive role of central and provincial governments over front-line public service providers— kabupatens and cities.
7
will also hopefully come to see that what one government is doing can be benchmarked by others—even though that process would not be on a par with following ―best practice‖, from abroad for example.
We also hope that our research can contribute to more effective budget advocacy and more productive dialogue between civil society and government. Civil society networks were involved in our research in a number of areas. Hopefully that experience will make civil society organizations (CSOs) more adept at undertaking research and help them to become more effective advocates of pro-poor and pro-women budgeting and public policy. Evidence-based advocacy will, we hope, enhance the quality of dialogue
between stakeholders and increase the likelihood that CSOs’ advocacy campaign will have the desired
impact.
1.3
Methodology
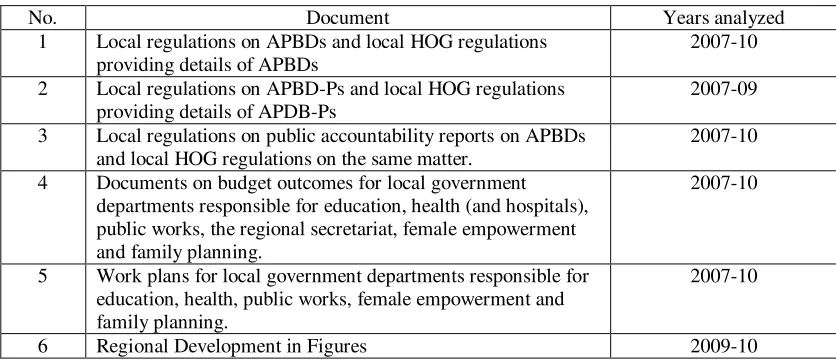
This research was carried out by way of an analysis of local budget (APBD) documents and various other types of development and financial data for the period 2007-10.1 The main documents collected in various regions and analyzed in this study are tabulated in Table 1.1. Other kinds of data were used to verify and enrich the analysis: budgetary information from the Ministry of Finance in its Regional
Financial Information System (SIKD) and in its data on regional fiscal balance funding and regional
adjustment funding; the results of the 2010 Population Census (Central Bureau of Statistics (BPS)); and a variety of data on development in various sectors.
Table 1.1 Main Regional Documents Analyzed
No. Document Years analyzed
1 Local regulations on APBDs and local HOG regulations providing details of APBDs
2007-10 2 Local regulations on APBD-Ps and local HOG regulations
providing details of APDB-Ps
2007-09 3 Local regulations on public accountability reports on APBDs
and local HOG regulations on the same matter.
2007-10 4 Documents on budget outcomes for local government
departments responsible for education, health (and hospitals), public works, the regional secretariat, female empowerment and family planning.
2007-10
5 Work plans for local government departments responsible for education, health, public works, female empowerment and family planning.
2007-10
6 Regional Development in Figures 2009-10
In general analysis focused on three principal elements of APBDs, viz. revenue, expenditure and financing. The LBS team analyzed APBDs as a whole (see Table 1.2for details of budget structure), the three sectors most likely to help alleviate poverty (education, health and public works) and local financing & fiscal space as reflected in APBDs. In general, budget appropriations were analyzed— both in terms of nominal value (at current prices) and real value (based on constant prices). We considered their rate of growth; their relative size vis-à-vis total budgets and local GDP numbers; the proportion of direct
expenditure (BL) and indirect expenditure (BTL) involved; and how appropriations measured up in terms of service users (population, school pupils) and outcomes (e.g.length or roads, number of class rooms).
1
8
Several important programs in the three sectors under study were also analyzed. Our research also examined funding directed at gender mainstreaming and programs to empower women.
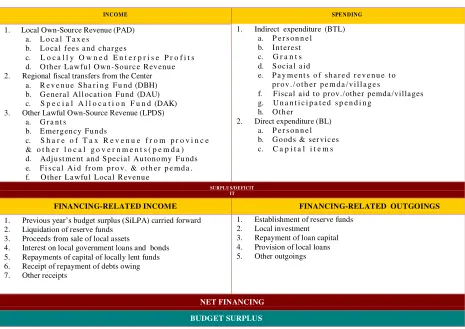
Table 1.2 Structure of APBDs Based on Home Affairs Ministerial Regulation 13/2006
INCOME SPENDING 2. Regional fiscal transfers from the Center
a. R e v e n u e S h a r i n g F u n d (DBH)
1. Previous year’s budget surplus (SiLPA) carried forward 2. Liquidation of reserve funds
3. Proceeds from sale of local assets
4. Interest on local government loans and bonds 5. Repayments of capital of locally lent funds 6. Receipt of repayment of debts owing 7. Other receipts
This research analyzed the budgets of 26 kabupaten, 16 city and 5 provincial governments (see Graph 1.1). The areas studied were also target areas of the Civil Society Initiative against Poverty (CSIAP) and
the Gender Responsive Budget Initiative (GBRI) developed by the Asia Foundation and local partners.
CSIAP and GBRI have virtually the same objective: to strengthen the role played by civil society groups (both NGOs and other organizations) in changing local budgetary policies to make them more pro-poor and gender-responsive. CSIAP is supported by the British Government (Department for International Development (DFID)) and GRBI by the Dutch Government (Royal Netherlands Embassy).
The research involved 28 local NGOs.At the national level, Seknas FITRAacted as research
9
Graph 1.1 Areas Researched in the Local Budgets Study (LBS)
10
2.
Analysis of Local Revenue
2.1
Analysis of Growth of Local Revenue
Although nominal local budget revenue increased continuously in the period 2007-10, its rate of growth slowed during the period and in fact fell in real terms in 2008-09. Local budget revenue growth was very strong in 2007-08, reaching 13% in real terms for the provincial governments studied.
Nevertheless, the high rate of inflation in 2008—on average 10.3% in the 24 kabupatens2and 11.0% in each of the 16 city and 5 provincial governments surveyed—turned the nominal rate of growth of between 5% and 7% into a negative figure. This situation persisted in the following year within kabupatens. An average nominal growth rate of only 3% in 2009-10 was again turned into a negative number in real terms, given inflation for 2009 stood at 5.2%.3
Revenue in city areas grew more strongly than in kabupatens (Graph 2.1). Although revenue in cities fell by an average of 4% in 2008-09, it was nonetheless higher than in kabupatens(where it fell by as much as 5%). In the 16 cities under study, revenue grew at an average of 1%, whereas in kabupatensit fell by 2%.
As illustrated in Graph 2.2, except for 2008-09, revenue grew more strongly in the 5 provincial governments than in the kabupatens and cities under study. South Sumatera’s government suffered a very significant decrease in revenue in 2008-09, falling 7% in nominal terms (16% in real terms). Only East Java’s government was able to increase its revenue in 2008-09 (up 1%), while the other 3 suffered declines in real revenue. In 2007-08, the opposite had happened: the revenue of all five provincial governments had grown strongly by between 11% (South Sumatera) and 15% (West Java) in real terms. In 2009-10 the average rate of revenue growth in provincial governments was positive, with strong growth rates in two—South Sumatera (31% nominal, 18% real) and West Nusa Tenggara (12% nominal, 8% real—counterbalancing negative growth in real terms in the other three.
2
Not included in this calculation are North Gorontalo which was formed only in 2007 and West Lombok which was divided to becom e West Lombok and North Lombok in 2008.
3 Given that projected revenue in APBD-Ms was generally lower than actual revenue in APBD-Rs (see discussion in Chapter 4), the rate of
decline in real revenue in the kabupatens was possibly even greater.
11
8
% Graph 2.2 Nominal and Real Revenue Growth in 5 Provincial Governments, 2007-10
(This graph is available only in the Indonesian text of this publication)
Source: APBD-Rs for 2007-09 and APBD-Ms for 2010, processed by the LBS team.
Three cities (Surakarta, Padang and Surabaya) as well as West Sumbawa and North Gorontalo4 had the highest average revenue growth rates during 2007-10. North Gorontalo’s revenue rose dramatically in light of its status as a new kabupaten(formed only in 2007). In real terms its revenue jumped 336% (2007-08) and 66% (2008-09), but declined in 2010 even in nominal terms. In the case of West Sumbawa, real revenue rose by 19% (2009-2010) because of an agreement between the kabupatengovernment and a mining company that promised grant funding of around Rp 63 billion5 in 2010. In addition, there was an increase under other lawful own-source revenue (LPDS) of Rp 11 billion bringing total revenue to Rp 22 billion.
Graph 2.3 Revenue in 10 Kabupatens with the Highest and Lowest Growth Rates, 2007-10, Based on Constant 2007 Prices
(This graph is available only in the Indonesian text of this publication)
Source: APBD-Rs for 2007-09 and RAPBDs for 2010, processed by Seknas FITRA
The three kabupatens in Aceh and the cities of Banjar and Palu had the lowest average rate of revenue growth among the 42 kabupatens and cities under study. Revenue in the 3 kabupatens in Aceh declined sharply in 2009 as a result of a decline in Revenue Sharing Fund (DBH) allocations. Based on constant 2007 prices, North Aceh’s DBH receipts declined from Rp 467 billion (2008) to Rp 294 billion (2009), those of Aceh Besar from Rp 48 billion to Rp 26 billion and those of West Aceh from Rp 40 billion to Rp 25 billion. Meanwhile, the city of Banjar sustained drastic drops in revenue of 25% in 2008 and 17% in 2010, principally as a result of a decline in receipts from the General Allocation Fund (DAU) from Rp 274 billion (2008) to Rp 177 billion in 2009. As for the city of Palu’s declining revenue, the main contributing factor was declining levels of provincial and other government fiscal aid from Rp 25 billion in 2009 to just Rp 2 billion in its APBD-M in 2010.
2.2 Analysis of Revenue Per Person
In general, the revenue of a kabupaten or city was in direct proportion to its total population (see Graph 2.4). The average revenue of the 42 kabupatens and cities for the 4 years studied (2007-10) was Rp 653 billion/year; and their average population was 770 000 people (2010). Of the 42, the city of Surabaya topped the list both for revenue (Rp 2.3 trillion/year) and population (2.8 m). By contrast, North Gorontalo had the lowest revenue (only Rp 161 billion/year) and was second lowest in terms of
population (just 104 000). The city of Padang Panjang was the least populated urban area (47 000) and had the second lowest level of revenue (Rp 232 billion/year).
Graph 2.4 Average Revenue (2007-10, Based on Constant 2007 Prices) Compared to Total Population
(This graph is available only in the Indonesian text of this publication)
Source: APBD-Rs for 2007, APBD-Ms for 2010 and 2010 Population Census results, processed by the LBS team
Revenue per person was higher on the islands of Sumatera, Kalimantan and Sulawesi than on Java and Lombok. Small populations outside Java and Lombok resulted in much higher levels of revenue per
4
Throughout the whole of this report a region not specifically designated as a ―city‖ is a kabupaten.
12
person there than the average of Rp 1.3 m/person for the 42 kabupatens and cities studied. The city of Padang Panjang’s revenue per person was Rp 4.9 m; in West Sumbawa (population: 115 000) it was Rp 3 m/person. On Java, the cities of Blitar and Banjar—with populations of 132 000 and 175 000
respectively—achieved average revenue over Rp 1.5 m/person. By contrast, 14 of the 18 regions surveyed on Java had average revenue of less than Rp 1 m/person. On the bottom of that list were Malang and Garut—with revenue of just ±Rp 0.5 m/person. High population levels in the three kabupatens on Lombok—between 600 000 and 1.1 m—resulted in very low revenue numbers: ±Rp 0.7 m/person.
Graph 2.5 Average Revenue per Person, 2007-10, Based on Constant 2007 Prices
(This graph is available only in the Indonesian text of this publication)
Source: APBD-Rs for 2007-09 and APBD-Ms for 2010, processed by the LBS team.
2.3
Analysis of Local Revenue Sources
Central government fiscal transfers to regions (dana perimbangan) contributed most revenue in the kabupatens and cities studied; in second place came “other lawful own-source revenue” (LPDS) (Graph 2.6). Cities were slightly less dependent on dana perimbangan than kabupatens: in 2007 they derived 81% of their revenue from such transfers; in 2010 the proportion was 73%; in kabupatens the level of dependency on dana perimbangan fluctuated between 83% and 86% during the period studied (2007-10). As for LPDS, in 2010 it contributed 14% of total revenue in 16 cities and 9% in 26
kabupatens studied—a slightly higher number than ―local own-source revenue‖ (PAD) (13% in cities and 8% in kabupatens).
Large cities and kabupatens with urban characteristics received relatively lower levels of dana perimbangan transfers and had higher levels of local own-source revenue (PAD). The cities of Surabaya and Semarang derived quite substantial amounts of their total revenue from PAD—30% and 20% respectively in 20096. The extent of their dependency on dana perimbangan—54% for Surabaya and 65% for Semarang—was correspondingly less than that of other cities and kabupatens. But a kabupatenwith urban characteristics like Sleman managed to draw on PAD for 16% of its total revenue.
Graph 2.6 Percentage of Revenue Kabupaten/City Revenue by Revenue Source, 2007-10
(This graph is available only in the Indonesian text of this publication)
Source: APBD-Rs for 2007-09 and RAPBDs for 2010, processed by the LBS team
Most of the 19 kabupatens and cities that received less than 80% of their 2009 revenue from central government fiscal balance transfers (dana perimbangan) derived sizeable amounts of revenue from other lawful own-source revenue (LPDS) (Graph 2.7). In all these kabupatens and cities more than 9% of total revenue—the kabupaten average in 2009— came from LPDS. North Gorontalo and the city of Palangka Raya had the highest level of LPDS revenue (reaching 17% of total revenue in 2009).
Graph 2.7 Proportion of Kabupaten/City Revenue by Source, 2009 (APBD-R)
(This graph is available only in the Indonesian text of this publication)
Source: APBD-Rs for 2007-09 and APBD-Ms for 2010, processed by the LBS team.
6
13
Kabupatens outside Java were generally very dependent on dana perimbangan. Almost all of the fourteen kabupatens/cities among the 42 studied that derived more than 85% of their revenue from dana
perimbangan in 2009 were located outside Java (Graph 2.7). Among those, West Aceh, Dompu,
Polewali Mandar, East Lombok and Serdang Bedagai collected limited local own-source revenue (PAD) (less than 5% of total revenue). Situbondo and Bojonegoro in East Java were exceptions: they derived 87% and 85% of their revenue respectively from dana perimbangan and just 6% and 8% respectively from PAD.
The three provincial governments on Java derived most of their revenue from local own-source revenue (PAD), whereas the governments of South Sumatera and West Nusa Tenggara (NTB) relied heavily on dana perimbangan transfers. Generally speaking, during 2007-10, PAD contributed between 67% and 74% of total revenue for the governments of West Java, Central Java and East Java; and dana
perimbangan contributed just 25%-33%. Those proportions remained steady over the period studied. By
contrast, although West Sumatera and NTB derived progressively more revenue from PAD during
2007-10, dana perimbangan transfers remained a more important revenue source for them. The government of
South Sumatera derived 48% of its revenue from PAD in 2010 but just over 50% came from dana
perimbangan. In NTB the degree of dependence was even greater: 60% came from dana perimbangan
compared to 40% from PAD. Meanwhile LPDS contributed very little to provincial government revenue.
Graph 2.8 Contributions of PAD and Regional fiscal transfers system Transfers to Revenue in 5 Provinces, 2007-10
(This graph is available only in the Indonesian text of this publication)
Source: APBD-Rs for 2007-09 and APBD-Ms for 2010, processed by the LBS team.
2.4
Central Government Fiscal Transfers to Regions
Central government fiscal balance transfers via the key elements of the dana perimbangan mechanism—the General Allocation Fund (DAU), the Special Allocation Fund (DAK) and the Revenue Sharing Fund (DBH) —were relatively stable during 2007-10. The only evidence of a downward trend was in the case of DAK transfers to city areas in 2010. But that may have been because details of DAK funding for 2010 had not arrived in time for inclusion in APBD-Ms upon which this study was based. Average DAU transfers to surveyed kabupatens in 2007-10 amounted to 79% of total
revenue, a little higher than in the cities (76%). By contrast, DBH transfers contributed an average of 17% in the cities, higher than in the kabupatens(only 11%).
The rate of growth of General Allocation Fund (DAU) transfers slowed in the last three years studied.
Beginning in 2009 the government ceased applying the ―hold harmless‖principle to DAU7transfers. The
result was quite significant declines in regional revenue from that source. On average, in the 24
kabupatens studied8, the nominal rate of increase of DAU transfers fell from 11% during 2007-08 to just ±2% in the following two years. In real terms the growth rate was negative: –8% in 2007-08 and –3% in 2009-10. The cities suffered an even more drastic reduction: down, in nominal terms, from 8% in 2007-08 to – 1% in 2009-10—which translated into real growth rates of –7% in 2009 and –4% in 2010.
Of the 42 kabupatens and cities studied, 13 experienced a decline in nominal value of DAU transfers during 2007-10. The city of Banjar was the only place to experience a significant decrease in DAU transfers in 2008 (30% (nominal), 35% (real)), even though the city government at that time was still
7The ―hold harmless‖ principle prevented the nominal DAU allocation fo
r a particular year being less than that of the previous year.
14
assuming that annual DAU allocations would keep rising. 2009 witnessed falling DAU transfers in 6 kabupatens and cities—leaving aside West Lombok that had just been formed. The most significant falls in 2009 were in West Sumbawa (nominal – 4%, real – 12%) and in the city of Palembang (nominal – 4%, real –13%). In 2010 the nominal value of DAU transfers fell in 10 kabupatens and cities, including Aceh Besar, Sleman and the city of Pekanbaru which had also experienced declines in the previous year. Three cities—Pekanbaru, Surabaya and Semarang—experienced the greatest declines, respectively 19%, 18% and 12% in real terms.
Graph No. 2.10: The Value of DAU Funding in 15 Kabupatens and Cities with Declining DAU Allocations during 2007-10, Based on Constant 2007 Prices
(This graph is available only in the Indonesian text of this publication)
Source: APBD-Rs for 2007-09 and APBD-Ms for 2010, processed by the LBS team.
All three of the provincial governments surveyed on Java received increased General Allocation Fund (DAU) transfers in the last two years under study (Graph 2.11). But in the first two years studied (2007-08)—when DAU transfers to the kabupatens and cities increased—DAU allocations fell as a proportion of provincial government revenue in West Java (by 3% nominal, 8% real) and East Java (6% nominal, 12% real). The corresponding number for the same period in Central Java was positive in nominal term but down by 6% in real terms. But in fiscal years 2009 and 2010 all three Java-based provincial
governments received increased DAU transfers in nominal terms, though the high rate of inflation meant that, in real terms, growth in 2009 was still – 2% in Central Java and West Java and 0% in East Java.
The two provinces outside Java each had a different experience with DAU transfers (Graph 2.11). In West Nusa Tenggara they grew steadily (in nominal terms) over the four years studied, albeit more slowly in 2009 and 2010. But in South Sumatera’s case DAU allocations grew by 7% (in nominal terms) in 2007-08 and 0% in 2009-2010. But, in real terms, both provinces experienced negative rates of growth in DAU allocations over the four year period as a whole.
Graph 2.11 Nominal and Real Growth of DAU Funding in 5 Provinces, 2007-10
(This graph is available only in the Indonesian text of this publication)
Source: APBD-Rs for 2007-09 and APBD-Ms for 2010, processed by the LBS team.
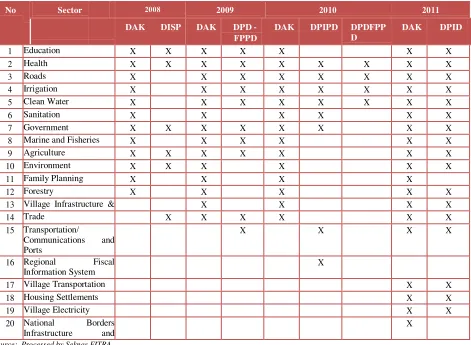
In contrast to the DAU, levels of Special Allocation Fund (DAK) transfers fluctuated wildly. The number of program areas targeted by the DAK grew from 12 in 2008 to 14 in 2009-10 and reached 19 in 2011 (Table 2.2). Growth in the value of DAK transfers to kabupatens and cities fluctuated wildly among regions (Graph 2.12). Thus, the difference between the highest and the lowest level of DAK transfers received by Sleman, Bojonegoro and the cities of Surabaya and Semarang during 2007-10 was greater than each area’s average annual DAK allocation over the 4 year studied. Furthermore, in North
Gorontalo and the city of Pekanbaru, the difference between the highest and lowest allocations received over the same period was twice as great as the average of those two figures.
Graph 2.12 Maximum, Minimum and Average Value of Special Allocation Fund (DAK) Transfers, 2007-10 Based on Constant 2007 Prices
(This graph is available only in the Indonesian text of this publication)
Source: APBD-Rs for 2007-09 and APBD-Ms for 2010, processed by the LBS team.
15
of Palembang and Semarang the DBH also furnished an average of 15% of total government revenue. It is noteworthy that these 7 regions are either large cities or areas endowed with natural resources. Outside those 7, the DBH’s contribution to revenue was relatively small. Unlike the DAU, DBH allocations did not vary greatly from year to year.
Graph 2.13 Maximum, Minimum and Average Proportion Contributed by DBH to Local Revenue 2007-10
(This graph is available only in the Indonesian text of this publication)
Source: APBD-Rs for 2007-09 and APBD-Ms for 2010, processed by the LBS team.
The provincial government of South Sumatera depended to quite an extent on funding from the Revenue Sharing Fund (DBH), whereas for the governments of West Java and East Java DBH contributed relatively little to local revenue. Although the amount contributed by DBH to South Sumatera’s provincial government coffers declined from 36% in 2007 to 26% in 2010, it remained an important and reliable revenue stream. It did, however, decline in monetary value in 2009. Meanwhile, in both West Java and East Java, DBH contributed just 13% and 11% respectively of total government revenue, even though the monetary value of the revenue each of these governments derived from DBH was virtually the same as South Sumatera’s. It is also noteworthy that, while DBH contributed an average of 8% of total provincial government revenue in both Central Java and West Nusa Tenggara (NTB) during 2007-10, the monetary value of revenue derived from DBH by Central Java was more than 5 that received by NTB.
2.5 Other lawful Own-source Revenue (LPDS)
Other lawful own-source revenue (LPDS) was an important income stream in some areas, especially cities. Graph 2.15shows amounts of LPDS received and the size of LPDS’s contribution to total local revenue in 10 kabupatens and cities during 2007-10. In seven cities—Surabaya, Semarang, Pekanbaru, Surakarta, Padang, Pontianak and Palangka Raya—LPDS tended to increase both in monetary value and as a percentage of total revenue, albeit at a lower level in some areas in 2010. This decline could have resulted from the fact that, for 2010, ABPD-Ms were the only budget documents available for this study. A different pattern was evident in three kabupatens. In North Aceh LPDS declined significantly in 2009 and again in 2010. In West Sumbawa there was an upward trend over the last 3 years studied, especially 2010. Yet another pattern was evident in North Gorontalo: there, LPDS represented 98% of local
income in 2007, but fell dramatically to just 14% in 2010.
Graph No. 2.15 Total LPDS as a Percentage of Total Government Income, 2007-10, Constant 2007 Prices
(This graph is available only in the Indonesian text of this publication)
Source: APBD-Rs for 2007-09 and APBD-Ms for 2010, processed by the LBS team.
In general, cities derived their other lawful own-source revenue (LPDS) from their shares of tax revenue collected by provincial or other local governments (a form of DBH at the sub-national level).
16
the 2009 earthquake. Such funding constituted almost half the city’s LPDS in 2010 which, in monetary terms, was 3.4 times greater than 2009’s LPDS.
LPDS revenue fluctuated significantly in West Sumbawa, North Aceh and North Gorontalo, both in geographic terms and from year to year. In West Sumbawa, the kabupaten’s share of tax revenue collected by provincial or other local governments was the biggest single contributor to LPDS in 2008-09; but it was less significant in both 2007 and 2010 when grants took over as the main source of LPDS. Indeed, in 2010, West Sumbawa budgeted for 2.6 times more LPDS revenue than it had spent in the preceding year, possibly counting on grants from a large mining company operating in its territory. In North Aceh adjustment and special autonomy funds contributed 90% of LPDS in 2007-08. But, in 2009, not only did LPDS decline to just 18% of what it was previously; its composition was also different. In 2009-10 shared revenue from taxes collected by the province or other local governments constituted a high proportion (around 60%) of North Aceh’s LPDS. In 2009 provincial/other local government fiscal support contributed 44% of North Aceh’s LPDS, while grants contributed 37% in 2010. In the case of North Gorontalo, during its first two years of existence as a province, provincial/other local government fiscal support and grants took it in turns to be the biggest single contributor to LPDS; but they were both overtaken in 2009-10 by adjustment and special autonomy funding.
Graph 2.16 Contribution of Various LPDS Components to LPDS Revenue in 10 Kabupatens/Cities, 2007-10
(This graph is available only in the Indonesian text of this publication)
Source: APBD-Rs for 2007-09 and APBD-Ms for 2010, processed by the LBS team
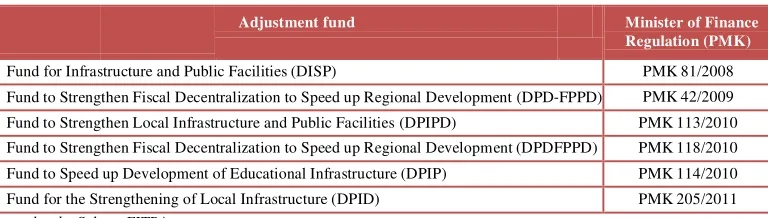
From the time it first appeared in 2008, infrastructure adjustment funding lacked criteria, did not require counterpart funding and was not well administered. It stood in contrast to other fiscal transfer mechanisms that had specific parameters and legal status under Law No. 33/2004 on Fiscal Balance
between the Center and Regions. For its part, adjustment funds—whose nomenclature changed constantly
(see Table 2.1)—were authorized by Minister for Finance regulation and allocated, in terms of amounts and recipient areas, by the House of Representatives (DPR). By 2010 adjustment funding had become more diversified and was marked by untimely distribution, often not being received until around the time of the mid-year budget revision process. This delay caused problems: for example, not one single local government included adjustment funding in its APBD-M for 2010. Indeed, even in 2009, most regions made no reference to adjustment funding in either their approved budgets (APBD-Ms) or their mid-year revised budgets Ps); but referred to it only in their end-of-year realized budget reports
(APBD-Rs).
Table 2.1 Various Types of Adjustment Funding and Their Legal Basis
Adjustment fund Minister of Finance Regulation (PMK)
Fund for Infrastructure and Public Facilities (DISP) PMK 81/2008 Fund to Strengthen Fiscal Decentralization to Speed up Regional Development (DPD‐FPPD) PMK 42/2009 Fund to Strengthen Local Infrastructure and Public Facilities (DPIPD) PMK 113/2010
Fund to Strengthen Fiscal Decentralization to Speed up Regional Development (DPDFPPD) PMK 118/2010
Fund to Speed up Development of Educational Infrastructure (DPIP) PMK 114/2010
Fund for the Strengthening of Local Infrastructure (DPID) PMK 205/2011 Source: Put together by Seknas FITRA
17
Not unnaturally, local governments preferred adjustment funds because they did not require local co-financing. But, because adjustment funds had no specific parameters, lacked selection criteria and took scant account of the national interest, local needs or fiscal equity, they risked being wrongly targeted.
Table 2.2 Sectoral Funding: Comparison Between the DAK and adjustment Funds, 2008-11
No Sector 2008 2009 2010 2011
Graph 2.17 DAK and infrastructure adjustment Funding by Kabupaten/City APBD-M 2010, Based on Current Prices
This graph is available only in the Indonesian text of this publication)
Source: APBD-Ms for 2010 and various Minister of Finance regulations concerning Adjustment Funds, processed by the LBS team.
In some areas, infrastructure adjustment funding in 2010 managed to exceed the value of DAK transfers, even though the basis on which it was distributed remains unclear. In 2010 Seven regions— Wajo, North Gorontalo and West Aceh, and the cities of Bandar Lampung, Palu, Palangka Raya and Padang Panjang—received more funding from adjustment transfers than from the DAK (Graph 2.17). In some cases—the cities of Gorontalo, Pontianak, Parepare and Pekanbaru—the amounts received via infrastructure adjustment funding were more than double those allocated to them by the DAK. Several kabupatens—Garut, Cilicap, Malang, Serdang Bedagai, Bondowoso and Boyolali—which had already received sizeable DAK transfers (more than Rp 55 billion at current prices) also received adjustment funding valued at between 20% and 65% of their DAK allocations. By contrast, several cities like
18
Local Own-Source Revenue (PAD)
Provincial government own-source revenue (PAD) derived mainly from taxation; in cities it derived mainly from local fees and charges; and in kabupatens it came increasingly from other lawful PAD9.
Tax receipts contributed around 85% of total provincial government PAD in the regions studied. West
Java’s provincial government had the highest level of tax-derived PAD—between 91% and 93% over the
four years studied; West Nusa Tenggara’s was somewhat less—between 72% and 84%. On average in 16 cities studied, fees and charges contributed more to PAD than taxation. But even so the amount tax revenue contributed to cities’ PAD (37-39%) was far more than for kabupatens (just 21%-24%). On average, by 2010, the amount of revenue derived from other lawful PAD in 26 kabupatens surveyed was slightly more than that derived from local fees and charges. During the period studied (2007-10)
taxation’s contribution to kabupatens’ PAD hovered between 21% and 24%.
Provincial and kabupaten governments (but less so in the cities) received increasing amounts of local own-source revenue (PAD) from other lawful PAD and from management of locally funded
government enterprises. Although these two revenue streams contributed a relatively small amount of overall provincial government PAD, their contribution grew over the 4 years studied: from just 8% of PAD in 2007 to 13% in 2010. The same sort of trend was evident in 26 kabupatens studied: their
contribution grew from 36% of PAD in 2007 to 44% three years later. By contrast, city government PAD from these two sources declined in 2007-08 and rose again slightly in 2009-10.
Graph 2.18 Growth Trends of Various Sources of PAD, 2007-10
(This graph is available only in the Indonesian text of this publication)
Only areas with urban characteristics were able to turn local taxes into a principal source of local own-source revenue (PAD). Almost all regions deriving more than 40% of PAD from taxation were cities or kabupatens with urban characteristics like Sleman. The kabupatens of West Lombok and Serdang Bedagai were exceptions here. The large number of hotels and restaurants in West Lombok’s Senggigi district meant that it was able to collect a relatively large amount of tax. In the case of Serdang Bedagai, taxation’s contribution to PAD was high only because total PAD itself was so low vis-à-vis other revenue sources—just Rp 17 billion or a mere 3% of total revenue for 2009. Furthermore, some small cities such as Gorontalo, Parepare, Blitar and Padang Panjang recorded very low levels of PAD from taxation (less than 20%).
The kabupatens of Pekalongan, Garut and the city of Banjar all had high levels of revenue from fees and charges, 80% of which derived from health services. The city of Banjar received fees and charges amounting to Rp 14-17 billion (constant 2007 prices) or 66%-74% of its PAD during 2007-10. During that same period, Pekalongan netted Rp 24-35 billion worth of fees and charges (constant 2007 prices) or 58%-70% of PAD. Something similar occurred during 2007-09 in Garut, where fees and charges topped Rp 64-69 billion or 81%-83% of PAD. But in 2010 (in its APBD-M) Garut made provision for free health services, resulting in a fall in revenue from fees and charges to just Rp 11 billion (at constant 2007 prices), or 13% of its PAD.
Other legal PAD (local own-source revenue) was a very significant source of PAD in North Aceh and West Sumbawa. In North Aceh, even though contributions by other legal PAD slid from Rp 85 billion (84% of total PAD) in 2007 to Rp 10 billion (33% of total PAD) in 2010 (based on APBD-M figures), it remained the kabupaten’s single biggest contributor to PAD. More than 60% of revenue in question was generated by bank transfer receipts and interest payments. That showed that most of North Aceh’s official funds were deposited with banks rather than being used to deliver public services and stimulate
9
19
the economy. This situation explains why, as is discussed in Chapter 4 of this report, North Aceh carried forward such large amounts of unspent funds (SiLPA) from one budget year to the next. Just the opposite occurred in West Sumbawa, where other lawful PAD increased during the four years under study: from Rp 5.5 billion (61% of PAD) in 2007 to Rp 22 billion (73% of PAD) in 2010 (based on APBD-M
figures). West Sumbawa derived more than 70% of its other lawful PAD from ―third party contributions‖.
Graph 2.19 Proportion Contributed to (Realized) PAD by Various Sources of PAD
(This graph is available only in the Indonesian text of this publication)
20
3.
Analysis of Local Expenditure
3.1
General Analysis of Expenditure
In general, the rate of growth of budgetary expenditure in the areas studied exceeded the rate of growth of revenue (see Graph 3.1). The only exceptions were the 5 provincial governments during fiscal years 2008 and 2009: then, on average, expenditure’s rate of growth fell slightly below that of revenue. As was the case with revenue, the rate of growth in expenditure declined significantly in real terms in 2008-09 in the 24 kabupaten10, 12 city and 5 provincial governments surveyed. Indeed, during that period, these regions’ growth rates became negative numbers—ranging from -0.3% to -2.6%; but they rose sharply in the following year11 especially in provincial governments (up 13%). Our analysis also shows that the rate of growth of expenditure was always higher in cities than in kabupatens.
Graph 3.1 Growth of Expenditure and Income 2007-10, Based on Constant 2007 Prices
(This graph is available only in the Indonesian text of this publication)
Of all the areas studied, the city of Surabaya had the highest rate of growth in expenditure during 2007-10. Indeed, the city’s spending (in constant 2007 prices) more than doubled from Rp 1.6 trillion in 2008 to Rp 3.6 trillion in 2010. While Surabaya spent less than its income in 2007 and 2008, its
expenditure significantly exceeded income in both 2009 and 2010. This high rate of growth in expenditure was accompanied by a decline in the proportion of the budget spent (both directly and indirectly) on the civil service: down from 48% of total city expenditure in 2007 to 32% in 2010; and a fall in expenditure on goods & services from 33% in 2007 to 23% in 2010. By contrast, the city increased it capital expenditure over the four year period: from 16% in 2007 to 36-37% in 2009-10.
At the provincial level, the government of West Java’s average level of expenditure grew at a faster rate than that of the other four provinces over the four years under study. In real terms, West Java’s expenditure grew at an average annual rate of 15% over the period. The opposite was happening on the revenue side of the ledger: in real terms West Java’s income declined from 2008 onwards. West Java’s increased expenditure was marked by a rise in spending (both direct and indirect) on civil service costs: up from 18% of total expenditure in 2007 to 20% in 2010. At the same time, expenditure on capital items and on goods & services also rose steadily from 21-22% in 2007-08 to 30% in 2010. The latter number (30%) was still lower than the average 2010 level of expenditure in those areas—between 30% and 42% of their entire APBDs—achieved by the other four provinces. Almost half of the government of
West Java’s expenditure consisted of transfers (revenue sharing and financial aid): far more than in the
other four provincial governments that spent only 25% of their budgets on transfers.
Government expenditure was a relatively significant contributor to growth of local kabupaten and city GDP, but not at the provincial government level. In the case of relatively small kabupatens and cities outside Java like Dompu and Polewali Mandar and the cities of Padang Panjang and Gorontalo,
government expenditure during the four years studied (2007-10) added an average of more than 20% to local GDP levels obtaining in 2007. Blitar was the only city on Java in which expenditure contributed significantly (almost 30%) to local GDP. In Central Lombok also, where population far exceeds that of the kabupatens and cities just referred to, government expenditure amounted to 20% of local GDP. These numbers underline the importance of government expenditure for regional economic growth. By
contrast, expenditure contributed minimally to local GDP of provincial governments studied: a mere 1% in Central Java, East Java and South Sumatera; and 3% in West Nusa Tenggara.
10
The kabupatens of North Gorontalo and West Lombok, formed after their parent kabupatens were split in two, are not included here.
21
Graph 3.2 Average Local Budget Expenditure (2007-10) as a Proportion of PRDB (2007), Based on Constant 2007 Prices
(This graph is available only in the Indonesian text of this publication)
Source: Budget Outcomes for 2007-09 and Proposals for 2010 APBDs, produced by the LBS team
3.2
Analysis of the Components of Expenditure
Expenditure on local civil services showed a consistently upward trend. Indeed, such a trend combined with decreased capital expenditure, mirrored what was happening at the national level12. In the 26 kabupatens studied, average indirect (routine, administrative) expenditure (BTL) on civil services was as high as 55% of total budget resources in 2010. The percentage was higher still (60%) when direct (development-related) civil service expenditure (BL) is factored in. In the 16 cities under study the same trend was evident, albeit at a slightly lower level, with BL and BTL on local civil services consuming 56% of budgetary resources in 2010. Average civil service expenditure in kabupatens and cities under study was higher than the national average (47% in 2009 (end-of-year outcomes) and 51% in 2010 (planning projections).
This high level of civil service expenditure had implications for spending on capital items and goods & services which impact directly on local economic growth. Average expenditure in these two areas declined significantly during the period studied: in the kabupatens from 39% of total budgets in 2007 to 28% in 2010; and in the cities, albeit from a slightly higher base, from 46% (2007) to 36% in 2010. These numbers were below the national average for similar expenditure by kabupatens and cities Indonesia-wide— 43% in 2009 (end-of-year outcomes) and 38% in 2010 (planning projections).
Graph 3.3 Proportional Break-down of Expenditure for Kabupatens, Cities and Provinces 2007-10
(This graph is available only in the Indonesian text of this publication)
The situation was a little different in provincial governments studied: increases in civil service
spending and declines in expenditure on capital items and on goods & services were not as great as in the kabupatens and cities surveyed. Average provincial government civil service expenditure (direct and indirect) rose from 24%-25% between 2007 and 2009 to 28% in 2010. That was slightly above the national average—24% in 2009 (end-of-year outcomes) and 28% in 2010 (projections). Overall, the five provinces studied spent slightly less on civil service costs because of large amounts—27%-33% of their budgets during 2007-10—expended on transfers in the form of shared revenue and financial aid. Nor did provincial government spending on capital items and on goods & services decline as much as in the kabupatens and cities: the five provinces studied spent 38% of budgetary resources on those items in 2007, but only 34% in 2010. These numbers fell well short of the national average—47% in 2009 (end-of-year outcomes) and 38% in 2010 (planning projections).
Graph 3.4 Proportion of DAU Funds Spent on Civil Service in 2007 and 2009
(This graph is available only in the Indonesian text of this publication)
On average, the 42 kabupatens and cities studied spent 95% of their General Allocation Fund (DAU) transfers in 2010 on civil service costs. In 2007 indirect (routine, administrative) expenditure (BTL) on civil services accounted for 65% of DAU funding received, but such expenditure increased markedly over the next three years: to 76% in 2008, 85% in 2009 and 95% in 2010. Indeed, the level of civil service expenditure in 10 of the kabupatens and cities surveyed not only trended upwards during the period 2007-10, but actually exceeded DAU allocation levels in 2010(Graph 3.4). Most of these regions were cities,
12
National average figures for 2009 quoted in this report are taken from Analisis Realisasi APBD 2009, while those for 2010 come from
Deskripsi dan Analasis APBD 2010. Both these documents are publications of the Directorate for the Local Government Funding and Financial
22
areas with urban characteristics like Sleman or resource-rich areas such as North Aceh. Boyolali was in a class of its own.
3.3
Direct Per Capita Expenditure
High levels of civil service expenditure led to a significant decline in the level of direct (development-related) expenditure (BL) per head of population. In the 26 kabupatens studied, average BL per person (based on constant 2007 prices) declined by 16% from around Rp 5.1 m/person in 2007 to Rp 4.3 m/person in 2010. A slightly better number, albeit on the decline as well, was evident in the 16 cities under study: Rp 8.1 m/person in 2007 down to Rp 7.5 m/person in 2010—a decline of 8%. As Graph 3.5 shows, only three kabupatens (West Sumbawa, Wajo and the newly established North Gorontalo) had an increase in BL per person. The other 23 kabupatens registered declines. Cities performed relatively better: six of them—Padang Panjang, Parepare, Surabaya, Pontianak, Padang and Semarang— managed to achieve an increase in BL per capita. Overall, inhabitants of kabupatens and cities on Java had less spent directly on them per person than people living in the regions surveyed outside Java.
Graph 3.5 Direct Per Capita Expenditure 2007 and 2010, Based on Constant 2007 Prices
(This graph is available only in the Indonesian text of this publication)
Source: APBD-Rs for 2007, APBD-Ms for 2010 and 2010 Population Census results, processed by the LBS team.
3.4
Expenditure on Social Aid and Grants
Expenditure by kabupatens and cities on social aid (bansos) showed a downward trend, whereas spending on grants (hibah) increased. Average expenditure on social aid (based on constant 2007 prices) in the 26 kabupatens and 16 cities studieddeclined by 31% and 47% respectively during 2007-10. As a proportion of total expenditure, kabupaten and city spending on social aid declined from 4% in 2007 to 2% in 2010. By contrast, expenditure on grants (hibah) rose dramatically. In 2007 kabupatens spent an average of just Rp 8 m (1% of average APBD spending) on grants, but by 2010 that amount had quadrupled to Rp 34 billion (5% of average APBD expenditure). But cities spent even more on grants: Rp 3 billion in 2007 and as much as 40 billion in 2010—a more than twelvefold increase. That amounted to 1% of their total budget spending in 2007 and 4% in 2010.
Graph 3.6 Average Growth of Expenditure on Social aid and Grants by the 26 Kabupatens and 12 Cities Studied, 2007-10 (Based on Constant 2007 Prices)
(This graph is available only in the Indonesian text of this publication)
In most of the 18 kabupatens and cities which held “pilkada”—elections for local heads of government (HOGs) —in 2008, expenditure on social aid fell markedly in 2009 and 2010. In the city of Pontianak, for example, budget allocations for social aid averaged Rp 33 billion in 2007 and 2008 (constant 2007 prices), but fell to just Rp 7 billion in both 2009 and 2010. Although not quite as dramatic, something similar happened in East Lombok, Bone and the cities of Padang Panjang and Parepare. Social aid expenditure in those four regions in 2009 hovered between 43% and 49% of levels attained in the election year (2008). That said, a number of kabupatens and cities—Garut, West Lombok, Bondowoso, North Gorontalo and the city of Banjar—continued to spend large amounts on social aid after their pilkada.
Graph 3.7 Allocations for Expenditure on Social aid (2007-10) in 18 Kabupatens and Cities Which Held Pilkada in 2008, Based on Constant 2007 Prices
(This graph is available only in the Indonesian text of this publication)
23
Although social aid expenditure did not increase in 17 local government areas holding pilkada in 2010, spending on grants did, and significantly (graph 3.8). Indeed, in some regions, spending on grants ballooned out in the year preceding 2010 pilkadas: Boyolali spent over 20 times more on grants in 2009 than it did in 2008; the city of Semarang’s 2009 spending on grants was 6 times higher than the 2008 number; and the city of Surabaya spent 4 times more on grants in 2009 than in 2008. This increased level of spending persisted into the election year (2010). But it has to be acknowledged that grant allocations were partly used to cover costs of conducting elections. Thus three kabupatens holding elections in 2010—Dompu, Kendal and Serdang Bedagai—allocated nine or ten times more funding for grants in 2010 than in 2009.
Graph 3.8 Allocations for Expenditure on Grants in 17 Kabupatens and Cities (2007-10) Which Held Pilkada in 2010, Based on Constant 2007 Prices
(This graph is available only in the Indonesian text of this publication)
Source: APBD-Rs for 2007, APBD-Ms for 2010 and 2010 Population Census results, processed by the LBS team.
24
4.
Analysis of Planning, Financing and Fiscal Space
4.1
Budget Planning and Revision Processes
In general, revenue planning processes in kabupatens and cities studied worked relatively well.
Overall, revenue targets were achieved as planned: realized income in end-of-year reports on budget outcomes (APBD-Rs) averaged between 104% and 105% of original budget (APBD-M) targets. The mid-year budget revision process producing revised budgets (APBD-Ps) also worked well, helping to bring more precision to revenue forecasts: APBD-R outcomes on revenue were between 99% and 101% of APBD-P targets. This situation came about mainly because regions could make fairly precise estimates of income to be derived from central government fiscal balance transfers (dana perimbangan). Indeed, APBD-R numbers on amounts of dana perimbangan received in the budget year just past were between 100% and 104% of APBD-M estimates and between 99% and 101% of APBD-P projections.
That said, projections of revenue from other lawful local own-source revenue (LPDS) were still poor, especially at the budget planning stage. Graph 4.1 shows that most areas were only able to set reasonably accurate targets for LPDS revenue during the mid-year budget revision process (APBD-Ps). But, despite that, end-of-year budget results (APBD-Rs) still recorded LPDS revenue numbers that were between 20% and 60% higher than APBD-P targets. As for the budget planning process, its underestimation of LPDS revenue grew worse over the period: in 2007 average APBD-R outcomes were
40% higher than APBD-M projections; by 2009 they were 90% higher than planning projections.
Graph 4.1 Actual LPDS Revenue in APBD-Rs Compared to Projected Revenue in APBD-Ms and APBD-Ps
(This graph is available only in the Indonesian text of this publication)
Source: APBD-Ms, APBD-Ps and APBD-Rs for 2007-09, processed by the LBS team.
Although realized budget numbers for local own-source revenue (PAD) were, on average, close to original budget projections, quite a few regions had difficulty accurately estimating PAD revenue. On average during the three budget years studied in this context, actual revenue (APBD-R) from PAD hovered between 107% and 109% of original budget projections (APBD-M). The mid-year budget revision process managed to bring estimated PAD revenue (in APBD-Ps) closer to budget outcomes (APBD-Rs), but budget year 2009 was an exception: in that year APBD-P targets were just 94% of APBD-R outcomes. In some regions end-of-year APBD-R outcomes bore little resemblance to original budgets estimates (in APBD-Ms), mostly because governments underestimated their capacity to collect PAD. Areas with poor PAD revenue planning processes ranged from Sleman, on one hand, which always underestimated its PAD revenue at less than 87% of what it achieved to Bone, on the other, which consistently overestimated its likely PAD revenue in both its APBD-Ms and APBD-Ps.
25
This tendency to underspend, made worse by the mid-year budget revision process, was particularly apparent in expenditure on goods & services. But it was also evident in civil service spending (graph 4.2). Actual expenditure by kabupatens on goods & services was almost identical with planned
expenditure: on average, end-of-year outcomes (in APBD-Rs) were between 97% and 100% of original budget targets (in APBD-M). But overambitious budget revision processes led many kabupatens to end up spending less than 90% of revised budget (APBD-P) targets. A similar pattern was evident in cities studied: on average, actual expenditure on goods & services was between 92% and 96% of original budget projections (in APBD-Ms); and only between 86% and 88% of mid-year revised targets (in APBD-Ps). Civil service spending was closer to what was targeted: on average, in 2007, 92% of revised expenditure targets were spent; by 2009 the proportion had risen to 95%. The fact remains, however, that if local governments had not revised their budgets mid-year, their end-of-year expenditure numbers would have been much better.
Graph 4.2 Actual Expenditure on Goods & services Compared to Projected Expenditure in APBD-Ms and APBD-Ps
(This graph is available only in the Indonesian text of this publication)
Source: APBD-Ms, APBD-Ps and APBD-Rs for 2007-09, processed by the LBS team.
Like expenditure on goods & services, expenditure on capital items was adversely affected by budget revision processes (graph 4.3). Actual capital expenditure by kabupatens and cities studied was, on average, more than 90% of original budget projections (in APBD-Ms) throughout the three years studied (2007-09). Kabupatens performed slightly better than cities, though their spending also trended
downwards. More ambitious expenditure targets incorporated into mid-year revised budgets (APBD-Ps) impacted more severely on capital expenditure than on goods & services: on average, actual expenditure on capital items between 2007 and 2009 in the cities surveyed did not once rise above 85% of mid-year revised targets (in APBD-Ps). Kabupaten spending was slightly higher: on average their actual
expenditure (in APBD-Rs) rose from 85% of mid-year revised targets (in APBD-Ps) in 2007 to 91% in 2009.
Graph 4.3 Actual Expenditure on Capital Items Compared to Projected Expenditure in APBD-Ms and APBD-Ps
(This graph is available only in the Indonesian text of this publication)
Source: APBD-Ms, APBD-Ps and APBD-Rs for 2007-09, processed by the LBS team.
4.2
Budget Surpluses
Planning figures suggest that budget surpluses resulted more from under expenditure than from unexpected “success” on the revenue side (graph 4.4). On average, budget income recorded in end-of-year reports (APBD-Rs) showed that the kabupatens and cities studied achieved between 104% and 105% of original revenue targets (in APBD-Ms) and between 99% and 101% of revised targets in mid-year APBD-Ps. This amounts to clear evidence of underestimating budget income. By comparison, increasingly higher levels of spending were incorporated in both original budgets (APBD-Ms) and revised budgets (ABPD-P) over the period studied: on average, realized kabupaten/city budget
expenditure in 2007 represented 95% of APBD-M spending targets, but only 88% of mid-year revised budget (APBD-P) targets; corresponding numbers for 2009 were 98% and 92%. This data shows that kabupatens and cities tended to set themselves excessively high spending targets, particularly in mid-year revised budgets. Given that shortfalls in realized expenditure were greater than the amounts by which revenue was underestimated, it seems that budget surpluses resulted mainly from under expenditure.
Graph 4.4 Comparison of Budget Outcomes (APBD-R) with Draft (APBD-M) and Revised (APBD-P) Budget Targets and Resulting Budget Surpluses (SiLPA), 2007-09
26
Source: APBD-Ms, APBD-Ps and APBD-Rs for 2007-09, processed by the LBS team.
The extent to which budget surpluses (termed SiLPA in Indonesian) were used to fund the next year’s budgets trended downwards during the period under study. On average, in 2008, the 42 kabupaten and cities under study used SiLPA carried forward from 2007 to finance 14% of budget expenditure. That was a significant contribution: after all, local own-source revenue (PAD) funded only 10% of spending that year (2008). However, the amount of SiLPA declined steadily after 2008, contributing just 6% of budget financing in 2010, by which time PAD’s contribution had risen to 11%.
Of the 42 kabupatens and cities studied, North Aceh and Wajo kabupatens and the cities of Surabaya, Padang Panjang and Semarang used more SiLPA than other areas to fund their budgets. Of these five regions North Aceh had the most substantial surpluses: indeed, in 2007 SiLPA carried forward from 2006 was greater than the entire 2007 budget; in 2008 SiLPA declined somewhat but was still able to finance 91% of North Aceh’s budget. This situation came about from a combination of factors: on one hand, high levels of revenue in 2007 (almost 150% more than originally budgeted for) and, on the other, low levels of expenditure (just 75% of original APBD-M projections and 62% of revised APBD-P targets). Among the three cities mentioned above, Surabaya had the highest proportion of its budgets funded by SiLPA over the period studied: the high point was in 2008, when 64% of the city’s budget was funded by SiLPA from 2007. Like North Aceh, Surabaya’s large budget surpluses resulted from under-estimates on the revenue side—actual revenue was 10% above both original APBD-M projections and revised APBD-P targets—and lower than expected expenditure—just 77% of original APBD-M
projections and 62% of revised APBD-P targets. That said, the extent to which North Aceh, Surabaya and other regions financed their budgets with SiLPA trended downwards through to 2010.
Graph 4.5 Average Contribution of SiLPA from Previous Year to Financing of Expenditure by Kabupatens and Cities 2007-09
(This graph is available only in the Indonesian text of this publication)
Source: APBD-Ms, APBD-Ps and APBD-Rs for 2007-09, processed by the LBS team.
Among the 42 regions studied, the kabupatens of Sidenreng Rappang, Polewali Mandar and East Lombok and the cities of Palu and Gorontalo used SiLPA least to finance budget expenditure. Each of these five regions—with the sole exception of Gorontalo in 2008—consistently financed less than 5% of their budgets with SiLPA. Polewali Mandar and East Lombok achieved this outcome with good
budgetary planning: between 2007-09 the former collected 97%-101% of revenue targets—in both APBD-Ms and APBD-Ps—and spent 94%-101% of both its original and revised expenditure targets; the corresponding numbers for East Lombok were 97%-101% (revenue collected) and 95%-96%
(expenditure achieved). By contrast, the low level of SiLPA in Sidenreng Rappang did not result from effective budgeting but rather from failure to achieve both revenue and expenditure targets: during 2007-09 the kabupaten collected only between 83% and 97% of projected revenue (at times when other kabupatens and cities were exceeding targets) and only expended between 83% and 88% of targeted expenditure.