CONTACT ANGLE MEASUREMENT OF DENTAL RESTORATIVE
MATERIALS BY DROP PROFILE IMAGE ANALYSIS
H. D. K. Yulianto
dan
M. Rinastiti
Faculty of DentistryUniversitasGadjahMadaEmail: dedykusuma@ugm. ac. id
ABSTRAK
Kemampuan adhesi mikroba awal untuk gigi restorative komposit permukaan dipengaruhi oleh keterbasahan permukaan bahan. Metode yang umum untuk mengevaluasi keterbasahan permukaan bahan adalah pengukuran sudut kontak. Metode konvensional yang ada untuk mengukur sudut kontak dilakukan dengan cara sudut kontak (CA) perangkat-Goniometer yang kurang praktis diterapkan dalam situasi klinis. Oleh karena itu, metode yang lebih praktis dan dapat diterapkan diperlukan untuk mengukur sudut kontak dalam keadaan klinis. Untuk membandingkan antara sudut kontak diukur dengan cara CA-goniometer perangkat
dan baru praktis metode analisis penurunan proil gambar. Selain karena ada dua formula yang berbeda yang dapat digunakan untuk menghitung nilai sudut kontak dari gambar proil drop, maka kita juga perlu
mengevaluasi formula yang lebih handal untuk digunakan. Pengujian dilakukan dengan menggunakan tiga
cakram komposit (Clearill-Kuraray Medis, Inc. ) sample dan air deionisasi untuk prosedur pengukuran yang berbeda. Cairan satu tetes 3μl dijatuhkan pada permukaan cakram komposit dan gambar proil penurunan
ditangkap dengan cara disesuaikan perangkat buatan terhubung dengan kamera digital. Dua formula yang
berbeda yang digunakan untuk menghitung nilai kontak sudut dari gambar proil drop, bernama “linier
persamaan gradien” dan “garis tangensial”. Nilai sudut kontak yang diperoleh dari dua formula yang berbeda dibandingkan dengan nilai yang diperoleh dari metode konvensional secara deskriptif. Persentase perbedaan antara nilai sudut kontak dihitung dengan rumus kedua (“persamaan linier gradien” dan “garis tangensial”) dan yang dihitung dengan cara CA-goniometer adalah masing-masing 20,56% dan 3,51%. Hal ini jelas menunjukkan bahwa nilai yang diperoleh oleh “garis tangensial” formula memiliki perbedaan persentase yang lebih kecil dibandingkan dengan yang diperoleh “linier persamaan gradien” formula. Di antara dua formula yang berbeda, itu menegaskan bahwa nilai sudut kontak dihitung dengan “garis tangensial” formula
memiliki kesamaan lebih dekat dengan nilai yang diperoleh dari CA-goniometer. Hasil ini mengkonirmasikan bahwa baru praktis metode analisis citra proil drop menjanjikan untuk digunakan dalam mengukur nilai sudut kontak dalam keadaan klinis. Terkait dengan analisis citra proil drop, “garis tangensial” formula lebih
akurat dibandingkan dengan “persamaan gradient linier” formula.
Kata Kunci: Sudut kontak, Adhesi Mikroba, Bahan restorasi gigi.
ABSTRACT
The capability of initial microbial adhesion to dental restorative composites surface is inluenced by surface
practicaland applicable method is neededto measure the contact angle in clinical circumstances. To compare between the contact angle measured by means of CA-Goniometer device and new practically method
by drop proile image analysis. In addition due to
there were two different formulas that can be used to
calculate the contact angle value from the drop proile
image, then we also need to evaluate the formula which is more reliable to be used. Tests were carried
out using three composite discs (Clearill-Kuraray
Medical, Inc. ) sample and deionised water for different measurement procedures. One drop 3µl liquid wasdropped on the surface of the composite discs
and the drop proile imagewascaptured by means of
customized home-made device connected with digital camera. Two different formulas were used to calculate
the contact angle value from the drop proile image,
named “linier gradient equation” and “tangential line”. The contact angle values obtained from two different formulas were compared with the value obtained fromthe conventional method descriptively. The difference percentage between the contact angle value calculated by the both formula (“linier gradient equation” and “tangential line”) and those calculated by means of the CA-Goniometer is 20,56% and 3,51% respectively. It is obviously demonstrated that the value obtained by the “tangential line” formula has a smaller difference percentage compared with those obtained by the “linier equation gradient” formula.
Among two different formulas, it is conirmed that the
contact angle value calculated with “tangential line” formula has closer similarity with the value obtained from the CA-Goniometer.
Keywords: Contact angle, Microbial adhesion, Dentalrestorative materials.
INTRODUCTION
Dental caries is a major cause of tooth de-cay for most of Indonesia’s population. The main cause of dental caries is the attachment of bacteria that form bioilms on the surface of hard and soft tissues in the oral cavity (Khal-ichi et al. , 2004). Currently, the composite resin is still the main option for repair dental hard tissue damage due to the process of caries. The composites not only brought a change in materials and techniques but also a change in treatment philosophy called minimal invasive dentistry (Roeters et al. , 2004; Murdoch et al. , 2003; Tyas et al. , 2000). Composites allow the
possibility of preserving sound tooth structure during cavity preparation (Leinfelder, 1997). Composites resins have the ability to bind to the dental hard tissues through the adhesive material (Imazato, 2003). Furthermore, com-posite resin represents a signiicant aesthetic treatment option, enabling the fabrication of restorations with a natural appearance (Gor-dan, 2003). Although marked improvements have been noted in terms of physical and me-chanical properties during the last 10-20 years, several factors in dynamic oral environment can degrade the composite matrix via three principal modes, i. e. : mechanical degradation, physical degradation and chemical degrada-tion (Oilo, 1992; Winkler, 1991). Dynamically changes of oral environment are inluenced by food components, beverages, temperature changes, chewing, saliva and bacterial activity. Those factors have an important role in the deg-radation of compositesthat clinically resulted in failure, such as: discoloration, wear, ditching at the margins, delamination or simply fracture which may result in secondary dental caries (Roulet, 1988: 101-113; Swift, 1987: 584-588).
The intraoral bioilm that forms natu-rally on dental restorative materials is dental plaque, a diverse community of bacteria em-bedded in an organic matrix. Plaque develop-ment involves the formation of pellicle, early microbial colonization, and maturation lead-ing to a dynamic equilibrium. Major shift in equilibrium leads to disease of hard and soft tissue. The bioilm adsorption on surface de-pends on the biologic low rate, type of inter-facial interaction involved, and attachment strength with the substrate. It has been found that microbial binding strength is lower on hydrophobic surfaces than hydrophilic ones. Polar or non-polar nature, the hydrogen-bonding capacity, and the electron donor or acceptor potential seems to control the hydro-philic or hydrophobic character and energetic state of the surfaces (Eliades et al, 2003).
but also on biomaterials used for restoration of function or aesthetics (Bouschlicher, 1997: 279-283). Exposure to saliva and bioilm lead to degradation of composite surfaces that may have increased roughness, sometimes accompanied by decreased microhardness and increased exposure of iller particles or matrix swelling (Göpferich, 1996: 103-114; Soderholm, 1981: 1867-1875).
Presence of salivary protein albumin on dental surface inhibits interaction adhe-sion of bacterial mediated by hydrophobic interaction (Steinberg, 1981). Adhesion and maturation of numerous species of cariogen-ic bacteria will promote maturation of bio-ilm. These bioilm will easily trapped on the groove of rough surface that is resulted from degradation process by salivary enzyme like cholinesterase (CE) thereby promoting mat-uration (Finer et al. , 2004: 22-26). Adhesion of microorganisms to dental resin composite surfaces and the problems that were caused are a matter of concern to the patient and dentist. Bioilms have the potential to act as a chronic source of microbial contamination which may compromise restoration quality and represent a signiicant health hazard.
Initial microbial adhesion involves non-spesiic forces that transfer microorganisms close to the substrate to establish spesiic bond-ing. Coaggregation, coadhesion, release of bio-surfactans, production of extracellular matrix polymers, and various competitive reactions are considered important factors for the formation and rapid growth of plaque. The plaque-reten-tion capacity has long been recognized as a ma-jor inluencing oral health (Eliades et al. ,2003).
The capability of initial microbial adhe-sion to the composites surface is inluenced by surface wettability of materials. The con-tact angle of liquid drop on the substrate sur-face measured by means of CA-Goniometer represents valuable parameter in the wet-tability properties of the materials. An im-portant requirement that must be fulilled is placing the sample in perfectly horizontal position before dropping the liquid. In such
case, where the position of the sample can’t be placed as recommended requirement, this method faces some dificulty. For example, in clinical circumstances the material to be tested could be in varying position.
In this research, new method developed by using drop proile image analysis was pro-posed. The drop proile image can be captured from the sample placed in any varying posi-tion. Indeed, the lexibility of sample positionis an important parameter if the measurement will be applied in clinical circumstances. From practical point of view, this new method is suitable to be applied. However, the reliability and validity of the contact angle value result-ed from this new method neresult-ed to be evaluatresult-ed by comparing it with the result obtained from the existing conventional method. Therefore, the aim of this research is to compare the con-tact angle value measured by means of CA-Goniometer device with the value measured by thedrop proile image analysis. There were two different formulas were used to calculate the contact angle values from the image of the drop proile, named “linier gradient equa-tion” and “tangential line”. So that it is also important to evaluate which one among two different formulas is more reliable.
In order to produce the composite discs, the supericial layer of the mould was covered with 100 µm thick translucent mylar strip and pressed to create a smooth surface and to prevent the formation of an oxygen inhibiting layer. The material cured either chemically or by means of a halogen photo-polymerization unit, according to the manufacturer’s instructions.
Acquiring the Drop Proile Image
Sessile drop technique was performed by deposited one drop of 3µl de-ionized wa-teron surface of the composite disc. The drop proile (interaction between liquid-substrate surfaces) image was captured by means of customized home-made device connected with digital camera as shown in Figure 1.
Figure 1.
Schematic Diagram of the Contact Angle Measurement Process
The drop proile images were edited and optimized with image-analysis software before the contact anglewas calculated in or-der to improve the precision and accuracy of the results. The contact angle was calculated with two different formulas: the “linier gradi-ent equation” formula and and the “tangen-tial line” formula. The contact angles values were compared with the value obtained from the CA-Goniometer descriptively.
Procedures of Measurement
Three different procedures were used to calculate the contact angle values. One proce-dure is conventional methods by means of CA-Goniometer and the two procedures related
with the implementation of the drop proile im-age analysis by means of two different formulas.
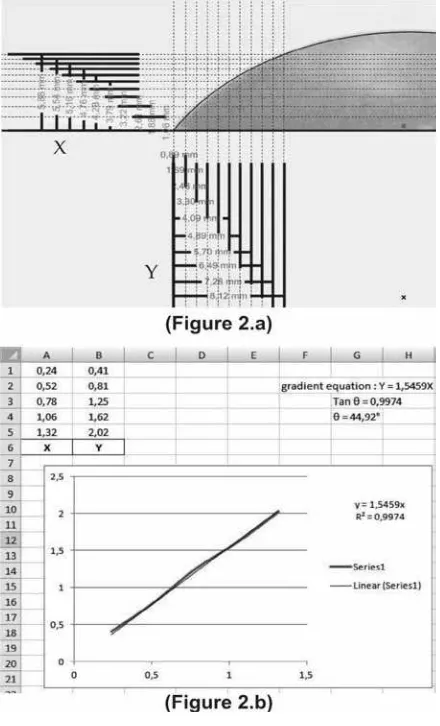
First
, Drop proile image analysis using
the “linier gradient equation”formulaThe
value of contact angle was calculated
byus-ing the “linier gradient equation” formula:
Y= mX. The ‘X’ and ‘Y’ coordinate axis were
drawn on the image of the drop proile, and
then the each value of ‘X’ and ‘Y’ coordinate
were transferred to scatter chart as shown in
Figure 2. a. Linier equation and R-squared
(R
2) value on chartwas displayed
automati-cally after ‘X’ ‘Y’ chart was inserted. The
val-ue of contact angle (θ) was calculatedusing
the formula Tan θ = R
2(
Figure 2. b
)
.
Figure 2. a. Figure 2. b.
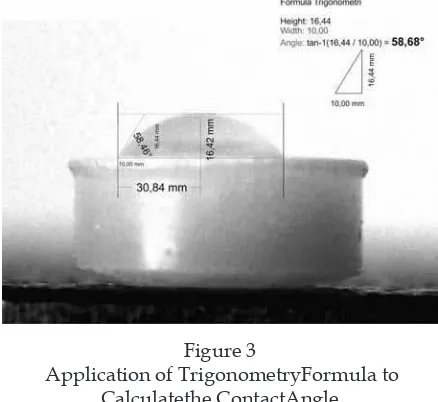
Second
, Drop proile image analysis
using the “tangential line” formula. The
drop proile image acquired was
opti-mized before calculating the contact angle
value. The next step was drawing the edge
of interface between liquid drop and
sub-strate surface on the image of the drop
proile. By measuring the height (h) and
wide (l) of liquid drop proile on the
sub-strate surface, the value of contact angle
was calculated using formula:
as shown in Figure 3.
Figure 3
Application of TrigonometryFormula to Calculatethe ContactAngle
Third, The conventional method (by means of the CA-Goniometer device)
The process of measurement was started by deposited one drop of 3µl liquid (de-ion-ized water) on the surface of the composite disc. The sample was placed in perfectly hor-izontal position and the liquid was dropped perpendicular to the substrate surface. The device automatically calculated the contact angle based on the analysis of height, width, and volume of the liquid drop on substrate surface.
The contact angle measurements have been performed using the new drop proile image analysis. The results are summarized in the Table 1.
Table 1
Contact AngleI Obtained by DropProileImage Analysis using the“linier gradient equation” and the
“tangential line” Formula
Method Contact angle The “linier gradient
equation” formula The “tangential line” formula
44,92°
58,68°
There were different of the contact val-ue obtained from two different formulas as shown in Table 1. In order to evaluate the accuracy and precision among two different formulas, these results need to be compared with the value obtained from conventional method by means of CA-Goniometer.
Measurement process by means of CA-Goniometer has been performed according to the procedure which has already previ-ously described. The obtained contact angle measured using CA-Goniometer device was 56,62° as presented in Figure 4.
Figure 4
The ContactAngleValueResulted by Means of CA-Goniometer Device
As shown in Figure 4, the contact angle can be precisely obtained because the contact angle value was calculated based on the au-tomated-analysis of height, width, and vol-ume of the liquid on substrate surface.
tan θ 2 = l
The contact angle values measured us-ing three different procedures was compared in table 2. The emphasis was focused to
eval-uate the different percentage between the contact angle values calculated by the two different formulas with the value obtained by means of CA-Goniometer.
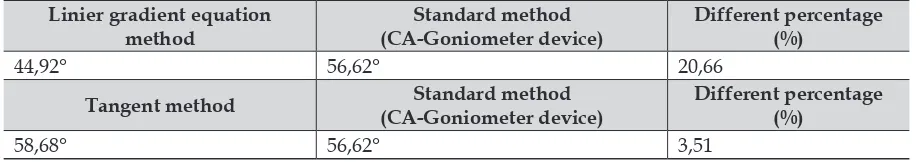
Table 2.
Comparison between ContactAngleMeasured by the LinierGradientEquationMethod theTangentMethod and the StandardMethod using CA-GoniometerDevice Linier gradient equation
From the Table 2, it is observed that the difference percentage between the contact angle value calculated by the both formulas: “linier gradient equation” and “tangential line” and those calculated by means of CA-Goniometer is 20,56% and 3,51% respectively. It is obviously demonstrated that the value obtained by the “tangential line” formula has a smaller difference percentage compared with those obtained by the “linier equation gradient” formula. Among two different for-mulas, it is conirmed that the “tangential line” formula has closer similarity with the value obtained from CA-Goniometer.
DISCUSSION
Water contact angle illustrate the shape of the liquid drop proilein contact with a surface of solid. Experimental tests were per-formed in order to evaluate the reliability of the new developed method based on the drop proile image analysis. In addition, the accuracy of the two different formulas which were used to calculate the contact angle values from the drop proile image was ob-served. As a reference the contact angle value obtained from the conventional method by means of CA-Goniometer was used.
The resultsas presented in the table 2 shows that the contact angle value calculated with the “tangential line” formula has the dif-ferent percentage less than 5% (3,51%) with the value obtained from the CA-Goniometer. This work conirms experimentally the
pos-sibility to measure thewettability of dental restorative composit surface by means of this new developed method.
The contact angle value is an important parameter to predict the wettability ties of the materials. The wettability proper-ties of the surface are an important parameter to predict the capability of microbial adsorp-tion and colonizaadsorp-tion on the composite sur-face in biologic environment (Katsikogianni, 2004). It has been found from several studies that surface free energy of the surface inlu-ence plaque accumulation (Eliades, 2003). Same amount of protein was adsorbed on high (hydrophobic) and low (hydrophilic) energy surface during the pellicle formation. However, pellicle on low-energy surface (hydrophobic) was thicker and more loosely bound. Moreover, the surface area of plaque accumulation is less on low-energy phobic) surface than on high-energy (hydro-philic) surfaces (Katsikogianni, 2004).
drop-let quickly dissipates, disappearing into the surfaces.
In this experiment we foundthat the drop proile image analysis using the “tangential line” formula has higher accuracy and more reliable compared with thedrop proile image analysis using the “linier gradient equation” formula. The accuracy of this formula allowed us to afirm that the procedure measurement of the drop proile image analysis using the “tangential line” formula was correct, reliable and sensitive. Therefore, it is likely that the drop proile image analysis using the “tangen-tial line” formula can be used as an alternative way in measuring the contact angle, Moreo-ver, from practical point of view it seems that the drop proile image analysis is more techni-cally practice and have lexibility to be imple-mented in any clinical circumstances.
CONCLUSION
This result is conirming that the new practically method by drop proile image analysis is promising to be used in measuring contact angle value in clinical circumstances. Related with the drop proile image analysis, the “tangential line” formula is more accu-rate compared with the “linier gradient equa-tion” formula.
BIBLIOGRAPhY
Khalichi, P. , Cvitkovitcha, D. G. , Santerre, J. P. , Effect of composite resin biodegradation products on oral streptococcal growth, Biomaterials 2004; 25: 5467–5472.
Roeters FJM, Opdam NJM, Loomans BAC. The amalgam-free dental school. J Dent 2004;32:371-377.
Murdoch-Kinch MA, McLean ME. Minimally invasive dentistry. J Am Dent Assoc 2003;134:87-95.
Tyas MJ, Anusavice KJ, Frencken JE, Mount GJ. Minimal intervention dentistry - a review - FDI Commission Project 1-97. Int Dent J 2000;50:1-12.
Leinfelder K. A conservative approach to placing posterior composite resin restorations. J Am Dent Assoc 1997;127:743-748.
Imazato, S. , Antibacterial properties of resin composites and dentin bonding systems, Dental Materials , 2003; 19: 449-457.
Gordan V, Mjør I, Blum I, Wilson N. Teaching students the repair of resin-based composite restorations: a survey of North American dental schools. J Am Dent Assoc 2003;134:317-323.
Ferracane, J. L. , Elution of leachable components from composite. J Oral Rehabil, 2003; 21:441-452.
Mair, L. , Stolarski, T. , Vowlest, R. , Lloyd, C. , Wear: mechanisms, manifestations and measurement. Report of a workshop. J Dent2003; 24:141-148. Oilo, G. , Biodegradation of dental
composites/glass-ionomer cements. Adv Dent Res 1992; 6:50-54.
Winkler, M. , Greener, E. , Lautenschlager, E. , No-linear in vitro wear of posterior composites with time. Dent Mater 1991; 7:258-262.
Akova, T. , Ozkomur, A. , Uysal, H. , Effect of food-simulating liquids on the mechanical properties of provisional restorative materials. J Dent 2006; 22:1130-1134.
Roulet, J. F. , The problems associated with substituting composite resins for amalgam: a status report on posterior composites. J Dent 1988; 16:101-113. Swift, E. J. , Wear of composite resins in
permanent posterior teeth. J Am Dent Assoc1987; 115:584-588.
Fúcio, Z. , Carvalho, F. G. , Sobrinho, L. C. , Sinhoreti, M. , Puppin-Rontani, R. M. , The inluence of 30-day-old Streptococcus mutans bioilm on the surface of esthetic restorative materials--An in vitro study. J Dent2008; 36:833-839.
Göpferich, A. , Mechanisms of polymer degradation and erosion. Biomaterials 1996; 17:103-114.
Soderholm, K. J. , Degradation of glass iller in experimental composites. J Dent Res 1981;60:1867-1875.
Steinberg, D. , Eyal, S. ,Early formation of Streptococcus sobrinus bioilm on various dental restorative materials. Journal of Dentistry2002; 30 47-51.
Finer, Y. , Santerre, J. P. , Salivary esterase activity and its association with the biodegradation of dental composite, J Dent Res 2004; 83(1):: 22-26.
Eliades, G. , Eliade, T. , Brantley, W. A. , Watts, D. C. , Dental Materials In Vivo Aging and Related Phenomena, Quintessence Publishing Co, Inc. , 2003.