THE DIMENSIONING OF THE FRUIT-GROWING
PATRIMONY IN ROMANIA
by
Mihaela Jaradat, Florin Urs Sabina Funar
Abstract. In this paper, we present the dimensioning of the fruit-growing patrimony in Romania performed with the help of polynomial equations of superior order.
Introduction
Romania is one of the European countries in witch fruit growing is well represented by the culture of a diversity of species and varieties that find favourable climatic conditions for growth and fructification, assuring fruit consumption spread out along the whole year.
The millenary tradition of fruit-tree cultivation as well as its extension on larger areas made fruit growing one of the fundamental branch of agriculture, with a well-defined infrastructure acknowledged both on home and foreign markets.
We should understand fruit-growing patrimony as: “Not only the number of fruit-trees and the area covered by them, but also the ecological background, i.e. favourableness of the climatic conditions and the production capacity of the soil under plantations (the determining factors of the fruit-tree production potential)1.
Sources and methods
This paper used as a source the statistical data found in The Romanian Annual (the part concerning the socio-economic conditions of Romania in various periods), offered by the National Institute of Statistics. Another source used in this paper is National Commission of Statistic and the Ministry of
1
Agriculture, Food and Forest- department of operational data The periods cover seventy-two years segmented at every eleven, twelve years, following four consecutive decades and concluding with two intervals of seven, respectively two years, as follows: the dimensioning of fruit-tree patrimony was performed with the help of polynomial equations of superior order, in most of the cases the six order equations. The used research methods were a series of numerical characteristics (predefined in mathematics), namely the mathematical mean or the mathematical hope, the linear mean deviation, the root-mean-square deviation, the Pearson coefficient of variation, interval of confidence, the Kurtozis coefficient, asymmetry (the Fisher coefficient).
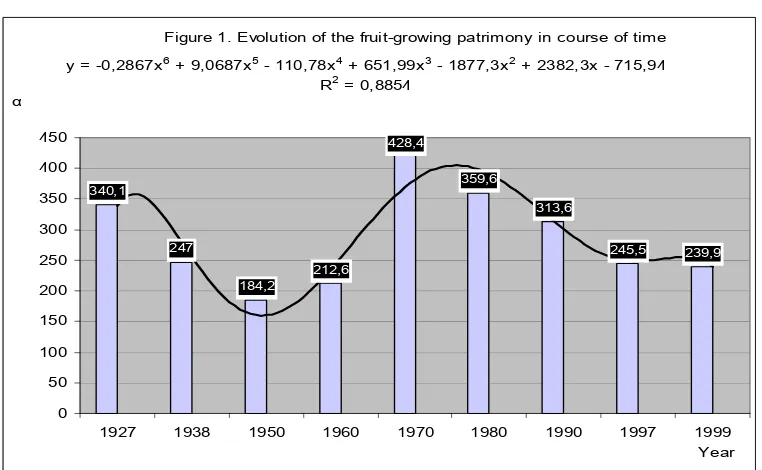
The evolution of the fruit-growing patrimony during the mentioned period was mathematically modelled with the help of the polynomial function
94
whose graphic presentation can be seen in Figure 1.
Results and debates
The evolution of the Romanian fruit-growing patrimony in the course of time is presented in Table 1 and Figure 1, and the mathematical results obtained from the numerical characteristics are presented in Table 2.
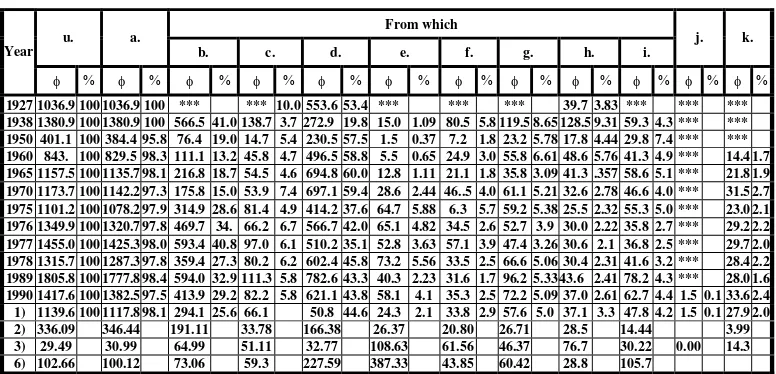
Table 1 The Romanian fruit-growing patrimony.
Year 1927 1938 1950 1960 1970 1980 1990 1997 1999 Area 340.1 247.0 184.2 212.6 428.4 359.6 313.6 245.5 239.9
(thousands ha)
Table 2 The mathematical results obtained from the numerical characteristics.
Mean (The mathematical hope) 285.66
Linear mean deviation (ha) 66.46
Root-mean-square deviation (ha) 79.39
The Pearson coefficient of variation 27.79
Estimation of the mean area of fruit-growing patrimony during 1927-1999 in terms of the interval of confidence, with an error probability of 5% (ha)
51.87
The Kurtozis coefficient -0.54
The statistical data show that the area covered with fruit trees varied in the course of time, decreasing from 340,100 ha in 1927 to 184,000 ha in 1950, after which, as a result of a massive planting campaign, it increased to 428,400 ha in 1970. After that it decreased to approximately 240,000 ha in 1999.
In the nine years recorded by the last two periods, the fruit-growing patrimony mean area is of 286.66 thousand ha, being almost at the limit of unrepresentative ness as it results from the calculation of the Pearson coefficient of variation which is 27.79%.
That shows the important variations of the total area covered which fruit trees between 1927 and 1999. The negative value of the Kurtozis coefficient (-0.54; table 2) consolidates our view concerning the unrepresentative ness of the mean value for the sample, implicitly for the whole period.
In order to find out the limits in which the annual average area of the fruit-growing patrimony was situated, we made an estimation in terms of the interval of confidence specifying an error probability of 5% (warrant probability of 95%). The results for the period of last fifty years, within the studied period, was an interval ranging between 233.79 and 337.53 thousand ha. The fact that the lower limit of range is very close to existing area suggests on one hand that the selected sample (the nine years) is representative, and on the other hand it indicates that the fruit-growing patrimony became stable on an area of about 240 thousand ha, during the last years.
Nevertheless, it cannot be statistically proved that in period between 1927 and 1999 the series of data dominant (modal value) approximates the value of 240 thousand ha. The Fisher asymmetry coefficient of 0.59 (table 2) suggests a positive asymmetry ranging from a slight to a well-marked one. Thus the modal value can be calculated according to the formula suggested by K. Pearson:
ha thousand V
M
M0=3 e −2 m =170
23
In conclusion, it is difficult for us to confirm that area of 240 thousand ha is dominant in the period of 1927-1999.
The complex reality, the multitude of situations that occurred during the last fifty years determined the evolution of the fruit-growing patrimony as it is
2
Merce E., Urs Fl., Merce C., Statistica, Editura AcademicPress , Cluj-Napoca, 2001, p.75. 3
presented in Figure 1. In order to establish the tendency line we resorted to the family of superior degree polynomial equation. The polynomial function of six orders is a valid instrument in pointing out the tendency of the fruit-growing patrimony in the specified period, having the value of R2=0.8854 4 (Figure 1)
The evolution of the in bearing orchards in Romania is another aspect that we bring into discussion.
The proportion of the fruit-tree plantations (in bearing orchards) within the agricultural area of the country decreased continuously, from 1.61 % in 1989 to 1.32 % in 2000 (Table 3). In bearing orchards represented an average of 79.46% of the total fruit-growing patrimony in the period 1989-2000 (Table 4 and Figure 2). In bearing orchards showed a constant decreasing tendency with a short variation from the average (Table 4 and Figure3), the Pearson coefficient of variation of 5.53% regarding the areas (Table 4) and of 3.8% regarding the number of fruit-tree (Table5) bringing a confirmation of the fact.
Compared to 1989, in the year 2000 the areas of in bearing orchards represented 81.42% of the fruit-growing patrimony (Table 4) and taking into consideration the number of fruit-trees it represented 86.77% (Table 5). The yearly mean rhythm of decrease during the analysed period was of 1.77% (Table 4)5.
4
the veracity of the tendency line: a tendency line is more veracious when the root-mean-square deviation is equal or almost equal to 1.(R root: is an indicator from 0 to 1 that shows how exactly the estimated values for the tendency line correspond to the existing data. A tendency line is closer to the truth when the R root is equal to 1 or closer to 1, it is also knows as the determining coefficient)
5
the calculus of the average rate was done having as a starting point the mean index of the analyzed period, which was calculated using the method of autoregressions, according to the
relation
thus taking into account all the terms of the series and grasping all
the autoregressive movements (from one term to another)
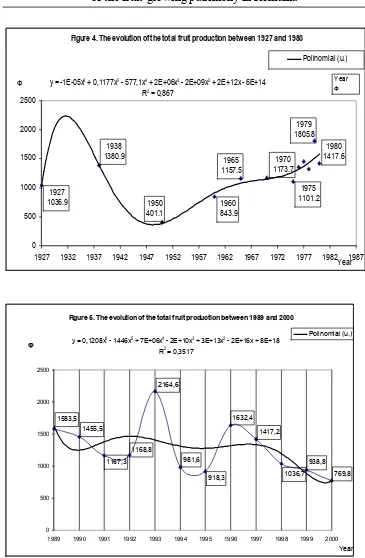
During 1927-1980 the total fruit production registered a multiannual average of 1139.6 thousand tonnes (Table 6) which an index of 102.66% in the year 1980 compared to year 1938 (Table 6). As a Pearson coefficient of variation is of 29.49% we can consider the annual average at the limit of representative ness for the analysed period. Approximately, the same situation existed in the case of the production of the in bearing orchards (the production of fruit bushes and of strawberries is subtracted from the total fruit production). The tendency line of the total fruit production can be expressed by means of a polynomial equation of six order (R2 =0.862), due to the existence of important variation in the period 1927-1950. After the year 1950 the total fruit production in Romania increased continuously until the year 1980. The production of the year 1938 was exceeded in the year 1977 (Table 6 and Figure 4).
In the last period of the 20th century the fruit production in Romania registered important variations, as a matter of fact a veridic tendency line to express the evolution in the period 1989-2000 did not exist. A R2= 0.3517 (Figure 5) was calculated for the polynomial equation of six order confirming an uncontrolled extremely varied evolution of fruit production. The Pearson coefficient of variation 31.2% proves the important variation of fruit production in the period 1989-2000 once more (Table 7).
At the beginning of the period (1989, 1990) and mainly in the year 1993, as well as in the year 1996 and the year 1997 the production was situated above the average. In the rest of the years the fruit production in Romania registered low levels and lately even worrying ones.
Compared to the year 1989, in the year 2000 the fruit production decreased with about 49%. The average annual rate of decrease was of 12.6-12.7% (Table 7).
Conclusions
1. The decreasing tendency can be expressed by means of a three-dimensional polynomial equation with R2= 0.9594, (Figure 3) which shows that selected regression pattern was representative. If the bearing orchards follow the same regression curve, their area will decrease to about 150 thousand hectares in the year 2004 (Figure3).
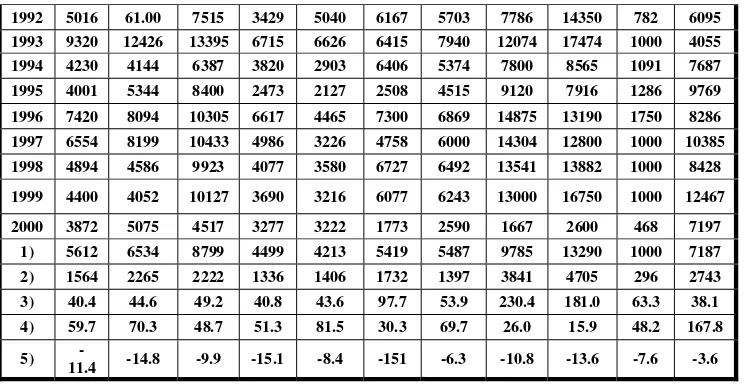
2. If we compare the average annual rates of the in bearing orchards having in mind the area the total productions and the average production (Table 4, 7, 8), we can see that the areas decreased less (-1.77%). We can draw the conclusion that the decrease of the total fruit production (-12.7%) was almost entirely due to the decrease of the average productions per hectares (with an average annual rate of -11.4%)
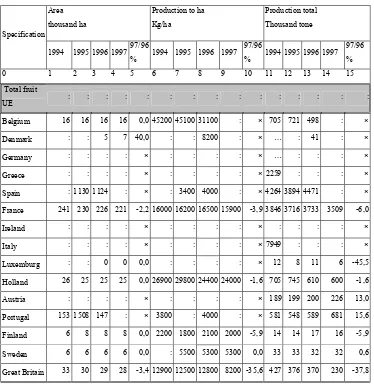
3. Comparing the average fruit production in Romania to those of UE member countries (Table 9 and 9') we can notice that in some countries, as Belgium, France and Holland, the average fruit production exceeds three times up to nine times the average fruit production in Romania, while in others, as Spain for example, the average total fruit productions were under 500kg/ha, in the period 1997-2000.
Table 3 . The proportion of the fruit-growing plantations from the agricultural area.
x. 9) 1989 1997 1998 1999 2000
a. α. 239.5 214.0 211.8 208.9 195.0
v. α. 14759 14748 14746 14782 148.10
Table 4. The dynamic of the structure of fruits-growing patrimony in the last period of the 20th century
Year a. b. c. d. e. f. g. h. i. j. k. l. m. n. p. q. r. s. t.
1989 239.50 96.60 9.00 77.30 20.50 8.50 21.50 3.80 2.30 3.40 6.90 2.60 7.51 30.30 6.23 42.70 3.47 5.30 347.91
1990 230.70 90.80 8.70 101.10 8.00 6.70 11.50 2.40 1.50 3.30 5.00 2.60 5.48 23.88 3.18 40.84 2.19 0.52 293.81
1991 232.79 89.40 8.50 102.90 7.80 6.65 13.20 3.01 1.33 2.90 3.50 2.40 3.20 24.75 2.43 36.78 1.02 0.54 310.31
1992 230.40 88.70 8.40 101.10 7.40 6.60 13.40 2.80 2.00 2.30 2.10 2.20 6.43 20.46 1.92 32.99 0.40 0.40 299.60
1993 233.20 88.30 8.10 104.80 7.50 6.50 13.40 2.70 1.90 1.60 1.80 2.00 8.97 18.49 1.00 28.65 0.28 0.38 296.37
1994 228.60 87.60 8.00 101.50 7.20 6.40 13.10 2.50 2.30 1.10 1.60 1.80 9.45 19.92 1.96 23.67 0.26 0.26 288.62
1995 255.94 85.60 7.55 102.10 6.39 6.06 13.37 2.51 2.36 0.70 1.30 1.60 7.96 16.79 0.93 17.60 0.10 0.33 273.25
1996 218.24 81.50 7.20 100.20 5.90 6.03 12.99 2.37 2.05 0.40 1.40 1.40 7.59 18.24 0.49 14.00 0.10 0.27 262.13
1997 214.99 81.00 6.66 98.60 5.32 5.81 13.30 2.33 1.97 0.40 1.30 1.30 9.60 18.12 0.24 11.47 0.10 0.17 257.69
1998 211.79 79.50 6.48 99.20 5.02 5.48 11.99 2.37 1.75 0.30 1.40 1.30 8.95 17.85 0.42 10.53 0.03 0.30 252.87
1999 208.90 77.98 6.36 98.78 5.14 5.16 11.50 2.42 1.56 0.30 1.50 1.80 7.51 18.95 0.20 9.63 0.03 0.33 249.15
2000 195.00 71.20 6.0 95.70 3.60 4.40 10.50 2.10 1.50 0.51 1.60 1.50 2.98 16.90 0.22 8.44 0.01 1.20 228.36
1) 222.50 84.85 7.58 98.61 7.48 6.19 13.31 2.61 1.88 1.43 2.45 1.88 7.14 20.07 1.60 23.11 0.67 0.83 280.01
2) 12.31 6.57 0.98 6.80 4.13 0.96 2.64 0.43 0.33 1.17 1.71 0.46 2.15 3.85 1.68 12.31 1.04 1.37 31.18
3) 5.53 7.74 12.87 6.90 55.24 15.5 19.81 16.32 17.84 81.73 69.86 24.65 30.07 19.20 105.10 53.26 15.6 164.46 11.13
4) 81.42 73.71 66.67 123.80 17.56 51.8 48.84 55.26 65.22 15.00 23.19 57.69 39.68 55.78 3.53 19.77 0.29 22.64 65.64
5) -1.77
-2.6702 -3.46 1.19 -32.863 -6.32
-10.91-7.92
-5.467
-15.73
-25.40-6.00 -7.86 -25.6 -40.205
-11.58 -42.5 -85.44 -4.06
7) 79.46 30.30 2.71 35.22 2.67 2.21 4.75 0.93 0.67 0.51 0.7 0.67 2.55 7.17 0.57 8.25 0.24 0.30 100
8) 0.73 0.17 0.645 0.73 0.87
Table5. The structure of the fruit-growing patrimony in the period 1989-2000, according to the number of fruit-trees.
Table 6. The fruit production in Romania in various years between 1927 and 1980
Table7. The fruit production in Romania in the last period of the 20th century
1994 981.6 100 968.1 98.6 363.0 37.0 51.1 5.2 385.
7 39.3 20.9 2.13 34.6 3.52 70.4 7.2 19.5 2.0 22.9 2.33 1.2 0.1 12.3 1.3
1995 918.3 100 904.7 98.5 457.2 49.8 63.0 6.9 252.
5 27.5 13.4 1.46 15.3 1.67 60.5 6.6 22.8 2.5 20.0 2.18 0.9 0.1 12.7 1.4
1999 938.8 100 919.8 98.0 316.1 33.7 63.8 6.8 364.
6 38.8 16.4 1.75 31.6 3.37 71.8 7.6 31.2 3.3 24.3 2.59 0.3 0.0 18.7 2.0
2000 769.8 100 758.0 98.5 360.3 46.8 27.1 3.5 316.
6 41.1 11.6 1.51 7.8 1.01 27.2 3.5 3.5 0.5 3.9 0.51 0.2 0.0 11.6 1.5
Table 8. Productivity of the cultivated fruit-growing species in Romania
Year a. b. c. d. e. f. g. h. i. j. k.
1992 5016 61.00 7515 3429 5040 6167 5703 7786 14350 782 6095 1993 9320 12426 13395 6715 6626 6415 7940 12074 17474 1000 4055 1994 4230 4144 6387 3820 2903 6406 5374 7800 8565 1091 7687 1995 4001 5344 8400 2473 2127 2508 4515 9120 7916 1286 9769 1996 7420 8094 10305 6617 4465 7300 6869 14875 13190 1750 8286 1997 6554 8199 10433 4986 3226 4758 6000 14304 12800 1000 10385 1998 4894 4586 9923 4077 3580 6727 6492 13541 13882 1000 8428 1999 4400 4052 10127 3690 3216 6077 6243 13000 16750 1000 12467 2000 3872 5075 4517 3277 3222 1773 2590 1667 2600 468 7197 1) 5612 6534 8799 4499 4213 5419 5487 9785 13290 1000 7187 2) 1564 2265 2222 1336 1406 1732 1397 3841 4705 296 2743 3) 40.4 44.6 49.2 40.8 43.6 97.7 53.9 230.4 181.0 63.3 38.1 4) 59.7 70.3 48.7 51.3 81.5 30.3 69.7 26.0 15.9 48.2 167.8 5)
-11.4 -14.8 -9.9 -15.1 -8.4 -151 -6.3 -10.8 -13.6 -7.6 -3.6
Sours: The Agricultural Situation in the European Union, 1998, Report, European Commission, Brussels ● Luxembourg, 1999, pages 238-240.
Table 9'. Area, production to ha and production total in UE member country, to fruit between1997 and 2000
Area thousand ha
Production to ha Kg/ha
Production total Thousand tone Specification
1994 1995 1996 199797/96
% 1994 1995 1996 1997 97/96
% 1994 1995 1996 1997 97/96 %
0 1 2 3 4 5 6 7 8 9 10 11 12 13 14 15
Total fruit
UE : : : : : : : : : : : : : : :
Belgium 16 16 16 16 0,0 45200 45100 31100 : × 705 721 498 : ×
Denmark : : 5 7 40,0 : : 8200 : × … : 41 : ×
Germany : : : : × : : : : × … : : : ×
Greece : : : : × : : : : × 2259 : : : ×
Spain : 1130 1124 : × : 3400 4000 : × 4264 3894 4471 : ×
France 241 230 226 221 -2,2 16000 16200 16500 15900 -3,9 3846 3716 3733 3509 -6,0
Ireland : : : : × : : : : × : : : : ×
Italy : : : : × : : : : × 7949 : : : ×
Luxemburg : : 0 0 0,0 : : : : × 12 8 11 6 -45,5
Holland 26 25 25 25 0,0 26900 29800 24400 24000 -1,6 705 745 610 600 -1,6
Austria : : : : × : : : : × 189 199 200 226 13,0
Portugal 153 1508 147 : × 3800 : 4000 : × 581 548 589 681 15,6
Finland 6 8 8 8 0,0 2200 1800 2100 2000 -5,9 14 14 17 16 -5,9
Sweden 6 6 6 6 0,0 : 5500 5300 5300 0,0 33 33 32 32 0,6
Sours: European Commission (Eurostat); Member states ; http:// www.europa.eu.int/comn/agriculture/agrista/2001/table_en/en45.htm
Area thousand ha
Production to ha Kg/ha
Production total Thousand tone Specificati
on
1997 1998 1999 2000 00/99
% 1997 1998 1999 2000
00/99
% 1997 1998 1999 2000 00/99 %
0 1 2 3 4 5 6 7 8 9 10 11 12 13 14 15
Total fruit
UE : : : : : : : : : : : 20476 : : :
Belgium 17 17 18 18 -0,9 31800 36100 43000 44900 4,4 540 614 760 787 3,4
Denmark 7 7 7 : : 7300 73000 7000 : : 51 51 51 : :
Germany : : : : : : : : : : : 1460 : : :
Greece 280 280 : : : 4400 5000 : : : 1241 1404 2078 : :
Spain 1144 1130 1146 : : 4400 3900 4400 : : 4983 4419 5097 : :
France 221 215 213 212 -0,4 15900 14000 17400 17300 -0,9 3522 3004 3708 3681 -0,7
Ireland : : : : : : : : : : 17 14 17 17 0,0
Italy : : : : : : : : : : 8960 9303 : : :
Luxembur
g 1 2 : : : 6000 1800 : : : 6 4 5 6 24,1
Holland 25 25 25 23 -5,8 24000 28900 31400 31300 -0,2 599 717 771 725 -5,9
Austria : : : : : : : : : : : 537 563 651 15,6
Portugal 175 178 175 : : 5800 4100 : : : 1015 730 : : :
Finland 8 8 8 8 : 2000 1600 1800 2200 18,1 16 13 15 18 17,7
Sweden 6 6 5 : : 5500 4800 6100 : : 33 29 33 : :
Great
Figure 1. Evolution of the fruit-growing patrimony in course of time
340,1
247
184,2
212,6
359,6
313,6
245,5 239,9 428,4
y = -0,2867x6 + 9,0687x5 - 110,78x4 + 651,99x3 - 1877,3x2 + 2382,3x - 715,94
R2 = 0,8854
0 50 100 150 200 250 300 350 400 450
1927 1938 1950 1960 1970 1980 1990 1997 1999 Year α
Figure 2. The structure of the fruits-growing patrimony in the period 1989-2000 (%)
s., 0,30
j., 0,51 k., 0,87
q., 8,25
l., 0,67 p., 0,57
m., 2,55 n., 7,17
r., 0,24
α Figure 3. The tendency of the in growing areas between 1989 and 2000, extending to 2004.
a.
y = -0.0355x3 + 212x2 - 422209x + 3E+08 R2 = 0.9594
b.
y = -0.0332x3 + 198.41x2 - 395604x + 3E+08
R2 = 0.9666
d.
y = 0.1085x3 - 649.43x2 + 1E+06x - 9E+08
R2 = 0.7588
c.
y = 0.0018x3 - 11.002x2 + 21957x - 1E+07
R2 = 0.9897
0 50 100 150 200 250 300
1988 1990 1992 1994 1996 1998 2000 2002 2004 2006
Year
Polinomial (a.) Polinomial (b.) Polinomial (d.) Polinomial (c.)
Figure 4. The evolution of the total fruit production between 1927 and 1980
1927 1932 1937 1942 1947 1952 1957 1962 1967 1972 1977 1982 1987
Year
Φ
Polinomial (u.)
Year Φ
Figure 5. The evolution of the total fruit production between 1989 and 2000
1583,5
1989 1990 1991 1992 1993 1994 1995 1996 1997 1998 1999 2000
Year Φ
Legend
a. in bearing orchards b. apples
c. pears d. plums
e. peaches f. apricots
g. cherries, morellos h. walnuts
i. other species j. fruit bearing, bushes and shrubs
k. strawberries l. seedlings
m. orchard clearings n. preparing area p. orchards-new plantation q. young orchards r. young fruit bearing, bushes and shrubs s. young strawberries t. total fruit-growing patrimony o. total fruits
u. total production v. agricultural area
x. specification 1) mean
2) root-mean-square deviation 3) the Pearson coefficient of variation (%)
4) index 2000/1989 (%) 5) average annual rate (%) 6) index 1980/1938 (%) 9) measure units
8) correlation coefficient α. thousands hectares β. thousands pieces φ. thousands tons y. the proportion of the in growing orchards from the agricultural area 7) the species structure of the total fruit-growing patrimony
References:
1. Teaci D., Puiu S., Amzar Gh., Voiculescu N.,Popescu I., The influence of the Environment Conditions upon Fruit-tree Growing in Romania, Ed Ceres, Bucharest, 1985.
2. Merce E., Urs Fl., Merce C., Statistică, Editura AcademicPress, Cluj-Napoca, 2001.
Authors:
Florin Urs - “Bogdan Vodă” University, Faculty of Economics Sciences, city of Cluj Napoca, Romania, E-mail: [email protected]