164
THE IMPACT OF FINANCIAL RATIOS ON STOCK RETURN: EVIDENCE
FROM RETAIL COMPANY LISTED IN INDONESIA STOCK EXCHANGE
DURING 2011-2013
Stephen Christian
International Business Management Program, Petra Christian University Jl. Siwalankerto 121-131, Surabaya
E-mail: [email protected]
ABSTRACT
Indonesia is one of the biggest economies in the world, proven by its involvement in G20. Not only that, Indonesia Stock Exchange is also attractive for the investor. In opening of 2013, Jakarta Composite Index positioned themselves in 4,316.69 and increased to 5,214.98 only in five months, highest position ever. Retail industry is also a promising industry in Indonesia given the fact that the sales in 2014 is 178% of 2010 sales. Given all of the facts, there might be many investor that is interested in investing in retail industry in Indonesia. However, they need to adapt some tools to help them understand the unpredictable movement of stock market.
This research tries to predict the stock return by using three financial ratios, which are price earnings ratio, dividend yield, and book to market ratio. This research will use multiple linear regression to test the hypothesis by including all of the population available. The result of this research conclude that price earnings ratio, dividend yield, and book to market ratio has significant effect on stock return simultaneously whereas, only dividend yield is the only ratio that might predict the stock return individually.
Keywords: Financial ratio, stock return, retail company, Jakarta stock exchange.
ABSTRAK
Indonesia adalah salah satu negara dengan ekonomi terbesar di dunia, terbukti dengan tergabungnya Indonesia dalam G20. Bukan hanya itu saja, Bursa Efek Indonesia juga sangat menarik bagi investor. Pada pembukaan tahun 2013, Bursa Efek Indonesia berada pada posisi 4,316.69 dan naik menjadi 5,214.98 hanya dalam lima bulan, tertinggi dalam sejarah. Industri ritel juga adalah salah satu industri yang menjanjikan di Indonesia dengan fakta bahwa penjualan pada tahun 2014 adalah 178% penjualan tahun 2010. Dengan bukti – bukti tersebut, terdapat kemungkinan bahwa banyak investor yang tertarik untuk berinvestasi di industri ritel Indonesia. Namun, mereka butuh untuk menggunakan alat yang dapat membantu mereka untuk memahami pergerakan yang tidak terprediksi pada pasar saham.
Riset ini mencoba untuk memprediksi keuntungan saham dengan tiga rasio keuangan yaitu price earnings ratio, dividend yield, dan book to market ratio. Analisis regresi linear berganda akan digunakan untuk menguji hipotesa yang ada dengan menggunakan seluruh populasi yang tersedia. Hasil dari riset ini menyimpulkan bahwa price earnings ratio, dividend yield, dan book to market ratio dapat memprediksi keuntungan saham secara bersama, sedangkan hanya dividend yield yang dapat memprediksi keuntungan saham secara sendiri.
Kata Kunci: Rasio keuangan, keuntungan saham, perusahaan ritel, bursa efek Jakarta.
INTRODUCTION
Indonesia economic is one of the biggest economies in the world, proven by the involvement of Indonesia in G20 membership that consist of world’s largest advanced and emerging economies (G20, 2015). Not only that, stock market in Indonesia (Indonesia Stock Exchange) is also attractive for the investor. Entering 2013 with Jakarta
165 Retail industry in Indonesia is promising, given the fact that the real retail sales in Indonesia at the end of 2014 already 178% compared to 2010 sales, nearly doubled only in 4 years. Moreover, the growth in this industry is highly influenced by the sales of information and communication equipment category such as smart phone and computer, which already triple in the sales index and clothing category sales already 76% higher than 2010 sales (Indonesian Central Bank, 2015). Moreover, the opportunity of online retail has not been fully utilized in Indonesia. It gives more opportunity for the company to expand and explore this market since the demand for online retail is high (Global Business Guide Indonesia, 2014). Study from The Economist revealed that the retail industry can grow rapidly in country that is having large population with increasing purchasing power (The Economist Intelligence Unit, 2014). Not only from The Economist, International Enterprise Singapore also stated that consumerism due to increasing middle class and income level can make the opportunity for retail industry is widely opened (Lee, 2013). One of the countries that is stated in the report is Indonesia.
Study from Boston Consulting Group revealed that there will be an additional of 67 million new middle, upper-middle, affluent and elite consumers (MAC population) in Indonesia by 2020 from 74 million in 2012 (Rastogi, Tamboto, Tong, & Sinburimsit, 2013). As mentioned above that retail industry in Indonesia is lucrative for investor since the growth is determined by the incremental of the wealth of people living in the country, it might be the right time for the investor to jump in to this industry in Indonesia to invest their money. This provides big opportunity for the investor to grab profit at the end of 2020. It is also supported by the fact that the sales in retail industry in Indonesia are increasing for about 24% in January 2014 from previous year (Indonesian Central Bank, 2015). Currently, there are 22 companies listed in Indonesia Stock Exchange that bound in retail trade category (Research and Development Division Indonesia Stock Exchange, 2014). These companies sold various kind of product started from electronic goods, daily goods, garments, et cetera. However, the choice of the company might vary toward the investor.
Since the opportunity for the retail industry to grow is huge in Indonesia, given the fact that the purchasing power of Indonesian is still rising and the sales in the retail industry is growing from the year of 2013 to January 2014, there might be investors in both Indonesia and abroad that is interested in investing their money in retail industry in Indonesia Stock Exchange.
Many people stated that stock market is something that is unpredictable. Investors always faced to a choice of wait or take action. Any of those circumstances might bring drawback to the investor such as loss of momentum or opportunity loss. However, investor is actually try to predict the movement of the share price so they will not lose any cents of their money, if probable they will buy at low price and sell it as high as possible to gain profit. In order to do so, they believed that there are several ways to sense the movement as well as predict the behavior of the changes. There are several probable basis to predict the stock return
such as price/earnings ratio, dividend growth model, and economic fundamental of a country, et cetera (Davis, Aliaga-Diaz, & Thomas, 2012). Study from Fama & French (1988) and Campbell & Shiller (1989) revealed that dividend-price ratio (dividend yield) could also become one of predictive tools in determining the stock return. Another study from Pontiff & Schall (1998) and Fama & French (1992) believed that book-to-market ratio could forecast the stock return. Being that said from previous research it can be concluded that financial ratio which include price/earnings ratio, book to market ratio and dividend yield can help in predicting the stock price.
Financial ratio is one of the tools that is important for everyone to use for, mainly for measuring company’s performance (Gitman & Zutter, 2012). Company’s performance that is extracted can be useful for both internal and external party. Internal users use the information for manage their business, while the external users use it for make their decision either for invest in the company or give credit for the company (Weygant, Kimmel, & Kieso, 2010). Financial ratios are used by investor in getting the big picture of the historical, current as well as predictive future toward company condition that affect share price (Gitman & Zutter, 2012).
Since it is also believed that financial ratio is one of the fundamental tools in determining the stock price, this research will capture this opportunity to explore more. Financial ratios can help investor in executing their investment toward different available company in the market. Based on Gitman & Zutter (2012), there are five financial ratio categories that is used in the world, which are liquidity, activity, debt, profitability, and market ratios. However, this study will attempt to re-test similar research that has been done previously by Lewellen (2004) and Margaretha & Damayanti (2008) that cover three main ratios which are, price/earnings ratio, book to market ratio, and dividend yield. This study will focus more on the impact of those three ratios in influencing the stock return altogether where Lewellen do it separately and Margaretha & Damayanti add with non-financial ratio to predict the stock return.
This research can help either current or future investor whether they see retail industry in Indonesia as prospective industry to be invested for or not. This research will use several financial ratios as the construction in determining stock return since it is believed that financial ratio can help investor to understand the stock return that they might get in the future. Moreover, this research will focus on acquiring evidence from a growing retail industry in Indonesia from the year of 2011-2013. The year is chosen since it can provides total of 15 companies included in the research, if the time frame is added, which from 2009-2013 is chosen, the total companies that is included is 11. Moreover at the end, after looking upon missing data, the total sets of data is the same, which is 45. Since the total data is the same, the researcher prefer to include more companies in this research.
166 are price/earnings ratio, book to market ratio, and dividend yield.
LITERATURE REVIEW
Recently, paper written by Davis, Aliaga-Diaz, & Thomas in 2012 stated that stock return can be forecasted by several properties such as financial ratio, economic fundamental, common multi-variable valuation models, et cetera. Based on the research done by Martani, Mulyono, & Khairurizka (2009), there are many ratios that might be used in determining the stock return, such as return on equity, earning per share, price/earnings ratio, debt to equity ratio, profit margin, book to market ratio, dividend, et cetera. However, this research will only focus on three ratios, which are price/earnings ratio, book to market ratio, and dividend yield as predictor toward stock return. It is chosen since those three ratios use price in the equation. Price is important because it becomes the relative to the valuation of the company’s share (Gitman & Zutter, 2012). Moreover, the ratios chosen has the properties to see the return that company bring to the investor, such as dividend (dividend yield) and earnings available for shareholder (price/earnings ratio) and the valuation of the company, whether it is undervalued or overvalued (book to market ratio).
Basically, ratio is the information gathered from the financial statement of the company (Gitman & Zutter, 2012). Financial statement consist of four type of report which are income statement, balance sheet, statement of stockholders’ equity and statement of cash flows which has its own used; however, the bottom line of all of the financial statement is to provide the financial summary of the company’s performance during the year which that report is reported (Gitman & Zutter, 2012). In conclusion, it can be seen that ratio is one of the powerful tools for the investor to see the highlight of the company’s performance since the data to count the ratio gathered from the financial statement.
Throughout this chapter, there will be several definitions as well as the relationship from several concepts regarding this research. Several concepts that will be explained further are price/earnings ratio, book to market ratio, dividend yield, and stock return. The explanation begins with the definition toward the concept and end with the relationship between the independent and dependent variable. Moreover, there will be several conclusions toward the study that has been done previously. All of the evidences are needed in order to build a strong foundation in this research
Price/earnings Ratio
In order to understand price/earnings ratio, there is a need to understand another financial ratio first, which is earnings per share ratio (EPS ratio). Earnings per share is actually reflecting how much earning that the company has per common share outstanding (Gitman & Zutter, 2012). The earnings has by the company for the common stock holder means net income of the company subtracted with the preferred stock dividend (if any) (Weygant, Kimmel, & Kieso, 2010). Whereas the number of shares of common
stock outstanding is the total common stock that is issued both for private and public investors (Gitman & Zutter, 2012). Hereby the formula of earnings per share by Gitman & Zutter (2012):
EPS = Earnings available for common stockholderst
Number of shares of common stock outstandingt
Usually, this ratio is being used to measure the profitability of a company (Weygant, Kimmel, & Kieso, 2010). Increasing EPS ratio means that the company is profitable for the investor. On the other hand, investor might leave company with low EPS ratio since the company cannot bring high earnings or income available for the shareholder (Gitman & Zutter, 2012).
Understanding earnings per share ratio is important to understand price/earnings ratio (P/E ratio) since earning per share ratio will become the denominator for P/E ratio. P/E ratio summarizes the dollar amount that investor willingly to sacrifice for each company’s earnings (Gitman & Zutter, 2012). Hereby the formula for calculating price/earning ratio:
Price/earnings ratio = Market price per share of common stockt
Earnings per sharet
This ratio is being used to see the confidence level of the investor since this ratio shows how many dollar that the investor pay for each company's earning; the higher the ratio, the more confident the investor is, vice versa (Gitman & Zutter, 2012). This is possible since high company growth might be reflected from the high price earnings ratio, where low ratio means low company growth as well (Margaretha & Damayanti, 2008). Investors will use this ratio as a benchmark to choose which company they should put their money into (Gitman & Zutter, 2012).
Book to Market Ratio
In order to count book to market ratio, there is a need to count the book value per share of common stock. Book value per share of common stock shows how many dollars available if the asset of the company sold and the debt has been paid (common stock equity) and distributed to every shareholder (Gitman & Zutter, 2012). Hereby the formula to count book value per share of common stock based on Gitman & Zutter (2012):
Book value per share of common stock =
Common Stock equityt
Number of shares of common stock outstandingt
Moreover, the calculation for book to market ratio is quoted as below based on Pontiff & Schall (1998):
Book to market ratio = Book value per share of common stockt
Market price per share of common stockt
167 Zutter, 2012). The finance literature formula tries to see the confidence of the investor given the performance of the company. However, this research will use book to market ratio since it indicates the real value of the investment in the company per dollar they invested, whether it is undervalued or overvalued.
Dividend Yield
Dividend yield indicates the dividend paid by the company in the return of the investment of the investor; where dividend is the cash that is distributed to the shareholder of the company (Gitman & Zutter, 2012). Based on Fama & French (1988), the formula to count dividend yield is derived from constant growth model / Gordon growth model for stock valuation. Hereby the formula for calculating dividend yield based on Fama & French (1988):
Dividend yield = Dividend per share at yeart
Share price at yeart-1
The formula from Fama & French (1988) expecting the user to know how much return that the investor get from the dividend paid by the company as the result of the previous year investment. Actually, there is also another formula to calculate dividend yield. Wild, Larson, & Chiappetta (2007) quotes that the dividend yield is the fraction of dividend per share at year X to share price at year X. They count it that way is just to know the return from the dividend as they invest at the time when the dividend distributed. Through this formula, it does not imply the stock return that expected from this research. That is why, this research will use the formula that configured by Fama & French (1988).
Stock Return
In the capital market, there are two returns that are expected by the investor. One is the capital gain or the gain from the price of the share and also dividend that paid by the company (Gitman & Zutter, 2012). Stock return is an important aspect in this research since it is the variable that is going to be researched on. It is already become an interesting subject to be researched by most economist as well as stock investor (Pontiff & Schall, 1998). The formula to calculate total return of the investment based on Gitman & Zutter (2012) is:
rt = Dt+PPt-P
t-Where:
Pt = price (value) of asset at time t Pt-1 = price (value) of asset at time t - 1 Dt = dividend received at time t rt = return on common stock Relationship between Concepts
It is believed that stock return is no longer something that unpredictable. According to Gitman & Zutter (2012) and Davis, Aliaga-Diaz, & Thomas (2012) it is believed that
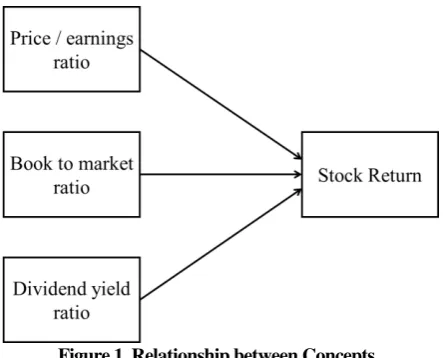
financial ratio can be one of the tools to predict the stock return. This research will focus on three ratios, which are price/earnings ratio, book to market ratio and dividend yield that can affect the stock return.
Price/earnings ratio is perceived as one of the predictors of stock return. Empirical study by Basu (1977) argued that the price/earnings ratio could be the dependent of the stock return or the common stock price at that moment. Basu tried to argue that a company with low price/earnings ratio will have higher return compare to the company with high price/earnings ratio. This result is also confirmed by study from Jaffe, Kein, & Westerfield (1989).
Book to market ratio shows its relationship with the stock return since book to market ratio indices the value that the investor invested in the company. There are several studies that has confirmed the relationship between book to market ratio and stock return, which are study from Fama & French (1992), Pontiff & Schall (1988), and Kheradyar, Ibrahim, & Mat Nor (2011)
The dividend yield by the formula itself already shows the relationship between the variable and the stock return. Dividend yield possessed dividend paid by the company that also one of the component of the stock return. This argument is supported by research from Fama & French (1988), Campbell & Shiller (1989), and Lemmon & Nguyen (2015).
Figure 1. Relationship between Concepts
Given the relationship between concepts, this research will attempt to prove these two hypotheses, which are:
• H1: There is an impact of price/earnings ratio, book to market ratio and dividend yield to stock return simultaneously in retail industry in Indonesia since 2011 - 2013.
• H2: There is an impact of price/earnings ratio, book to market ratio and dividend yield to stock return individually in retail industry in Indonesia since 2011 - 2013.
RESEARCH METHOD
168 variables that included in this research, three variables are the independent variables and the other one is the dependent variable. The independent variables are price/earnings ratio, book to market ratio, and dividend yield. Moreover, stock return will act as the dependent variable.
PEt = EPSPt t
BMt = BVP t t
DYt = PDt t-1
rt = Dt+PPt-P
t-Where:
Pt = price (value) of asset at time t Pt-1 = price (value) of asset at time t - 1 Dt = dividend received at time t
BVt = book value of common stockholder at time t EPSt = earning per share at time t
rt = return on common stock at time t PEt = price earnings ratio at time t BMt = book to market ratio at time t DYt = dividend yield at time t
Since this research will use financial ratio as its properties to determine the stock return, ratio type of data will be used since there is a natural origin. Based on Cooper & Schindler (2014) there are three sources of data, which are primary, secondary, and tertiary data. Primary data can be defined as the raw data of the research that has no interpretation. The example of primary data are memos, interview, laws, etc. Secondary data is actually the interpretation of the primary data; with example of textbooks, magazine, newscast, etc. At last, tertiary data that can be defined as the interpretation of secondary data, in example, indexes, bibliographies, etc.
All of the data that is gathered for this research are coming from secondary data. The data will be coming from the annual report or annual financial statement from the company from the year of 2011 to 2013. The scope of the research is limited according to that year in order to get more company that is researched with enough number of data (detailed regarding the sampling method will be explained in next section). The financial statement could be gathered from either company website or trustable source such as Indonesia Stock Exchange. The data gathered from the financial statement will be used to calculate the variable inspected.
Not only gathering data from the financial statement, this research will also use several news in order to acquire the information of dividend paid by the company. As being mentioned before that the activity to distribute the dividend will be announced publicly by the company. Lastly, the stock price data will be compiled from Yahoo! Finance. Yahoo
finance is chosen since it can provide detailed data for the period inspected during this research.
Based on Cooper & Schindler (2014), there are several criteria in determining good measurement tool; which are validity and reliability. Observing the validity of the research can provide the researcher a big picture whether the test is already coherent with the purpose of the study whereas reliability determines whether the measurement procedure can bring accurate result.
There are two types of validity, which are internal and external validity (Cooper & Schindler, 2014). Internal validity is checking whether the research instrument is really measuring what going to be researched. In internal validity, there are content, criterion-related, and construct validity. In this research, the content of the ratio that going to be included is publicly audited that already become the standard for publicly traded company. Moreover, the data of the dividend payment will be gathered from company website or news since there is regulation for company that wants to pay their dividend need to publish that activity (Otoritas Jasa Keuangan, 2014). Criterion-related validity can be judge by its relevance, freedom from bias, reliability, and availability. The measurement of the ratio is already clearly defined in previous section that makes its relevance. There is no bias in this research since most of the data are gathered from annual report that has been publicly audited. The research is also reliable since all of the data gathered in annual basis, at the end of the year. Moreover, the data that will be used for the research need to be available online otherwise the company will be dropped since there is missing data. Lastly, this research is also already well-grounded to cater construct validity. The theory regarding the variables has been explained in previous chapter and its relationship also has been discussed. Seeing all of the explanation above, it can be concluded that this research is internally valid and reliable. This research will not look upon external validity since all of the data are gathered from secondary result that will not having a problem toward the reactivity of the people that might be included in this research.
169 This research will use multiple linear regression. In order to run the regression test there will be several preliminary test will be conducted to make sure that the data are ready to be examined further. The tests are homoscedascity test, autocorrelation test, multicollinearity test, and normality test. For homoscedascity test, this research will use Park test. Park test will use the square of residual of the linear regression as dependent variable and test it again with the independent variable. The expected result is the significance value above 0.05 that conclude the residual of the data is homoscedastic (Ghozali, 2013). This research will also use a non parametric test called “Run Test” to detect autocorrelation problem. The expected result is significance value above 0.05 indicates that the residual of the data is not autocorrelating (Ghozali, 2013). For multicollinearity test, this research will use correlation table. If the value if above 0.90 it can be concluded that the independent variables are highly correlated which is not preffered (Ghozali, 2013). Lastly, to test the normality of the residual, this research will use one of the non-parametric test which is the Kolmogorov-Smirkov (K-S) test. The desirable result would be the significance value is higher than 0.05 which indicates the residual of the data is normally distributed (Ghozali, 2013). When the data already pass this four tests, now the data is ready to be tested using multiple linear regression. This analysis is used to know the impact of at least two independent variables on a dependent variable. This analysis is fit upon this research since this analysis provides explanation of the relationship between the independent and dependent variable. There are several information can be grabbed from running this test. First is coeeficient of determination; this information is gathered to know how well the current independent variable predicts the dependent variable (Ghozali, 2013). The value that is going to be used is adjusted R square in the ANOVA table later on. Adjusted R square is chosen since this research will use more than one independent variables (multiple linear regression) (Ghozali, 2013). Second, simultaneously significance test (F-test); this test is attempted to see whether there is a simultaneously impact to the dependent variable when all of the independent variable is accounted. When the F-test resulted in less than 0.05 it indicates that current independent variables are simultaneously predicting dependent variable. Third, Individual significance test (T-test); this test is attempted to see whether there is individual impact of each independent variable toward the dependent variable. When the T-test resulted in less than 0.05 it indicates that current independent variable tested is individually predicting dependent variable
RESULTS AND DISCUSSION
From the previous chapter, it has been described that there are 17 companies that can be included in this research. However, there are two companies that their financial statement could not being gathered, that makes those two were dropped from this research. This missing data can be concluded as data missing completely at random where the probability of the missing data is not dependent to any of the variables (Cooper & Schindler, 2014). With this missing
data, it can be concluded that there are 15 companies that going to be observed during this research with total data of 45 sets.
Currently, there are four tests that need to be used to make sure that the data are ready to be processed further. Below table are the summary of the results of subsequent tests.
Table 1. Assumption Test
Test Result
Park Test B/M Ratio and D/Y are
significant (Not Pass)
Run Test Not significant (Pass)
Multicollinearity Test No value above 0.90 (Pass)
K-S Test Significant (Not Pass)
Based on those results, it can be concluded that current sets of data having two problems, which are the variance of the residual for each sample is not the same (heteroscedastic) and residual of the data is not normally distributed. Due to these violations to the current assumption, remedy action should be taken so the data can be further processed.
According to Hair Jr., Black, Babin, & Anderson (2009) in their book titled “Multivariate Data Analysis”, researcher should take care normality problem in small sample size case since the impact will be quite serious. In remedying the data, there is a need to transform the data to be a better one. The variables that need to be transformed is the independent variables if the problem occurred is only normality. If the problem of heteroscedasticity also occurs, the dependent variable might be transformed. The data transformation that need to be taken should be on trial and error basis that might consumed time. Ghozali (2013) suggested that data transformation should be taken based on the case of the normal distribution of each variable. The remedy action taken in order to make the data in the certain variable following normal distribution. When the data is following normal distribution, it is believed that the residual will also following normal distribution. Moreover, outlier data should be taken care as well. Ghozali suggest that outlier data is not necessary to be taken out since it also picturing the sample, whereas Hair Jr. et al suggest that outlier data can be deleted from the observation as unrepresentative.
Below table summarize the problem given the histogram of the data and the remedy action need to be taken. Table 2. Remedy Action
Note: k is the biggest data in subsequent variable
If the transformed data resulted in error, original data will still be used
After Transformation
Below table summarize the assumption test after the transformation/remedy action taken into place.
Variables Problem Action Taken P/E Ratio Moderate (-) skew SQRT (k-x)
DY Moderate (+) skew SQRT(x)
170 Table 3. Assumption Test after Transformation
Test Result
Park Test All are not significant (Pass)
Run Test Not significant (Pass)
Multicollinearity Test No value above 0.90 (Pass)
K-S Test Not significant (Pass)
After transforming the data, all of the result from four tests indicates that the data profiled in this research is fulfilling classical normal linear regression model (CNLRM) assumption. This includes the homocedascity and normality test that were not passed at the first or using the original value. This transformation will result in different regression model but the interpretation of the data will still be using the untransformed format (Hair Jr., Black, Babin, & Anderson, 2009).
The result of multiple linear regressions in describing the stock return as dependent variables will be shown in this section. However, the model of the regression has been changed due to data transformation conducted earlier. The model now will be:
√R= β +β √����-PER+β √BM+β √DY+e
Where:
R : Stock return
kper : Biggest data in price earnings ratio variable PER : Price earnings ratio
BM : Book to market ratio DY : Dividend Yield e : error term
Recalling, hereby the hypothesis that is going to be tested as mentioned in previous section, that:
H1: There is an impact of price/earnings ratio, book to market ratio and dividend yield to stock return simultaneously in retail industry in Indonesia since 2011 - 2013.
H2: There is an impact of price/earnings ratio, book to market ratio and dividend yield to stock return individually in retail industry in Indonesia since 2011 - 2013.
For the first hypothesis, ANOVA table will be used since it contains F-test result in its significance. The significance of the current model is 0.033 that give the chance for the researcher to reject the null hypothesis. It indicates that the independent variables are impacting the dependent variable simultaneously. Moreover, from table 4.11 it can be seen that only 14.8% of the dependent variable can be represented with current predictor. It concludes that 85.2% of the other predictor is not covered in this research. It is probable since this research only cover three ratio as predictors which are the price earnings ratio, dividend yield, and book to market ratio; whereas outside those three there are many more ratios that also probable in predicting the stock return, namely net profit margin, return on equity, total assets turnover, and market to book ratio (Dwi Martani & Khairurizka, 2009). Dwi Martani & Khairurizka also suggest
that the firm size and cash flow from operating activities also can become one of the predictor of the stock return.
For the second hypothesis, the t-test will be used to indicate the individual impact on each independent variable on the dependent variable. The significance of each variable summarize in below table.
Table 4. T-Test Result
Independent Variable Significance Verdict
Price earnings ratio 0.879 Accept H0
Book to market ratio 0.062 Accept H0
Dividend yield 0.006 Reject H0
From the table it can be concluded that only dividend yield that has significance influence to the stock return. By the formula, it already implies that dividend yield would have significance relationship with the stock return, since dividend yield formula is included in the formulation of the stock return. From the t-table it can be concluded as well that every unit increased in dividend yield, the stock return would be increased by 2.071. For the other variables, which are the price earnings ratio and book to market ratio, it cannot predict the independent variables since the researcher fail to reject the null hypothesis. This result is aligned with all of the previous research that has been explained in chapter 2 where the dividend yield become one of the predictor of the stock return.
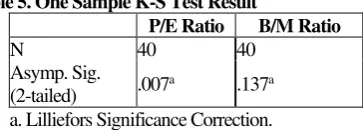
It is revealed that eventhough there is process of data transformation that is hoped to make the PER become normalized, in fact K-S test for PER variable shows result of 0.007 as shown in table 4.16 that makes the researcher should reject the null hypothesis that indicates the data of price earning ratio is not normally distributed. Even though the normalization process happened, it can be seen from the result that the PER data is still not normalized which can be seen that the problem of this research is the statistical problem which the data of the PER is not normally distributed. Table 5. One Sample K-S Test Result
P/E Ratio B/M Ratio
N 40 40
Asymp. Sig. (2-tailed) .007
a .137a
a. Lilliefors Significance Correction.
Book to market ratio is also one of the variables in which the value is being transformed in order fulfilling normality assumption of CNLRM. In the result of the data transformation, the variable itself now already following the normal distribution given the significance of 0.137, which the researcher should accept the null hypothesis. It can be concluded that even though the data has been normalized, it still cannot predict the dependent variable. This result is contradict with the previous research where the book to market ratio is one of the significant predictor for the stock return. Research from Kheradyar, Ibrahim, & Mat Nor (2011), even stated that book to market is the strongest predictor for the stock return.
171 market to be invested in (Bremmer, 2015). This fact makes more and more angel investor see Indonesia market as an opportunity (Cosseboom, 2015). Vernon, a columnist in Inc.com and CEO of VictorOps stated that usually angel investors would invest in regard of relationship or idea not the current financial performance (Vernon, 2015).
CONCLUSION
From the findings presented in previous section, it can be concluded that, first, the data pass the assumption of multiple linear regressions after the data being normalized and take the outlier out. Second, the current researches independent, which are price earnings ratio, dividend yield, and book to market ratio is significant in predicting the stock return. Third, the independent variable is only predicting 14.8% of the dependent variable. Finally, as individual independent variable it can be concluded that only dividend yield that is significant in predicting the stock return while price earnings ratio and book to market ratio are not. Given the fact of the result, it can be concluded that there is an impact of price/earnings ratio, book to market ratio and dividend yield to stock return simultaneously in retail industry in Indonesia since 2011 – 2013. However, there is only an impact of dividend yield to stock return individually in retail industry in Indonesia since 2011 – 2013. For retail industry listed in Indonesia Stock Exchange, it can be pictured that they should regularly providing dividend for the stockholder since the stockholder see dividend yield as one of the predictor tools in predicting the stock return that the investor might get. As a feedback from this research, each company can review their policy in distributing their dividend. They can decrease their threshold in distributing dividend so more investor will be attracted to invest in their company since from the policy itself they can distribute dividend easily.
This research has several limitations, which are the sample size and limited independent variables employed. This research time frame is only limited from 2011 – 2013 which resulted in only 45 data being used. The dilemma of adding more periods in this research is that some of the company is just publicly owned from 2008, which also can reduce number of companies that is included. Second, this research is only using three ratios as the predictor, which resulted in low adjusted R square (18%), while it is actually there are many ratios expected can predict the stock return as well. In fact it is not only ratio that can predict the stock return, but also firm’s size and cash flow of the company in example. Given the limitation of the research, there are several suggestions that the writer can propose. First, for upcoming research, they can add 2014 data as sample so the sample can be increased from 45 to 60 sets of data. If the financial statement of 2015 has been released later on, it also can be included so the number of sample can be increased as well. Second, upcoming research can use or add more ratios. There are many ratios that can be added such as a net profit margin, return on equity, total assets turnover, and market to book ratio. Not only ratios, but researcher can also add firm’s size and cash flow of the company as one variables in predicting the stock return.
REFERENCES
Basu, S. (1977). Investment Performance of Common Stocks in Relation to Their Price-Earnings Ratios: A Test of the Efficient Market Hypothesis. The Journal of Finance, Vol. 32, No. 3, 663-682.
Bremmer, I. (2015, January 22). Forget BRICS, here are the new 7 best emerging markets for business. Retrieved from Fortune: http://www.fortune.com
Campbell, J., & Shiller, R. (1989). The Dividend-Price Ratio and Expectations of Future Dividends and Discount Factors. The Review of Financial Studies, Vol. 1, 195-228.
Chan, K., & Chen, N.-F. (1991). Structural and Return Characteristics of Small and Large Firms. The Journal of Finance, Vol. 46, 1467-1484.
Cooper, D., & Schindler, P. (2014). Business Research Method, 12/e. New York: McGraw-Hill.
Cosseboom, L. (2015, Mar 25). 5 reasons to become an angel investor in Indonesia today. Retrieved from TechInAsia: https://www.techinasia.com/indonesia-angel-investments/
Davis, J., Aliaga-Diaz, R., & Thomas, C. (2012). Forecasting stock returns: What signals matter, and what do they say now? Malvern: The Vanguard Group. Inc.
Dwi Martani, M., & Khairurizka, R. (2009). The effect of financial ratios, firm size, and cash flow from operating activities in the interim report to the stock return. Chinese Business Review, Vol.8, No.6, 44-55.
Fama, E., & French, K. (1988). Dividend Yields and Expected Stock Returns. Journal of Financial Economics 22, 3-25.
Ghozali, I. (2013). Aplikasi Analisis Multivariate Dengan Program IBM SPSS 21, Edisi Tujuh. Semarang: Universitas Diponegoro.
Gitman, L., & Zutter, C. (2012). Principles of Managerial Finance Global Edition/13e. Essex: Pearson Education Limited.
Global Business Guide Indonesia. (2014). Retail Sector in Indonesia. Retrieved from GBG: http://www.gbgindonesia.com
Grigonis, R. (2014, January 30). 25 Top Business and Financial Websites for Republicans Making $100,000+. Retrieved from Newsmax: http://www.newsmax.com/TheWire/newsmax-list-top-business-financial/2014/01/30/id/549961/
Gujarati. (2004). Basic Econometrics, Fourth Edition. New York: The McGraw-Hill Companies.
Hair Jr., J., Black, W., Babin, B., & Anderson, R. (2009). Multivariate Data Analysis, 7/e. New Jersey: Prentice Hall.
172
Exchange:
http://www.idx.co.id/en-us/home/newsannoucement/announcement.aspx Indonesian Central Bank. (2015). Retail Sales Survey
December 2014. Jakarta: Indonesian Central Bank. Jaffe, J., Kein, D., & Westerfield, R. (1989). Earnings Yields,
Market Values, and Stock Returns. The Journal of Finance, Vol. 44, No. 1, 135-148.
Kheradyar, S., Ibrahim, I., & Mat Nor, F. (2011). Stock Return Predictability with Financial Ratios. International Journal of Trade, Economics and Finance, Vol.2, No.5, 391-396.
Lee, W. H. (2013). Indonesia's Consumer Sector: Tapping the Consumer Dollar in Food and Retail. Singapore: International Enterprise Singapore.
Lemmon, M., & Nguyen, T. (2015). Dividend Yields and Stock Returns in Hong Kong. Managerial Finance, Vol. 41, No.2, 164-181.
Lewellen, J. (2004). Predicting returns with financial ratios. Journal of Financial Economics 74, 209-235.
Liem, P., & Basana, S. (2012). Price Earnings Ratio and Stock Return Analysis (Evidence from Liquidity 45 Stocks Listed in Indonesia Stock Exchange). Jurnal Manajemen dan Kewirausahaan, Vol.14, 7-12. Margaretha, F., & Damayanti, I. (2008). Pengaruh Price
Earnings Ratio, Dividend Yield dan Market to Book Ratio Terhadap Stock Return di Bursa Efek Indonesia. Jurnal Bisnis dan Akutansi, Vol.10, 149-160.
Martani, D., Mulyono, & Khairurizka, R. (2009). The effect of financial ratios, firm size, and cash flow from operation activities in the interim report to the stock return. Chinese Business Review, Vol.8, 44-55. Otoritas Jasa Keuangan. (2014). Peraturan Otoritas Jasa
Keuangan Nomor 32/POJK.04/2014. Jakarta: Otoritas Jasa Keuangan.
Penman, S., Richardson, S., & Tuna, I. (2007). The Book-to-Price Effect in Stock Returns: Accounting for Leverage. Journal of Accounting Research, Vol.45, No.2, 427-467.
Pontiff, J., & Schall, L. (1998). Book-tomarket ratios as predictors of market returns. Journal of Financial Economics 49, 141-160.
Rastogi, V., Tamboto, E., Tong, D., & Sinburimsit, T. (2013, March 05). Indonesia's Rising Middle-Class and Affluent Consumers. Retrieved from bcg,perspectives: http://www.bcgperspectives.com
Research and Development Division Indonesia Stock Exchange. (2014). IDX Fact Book 2014. Jakarta: Indonesia Stock Exchange.
The Economist Intelligence Unit. (2014). Asia Rising Wholesale and Retail. The Economist Intelligence Unit Limited.
Vernon, T. (2015, January 22). The Five Types of Angel Investors. Retrieved from Inc: http://www.inc.com Weygant, J., Kimmel, P., & Kieso, D. (2010). Accounting
Principles International Student Version / 9th Edition. New Jersey: John Wiley & Sons, Inc.
Wild, J., Larson, K., & Chiappetta, B. (2007). Fundamental Accounting Principles, 18/e. New York: McGraw-Hill.