Full Terms & Conditions of access and use can be found at
http://www.tandfonline.com/action/journalInformation?journalCode=vjeb20
Download by: [Universitas Maritim Raja Ali Haji] Date: 11 January 2016, At: 21:59
Journal of Education for Business
ISSN: 0883-2323 (Print) 1940-3356 (Online) Journal homepage: http://www.tandfonline.com/loi/vjeb20
Is Higher Better? Determinants and Comparisons
of Performance on the Major Field Test in Business
Agnieszka Bielinska-Kwapisz , F. William Brown & Richard Semenik
To cite this article: Agnieszka Bielinska-Kwapisz , F. William Brown & Richard Semenik
(2012) Is Higher Better? Determinants and Comparisons of Performance on the Major Field Test in Business, Journal of Education for Business, 87:3, 159-169, DOI: 10.1080/08832323.2011.582897
To link to this article: http://dx.doi.org/10.1080/08832323.2011.582897
Published online: 01 Feb 2012.
Submit your article to this journal
Article views: 104
View related articles
ISSN: 0883-2323 print / 1940-3356 online DOI: 10.1080/08832323.2011.582897
Is Higher Better? Determinants and Comparisons of
Performance on the Major Field Test in Business
Agnieszka Bielinska-Kwapisz, F. William Brown, and Richard Semenik
Montana State University, Bozeman, Montana, USA
Student performance on the Major Field Achievement Test in Business is an important bench-mark for college of business programs. The authors’ results indicate that such benchbench-marking can only be meaningful if certain student characteristics are taken into account. The differences in achievement between cohorts are explored in detail by separating the effect of high-achieving students choosing certain majors (characteristics effect) from the effect of the returns on these characteristics that students realize during their college educational experience (return effect).
Keywords: assessment of learning, higher education, MFT-B, standardized tests
The Major Field Achievement Test in Business (MFT-B) is a widely used learning assessment tool intended for use in schools offering undergraduate business programs. The MFT-B was administered to 132,647 individuals at 618 dif-ferent institutions between 2006 and 2009 (Educational Test-ing Service [ETS], 2009). Martell (2007) reported that in 2006, 46% of business schools used the MFT-B test in their assessment of students’ learning. The Educational Testing Service (ETS) describes the instrument’s value in the propo-sition that the test goes beyond factual knowledge measure-ment because it also evaluates students’ ability to analyze and solve problems, understand relationships, and interpret material from their major field of study. A primary motiva-tion in administering the test is to offer accrediting bodies, such as the Association to Advance Collegiate Schools of Business (AACSB), evidence that a program is fulfilling or making progress toward its stated mission.
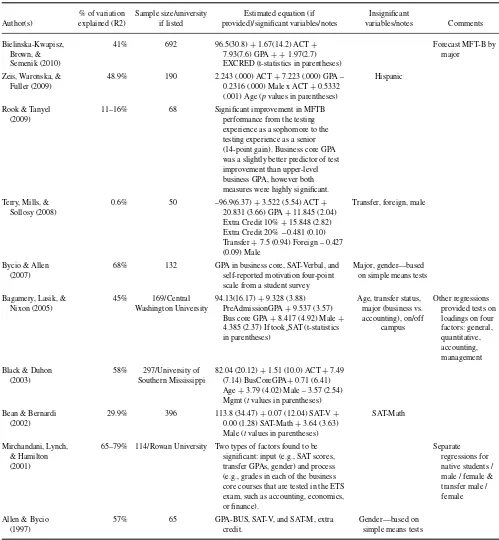
We present an empirical study that goes beyond this pri-mary application to examine other useful and necessary per-spectives of student performance on the MFT-B. First, very limited prior research has revealed that certain student char-acteristics seem to reliably predict performance on the MFT-B and we reaffirm that finding here. The state of the present research is summarized in Table 1. Compared with these previous studies, we employed a much larger data set, tested a fixed effects model, and considered differences between all business majors. Second, there is an irresistible desire
Correspondence should be addressed to F. William Brown, Montana State University, College of Business, P. O. Box 173040, Bozeman, MT 59717-3040, USA. E-mail: [email protected]
to benchmark against other business programs. However, a comparison of MFT-B scores can only be meaningful if certain student characteristics are identified and taken into account—most notably ACT scores interpreted as a proxy for general cognitive capability (Koenig, Frey, & Detterman, 2008). It seems reasonable to assume that an average MFT-B score at a particular institution is largely a function of the academic program. When comparing MFT-B mean scores across institutions, a relatively superficial interpretation may be that higher scores signal higher quality academic pro-grams. We developed and tested the proposition that compar-isons of MFT-B scores, within and across different student cohorts, can only be truly meaningful if student character-istics, most notably respective ACT scores, are taken into account. In particular, the main contribution of the present study is that we show how to separate the characteristics effect (i.e., students with higher average ACT scores are expected to have higher average MFT-B scores) from the re-turn effect (i.e., students in certain majors may be subject to a more or less efficient production function). This technique can be used within different departments to evaluate per-formance on the MFT-B for different cohorts (e.g., majors). This particular assessment has never before been done in this setting.
CONTEXT
The ETS (2009) described the MFT-B as being constructed according to specifications developed and reviewed by com-mittees of subject matter experts so as to go beyond mere factual knowledge measurement and goes on to evaluate
TABLE 1
Previous Literature on MFT-B: Major Findings
Author(s) 0.2316 (.000) Male x ACT+0.5332 (.001) Age (pvalues in parentheses)
Hispanic
Rook & Tanyel (2009)
11–16% 68 Significant improvement in MFTB performance from the testing experience as a sophomore to the testing experience as a senior (14-point gain). Business core GPA was a slightly better predictor of test improvement than upper-level 20.831 (3.66) GPA+11.845 (2.04) Extra Credit 10%+15.848 (2.82) Extra Credit 20%−0.481 (0.10) Transfer+7.5 (0.94) Foreign – 0.427 (0.09) Male
Transfer, foreign, male
Bycio & Allen (2007)
68% 132 GPA in business core, SAT-Verbal, and self-reported motivation four-point scale from a student survey
Major, gender—based 4.385 (2.37) If took SAT (t-statistics in parentheses) (7.14) BusCoreGPA+0.71 (6.41) Age+3.79 (4.02) Male – 3.57 (2.54) Mgmt (tvalues in parentheses)
Bean & Bernardi (2002)
29.9% 396 113.8 (34.47)+0.07 (12.04) SAT-V+ 0.00 (1.28) SAT-Math+3.64 (3.63) Male (tvalues in parentheses)
SAT-Math
Mirchandani, Lynch, & Hamilton (2001)
65–79% 114/Rowan University Two types of factors found to be significant: input (e.g., SAT scores, transfer GPAs, gender) and process (e.g., grades in each of the business core courses that are tested in the ETS exam, such as accounting, economics, or finance).
57% 65 GPA-BUS, SAT-V, and SAT-M, extra credit.
Gender—based on simple means tests
students’ ability to analyze and solve problems, understand relationships, and interpret material from their major field of study. The test contains 120 multiple-choice items cov-ering the common body of knowledge for undergraduate business education: accounting (15%), management (15%), economics (13%), finance (13%), marketing (13%),
qualita-tive analysis (11%), information systems (10%), legal and social environment (10%), and international considerations of modern business operations (12% overlapping with the rest). The scores range from 120 to 200 and ETS reported the mean score to be 153.1 with a standard deviation of 14.1 for 2009.
The setting for the present study is an undergraduate col-lege of business at a Carnegie Research I land grant university that has held continuous AACSB accreditation for over 25 years. The college is predominantly White, with a very small population of international and ethnic students. As part of an assessment of learning process, the college has administered the MFT-B every semester to every graduating senior since the summer semester of 2005. Students must take the test to pass the course, but it was not until the spring semester of 2008 that students received extra credit points to incent their best efforts on the MFT-B (many business programs admin-istering the MFT-B do offer some form of credit for taking the exam, as reported by Bycio & Allen, 2007). Background data identified in the research were directly obtained from student records.
THEORY AND HYPOTHESES STATEMENT
The empirical and practical values of examining the nature of MFT-B scores are obvious and compelling. However, there are theoretical considerations underlying these practical con-siderations as well. Becker and Salemi (1977) developed a general model of learning in which they specified a learning production function asY=f(A, T, S, e), whereY measures learning,A (aptitude) measures human capital,T (time in-put) measures labor time, and S (situation) characterizes the environment. Functionf is a production function andeis a random error. In the context of the present study, we mea-sured students’ aptitude or general cognitive capability by ACT scores (Koenig et al., 2008), time input and effort by grade point average (GPA) scores and extra credit offered, and situation by students’ majors and terms. As noted by Becker and Salemi, demographic variables, such as age or sex, should be included in aptitude. This theoretical model is our starting point for the empirical research. The Becker and Salemi model can be reduced to an estimable equation and the specific learning function used in this study is a linear model presented as the following:
MFT−Bikt =β0+β1ACTikt+β2GPAikt
+β3SEXikt+β4 EXCREDik+ηk+δt+εikt (1)
where MFT-Bikt is the MFT-B score of studenti in major
k in term t, ACTikt is the student’s ACT score, GPAikt is
the student’s overall GPA (we also used the GPA before students were admitted to the college but the results were very similar),SEXiktis a binary variable that takes the value
of 1 if a student is male and 0 if female,EXCREDikis a binary
variable that takes the value of 1 if a student was offered extra credit for good performance on the exam and 0 otherwise,
ηkare majors’ fixed effects,δtare academic semesters fixed
effects, and εikt is the error term. We subsequently discuss
the theoretical impact of each of the variables.
ACT
We measured student’s aptitude, general intellectual ability, and preparedness by their score on the ACT exam (or scholas-tic aptitude test [SAT] converted to ACT). ACT scores can range from 1 to 36. SAT scores have been shown to be as-sociated with higher grades from high school through col-lege (Bernardi & Bean, 1999; Bernardi & Kelting, 1997) as well as higher scores on the certified public accountant (CPA) examination (National Association of State Boards of Accountancy [NASBA], 1994). All previous research on MFT-B has found ACT and SAT scores to be positively and significantly correlated with MFT-B scores (Allen & Bycio, 1997; Bagamery, Lasik, & Nixon, 2005; Bean & Bernardi, 2002; Bielinska-Kwapisz, Brown, & Semenik, 2012; Black & Duhon, 2003; Bycio & Allen, 2007; Mirchandani, Lynch, & Hamilton, 2001; Terry, Mills, & Sollosy, 2008). Therefore, we expect general intellectual ability (as measured by ACT) to have a positive impact on performance on the MFT-B.
Hypothesis 1A (H1A): On average, ACT scores would be positively related to MFT-B scores while controlling for all other variables influencing MFT-B scores.
GPA
Higher GPA is an indicator of higher student ability and mo-tivation and, therefore, should be positively correlated with MFT-B scores. Because the MFT-B’s goal is to test general business knowledge, GPA should be the most important pre-dictor of the MFT-B performance. All previous studies have found GPA to be a significant determinant of performance on the MFT-B (Allen & Bycio, 1997; Bielinska-Kwapisz, et al., 2010; Black & Duhon, 2003; Bycio & Allen, 2007; Mirchan-dani, et al., 2001; Terry et al., 2008). Rook and Tanyel (2009) found that business core GPA was a slightly better predictor of test improvement than upper level business GPA.
H1B:On average, GPA would be positively related to MFT-B scores while controlling for all other variables influenc-ing the MFT-B scores.
Sex
Prior findings suggest that male students perform better than female students on multiple-choice exams and that female students perform better than male students on essay exam-inations. Lumsden and Scott (1987) showed that in an ex-amination that includes only multiple-choice questions, fe-male students, on average, will score 4 percentage points less than male students. Because the MFT-B is a strictly multiple-choice exam, we might expect that, on average, male students would outperform female students, keeping all other deter-minants constant. The ETS reported that the national mean score of men is 3.41 points higher than that of women (Black & Duhon, 2003). The markup for males on MFT-B was reported by Zeis, Waronska, and Fuller (2009); Bagamery
et al. (2005); Black and Duhon (2003); and Bean and Bernardi (2002). Allen and Bycio (1997) and Bycio and Allen (2007) reported no differences in MFT-B scores by sex. However, these authors performed only a simple test of differences between two cohorts without controlling for other MFT-B determinants. We expected to find a significant and positive coefficient on our SEX variable that would take the value of 1 for men and 0 for women.
H1C: On average, male students would outperform female students on the MFT-B while controlling for all other variables.
Extra Credit
Students are expected to be motivated while taking the ACT test because a good score gives them admission into a de-sirable college program. However, exit exams, such as the MFT-B, would not necessarily engender the same motiva-tion. Therefore, in many schools, students are offered ex-tra credit for good performance on the MFT-B. Terry et al. (2008), Bycio and Allen (2007), and Allen and Bycio (1997) reported an increase in the MFT-B scores when the motiva-tion to take the exam was higher. Therefore, we expected our EXCRED variable, which would take the value of 1 when extra credit is offered and 0 otherwise, to be a significant and positive determinant of performance on the MFT-B.
H1D:On average, students would perform better on the MFT-B if extra credit is offered while controlling for all other variables influencing the MFT-B scores.
Major
Because the MFT-B covers business topics specific to vari-ous majors, the performance on the test could be influenced by a students’ majors. However, because the test tries to cover basic business knowledge and tries to cover all ma-jors in equal percentages, the performance on the test should not be significantly related to a particular major. Students should perform at approximately the same level regardless of major. As noted by Allen and Bycio (1997), findings to the contrary may be indicative of an MFT-B content bias toward a particular specialty area. Black and Duhon (2003) found management students underperform compared with other majors. Allen and Bycio (1997) found significant dif-ferences between majors, but Bycio and Allen (2007) found no differences. However, in both studies by Allen and Bycio they performed only a simple analysis of variance (ANOVA) on majors and, therefore, did not control for other MFT-B determinants.
H1E:On average, a student’s major is not a significant de-terminant of performance on the MFT-B.
Educational Experience
It is widely known, that high-performing students are at-tracted to certain majors. Previous research has shown that high performers in terms of cognitive ability are more at-tracted to situations in which high performance is demanded and rewarded (Blume, Baldwin, and Rubin, [2009] and Mar-shall [2007] discussed the differences in performance among business majors). This may result in bias coefficients on ma-jors’ dummy variables in the ordinary least squares (OLS) regression. However, controlling for ACT and GPA should remedy this problem and, as stated in Hypothesis 1E, there should be no effect of a student’s major on the MFT-B score. However, if significant effects are discovered (as reported for management major in Black & Duhon, 2003) there must be other variables playing a role here. One possibility is that students are exposed to a more or less strict educational ex-perience (learning production function) depending on their majors. Therefore, students’ GPAs are not comparable be-tween different majors.
H2:Students in lower performing options would exposed to less efficient learning production function.
GENERAL DESCRIPTIVE STATISTICS
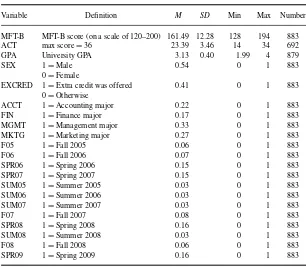
To test the previous hypotheses, we examined data for all students taking the MFT-B from summer 2005 to spring 2009. The total number of students in that population was 885 students. We have full data, most notably MFT-B and ACT scores for 692 students, primarily due to the fact that transfer students were not required to sub-mit ACT scores. In addition, for each of the 692 stu-dents, the data include university GPA measured at grad-uation, sex, major area of study (finance, accounting, man-agement, marketing), and whether the student received ex-tra credit (EXCRED) for performance achievement on the MFT-B (e.g., 5 points for a 50th percentile score, 7.5 points for 75th percentile). Table 2 displays definitions and ba-sic descriptive statistics for all of these elements. Table 3 reports simple correlations between variables from Table 2. There are no very high (±0.5) correlations between any pair of independent variables. Therefore, we believe multi-collinearity was of no consequence in the analyses.
INFLUENCES ON MFT-B SCORES
Prior research on the MFT-B has sought to identify charac-teristics of students, including ACT scores and GPAs, which predict or explain performance on the MFT-B (Table 1). How-ever, no previous study has included all majors and semester fixed effects, and our sample is also much larger. Table 4 reports the results of our basic regression analysis.
TABLE 2 Descriptive Statistics
Variable Definition M SD Min Max Number
MFT-B MFT-B score (on a scale of 120–200) 161.49 12.28 128 194 883 ACT max score=36 23.39 3.46 14 34 692 GPA University GPA 3.13 0.40 1.99 4 879
SEX 1=Male 0.54 0 1 883
0=Female
EXCRED 1=Extra credit was offered 0.41 0 1 883 0=Otherwise
ACCT 1=Accounting major 0.22 0 1 883
FIN 1=Finance major 0.17 0 1 883
MGMT 1=Management major 0.33 0 1 883
MKTG 1=Marketing major 0.27 0 1 883
F05 1=Fall 2005 0.06 0 1 883
F06 1=Fall 2006 0.07 0 1 883
SPR06 1=Spring 2006 0.15 0 1 883
SPR07 1=Spring 2007 0.15 0 1 883
SUM05 1=Summer 2005 0.03 0 1 883
SUM06 1=Summer 2006 0.03 0 1 883
SUM07 1=Summer 2007 0.03 0 1 883
F07 1=Fall 2007 0.08 0 1 883
SPR08 1=Spring 2008 0.16 0 1 883
SUM08 1=Summer 2008 0.03 0 1 883
F08 1=Fall 2008 0.06 0 1 883
SPR09 1=Spring 2009 0.16 0 1 883
Model 1.1 clearly shows that the ACT score has a huge impact on the MFT-B score, and by itself explains nearly 36% of the variation in student scores. The ACT can be argued to measure general intellectual ability and general test taking ability. As noted, high ACT explanatory power on the MFT-B was also reported in prior research.
Because the MFT-B intends to reflect general busi-ness knowledge, university GPAs should, in theory, predict MFT-B scores better than the ACT scores, but university GPAs alone explain only 22% of the variation in MFT-B scores (Model 1.2). Model 1.3 includes ACT scores and uni-versity GPAs, and explained variance rises to 41%.
A simple ANOVA for means showed significant ences between all majors’ MFT-B mean scores (the differ-ence between accounting and finance was on the edge of significance:p=.11). However, it is interesting to identify
if these differences still exist if accounting for the ACT and GPA scores. Therefore, we included majors’ dummy vari-ables in our full regression Models 2.1 and 2.2 in Table 4.
As before, we ran simple OLS regressions; however, Model 2.1 included fixed effects to control for the unob-served characteristics of the MFT-B test in a given year that cannot be directly observed. In Model 2.2, the fixed effects are replaced with a dummy variable that takes the value of 1 for the semesters when extra credit was offered (spring of 2008 through spring 2009). Dummy variables for fall 2005 and accounting majors were dropped from regressions to avoid perfect multicollinearity.
Our best model, Model 2.2 (Table 4), explains 50% of the variation in the MFT-B scores. Results indicate that high ACT and GPA are significant indicators of a good performance on the MFT-B test. On average, a 1-point higher GPA is
TABLE 3 Correlations
Variable 1 2 3 4 5 6 7 8 9
1. MFT —
2. ACT 0.60 — 3. GPA 0.49 0.49 — 4. SEX 0.14 −0.02 −0.18 — 5. ACCT 0.22 0.17 0.20 −0.13 — 6. FIN 0.24 0.10 0.03 0.15 −0.23 — 7. MGMT −0.13 −0.14 −0.08 0.11 −0.36 −0.33 — 8. MKTG −0.26 −0.09 −0.12 −0.13 −0.31 −0.28 −0.45 — 9. EXCRED 0.09 0.01 0.03 0.05 0.09 0.04 −0.12 0.00 —
TABLE 4
Regression Results, Dependent Variable=MFT-B Scores
Model 1.1 Model 1.2 Model 1.3 Model 2.1 Model 2.2
Variable t t t t t
Constant 112.02 43.9 115.92 40.2 97.20 31.0 100.49 27.9 99.32 30.2 ACT 2.11 19.6 1.67 14.1 1.49 13.3 1.50 13.5 GPA 14.56 15.9 7.99 7.6 8.46 8.3 8.50 8.5
SEX 4.24 6.0 4.33 6.2
Finance 1.76 1.6 1.67 1.5
Management −3.37 3.5 −3.63 3.8
Marketing −5.81 5.8 −5.82 5.9
EXCRED 1.29 1.9
Summer 05 0.35 0.1
Spring 06 −0.32 0.2
Summer 06 −0.53 0.2
Fall 06 −2.98 1.6
Spring 07 0.20 0.1
Summer 07 −4.44 1.8
Fall 07 −1.55 0.4
Spring 08 −0.14 0.1
Summer 08 1.05 0.4
Fall 08 1.41 0.8
Spring 09 0.80 0.5
R2 0.36 0.22 0.41 0.51 0.50 Adj.R2 0.36 0.22 0.41 0.50 0.50
N 692 879 692 692 692
associated with an MFT-B test score that is 8.5 points higher and a 1-point higher ACT score is associated with a 1.5-points higher MFT-B, controlling for all other variables. The elasticities (evaluated at sample means) of MFT-B scores with respect to GPA and ACT scores are 0.16 and 0.22, respectively. Therefore, a 10% increase in GPA increases the MFT-B score by 1.6% and a 10% increase in ACT score increases the MFT-B score by 2.2%. Thus, Hypotheses 1A and 1B were supported, with the ACT score being the most important predictor of good performance on the MFT-B. On average, male students scored 4.3 points higher on the MFT-B than did their female counterparts, supporting Hypothesis 1C (it is worth noting that female gender was positively related to GPA as reported by Rode et al., 2005). Interestingly, the results indicate scores were significantly increased once the college of business offered extra class credit for good MFT-B performance—the scores were, on average, higher by 1.3 points. Thus, Hypothesis 1D was supported. On average, marketing majors had a 5.8-point disadvantage and management majors had a 3.6-point disadvantage relative to an accounting major. Thus, Hypothesis 1E was not supported. Consequently, in the next section we investigate the reasons behind these differences between the majors and test Hypothesis 2.
The previous results are very similar to those reported in previous studies (Table 1). In particular, Black and Duhon (2003) discovered a 7.49-point increase in the MFT-B score for a 1-point higher GPA, a 1.5-point increase for a 1-point
higher ACT score, a 3.8-point advantage for men, and 3.57-point disadvantage for a management major relative to other business majors.
INTERPRETING AND COMPARING MFT-B MEAN SCORES: IS HIGHER BETTER?
It seems entirely likely that faculty, deans, constituents, and others interpret higher MFT-B scores as better. In terms of the mathematics, certainly they are higher, but are they really better?”
To parse out the dynamics of better and higher scores and to accurately interpret the nobility of any particular outcome, it seems clear that more information about how that outcome was achieved is needed. At the institutional level, the only aid in the interpretation and sense-making of means may be an ETS provided list of the 618 institutions utilizing the MFT-B and a table that allows the interpretation of a particular score in terms of the percent of institutions whose mean score is below that level. Our experience is that an examination of that list of participating institutions gives rise to various, almost always intuitive conclusions about how many peer, aspirational, and elite institutions are included and how they might have impacted the referent percentiles. It seems to us that the interpretation of an endpoint such as the MFT-B re-quires a deeper understanding of the input side. The nonavail-ability of detailed information regarding business student
TABLE 5
Selected Descriptive Statistics, by Major
Accounting Finance Management Marketing
characteristics makes comparisons across institutions very unlikely; however, multiyear experience with the MFT-B and four disciplinary (management, marketing, accounting, and finance) cohorts at the research site has provided us with an opportunity to develop a methodology for making a compar-ison and to explore the question of whether higher is better within an institution.
At the referent college of business, the mean MFT-B scores of finance and accounting students have, over time, been consistently higher than marketing and manage-ment students; a situation that anecdotal input from other institutions suggests is not atypical. But why might this be the case? Does the MFT-B have some sort of content bias that favors some disciplines over others? Are some academic programs systemically more rigorous than others? Are some faculty more skilled teachers than others? We investigated some of these questions by using a decomposition technique explained subsequently. We also investigated the role of stu-dent characteristics, the input side of the process, in deter-mining whether some scores are truly better, not just higher than others. In other words, given their characteristics and potential, did students in each of the cohorts (accounting, finance, management, and marketing) perform up to expec-tations? The answer to that question raises the intriguing possible conclusion that a relatively moderate MFT-B mean score for a cohort that met or exceeded the expectations indi-cated by their characteristics might actually represent better performance than a higher score for another cohort which fell short of indicated expectations.
One way to address the issue of performance versus expec-tations among cohorts is to examine the observed variation between majors on key student characteristics. As indicated in the previous section, student characteristics associated within a student’s major offer a fruitful perspective on the MFT-B score. Table 5 presents selective descriptive statistics by major. As previously noted, there were significant dif-ferences in MFT-B score means between all majors except accounting and finance (p=.11).
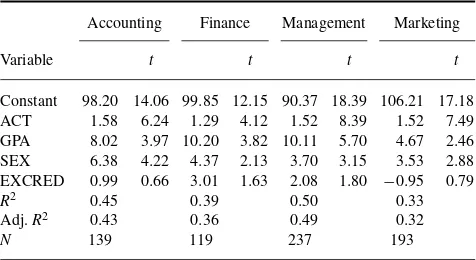
We also examined the effects of the student characteristics on MFT-B scores by regressing the explanatory variables on the individual student’s test score separately for each ma-jor. Therefore, we estimated the parameters of the following
TABLE 6
Ordinary Least Squares, by Major
Accounting Finance Management Marketing
with all other variables are defined as before, andεikis an
error term. The results are summarized in Table 6.
TheR2of the regressions indicate that about half (49%) of the variation in management majors’ MFT-B scores can be explained by student characteristics. The amount of ex-plained variation is lower for other majors, describing only 32% of the variation in marketing scores, 36% of finance scores, and 43% of accounting scores. Of these student char-acteristics, the most significant effect was observed regard-ing the ACT scores; however, finance students’ coefficient on the ACT score was slightly lower. For example, on av-erage, for accounting students, a 10% increase in their ACT scores translates into 2.3% increase in their MFT-B scores, and a 10% increase in their GPA scores translates into 1.6% increase in their MFT-B scores (elasticities evaluated at the sample means). For finance students these percentages are 1.8% and 1.9%, respectively. On average, male students score 6.38 points higher than female students in accounting, 4.37 points higher in finance, 3.7 points higher in management, and 3.53 points higher in marketing. When extra credit was offered for good performance on the MFT-B, it was signif-icant at the 10% level for management students (2.1 points higher MFT-B score) and approached the critical level for finance students (3 points higher).
To more systematically explain the test scores gap, we turned to the Oaxaca-Blinder decomposition technique (Blin-der, 1973; Oaxaca, 1973), a technique also used by Ammer-mueller (2007) to study differences in academic test scores between Finland and Germany. The Oaxaca-Blinder decom-position technique is frequently used to analyze labor market outcomes by groups (e.g., sex, race) to separate the mean wage differences into the explained and unexplained ele-ments, where the former is characterized by education or ex-perience and the latter is used as a measure for discrimination (Stanley & Jarrell, 1998; Weichselbaumer & Winter-Ebmer,
2005). The idea is to decompose mean differences between two cohorts based on regression models.
The total gap between two options is defined as a change in MFT-B scores MFT-B = MF Tki−MF Tkj, where
MF Tk is an average MFT-B test score for options i, j=
1. . .4 (1 = accounting, 2 = finance, 3 = management,
4 = marketing). The total score gap MFT-B between any two options (i.e., k1and k2) can be decomposed into three separate parts: differences in characteristics, differences in returns, and differences in characteristics-returns in the following way:
where ¯Xsare the averages of the independent variables from Equation 2: ACT, GPA, SEX, EXCRED, andβ-s are the coef-ficients estimated using Equation 2 and presented in Table 6. The first component (differences in characteristics) amounts to that part of the differential that is due to group differences in the predictors (X-es), the second component (differences in returns) measures the contribution of differences in the coefficients, and the third component is an interaction term accounting for the fact that differences in endowments and coefficients exist simultaneously between the two groups. The decomposition 3 is formulated from the viewpoint of cohort 2. The characteristics effect measures the expected change in cohort 2’s mean outcome, if cohort 2 had cohort 1’s predictor levels. The return effect measures the expected change in cohort 2’s mean outcome, if cohort 2 had cohort 1’s coefficients (Jann, 2008).
The following examples present the results of compar-isons between some options. The aim is to explain the differ-ence in the mean MFT-B scores between two options (i.e., finance and management). The average MFT-B for finance students was 168 and for management students 159 (Table 5). We wanted to explore if finance students outperformed man-agement students because of the better characteristics they have (i.e., ACT scores) or because the finance program is systematically more rigorous than the management program (a more efficient learning production function). This is the fundamental question many departments ask in evaluating their programs. The Oaxaca-Blinder decomposition lets us answer this question. For the purpose of illustration, assume that ACT score is a single predictor of the MFT-B scores. The two regression equations are estimated separately, the first for finance (MFTF =αF +βFACTF +εF) and the second
for management (MFTM=αM+βMACTM+εM) students.
Figure 1 shows the results of this simplified estimation. The left panel of the figure illustrates a simplified “return effect”. The steeper slope of management students’ learning production function indicates that management students re-ceived a higher return on the MFT-B for each additional ACT score. The point “MFT∗Mgmt” is a “counterfactual” MFT-B score, where management students have the same production
TABLE 7
The Oaxaca-Blinder Decomposition: Finance Versus Management
Variable Sum ACT GPA SEX EXCRED Constant
Total gap 9.53
Characteristics effect 3.46 2.12 0.97 0.17 0.21 9.48 Return effect −4.23 −5.25 0.28 0.43 0.32
Interaction effect −0.19 −0.32 0.01 0.03 0.09
function as finance students, given their own characteristics (Avg. ACT Mgmt score). Therefore, the MFT∗Mgmt is
cal-culated asMFT∗Mgmt=α
F +βFACTM +εM. The figure
illustrates that the return effect for management students is negative: management students would score lower on the MFT-B if they experienced the same returns as finance stu-dents given their own characteristics (ACT scores).
The figure’s right panel illustrates a simplified character-istics effect. It shows the change in the MFT-B score for management students if they have the same characteristics as finance students (ACT), given their own returns (their learn-ing production function). The figure illustrates that that the characteristics effect is positive: management students would score higher (by the distance between Avg. MFT Mgmt and MFT∗Finance) if they had the same characteristics as finance students (Avg. ACT Finance).
Turning back to our estimations for these two options, our results (presented in Table 7) indicate that if management stu-dents had the same characteristics as finance stustu-dents, they would score 3.46 points higher on the MFT-B, given manage-ment students returns (the characteristics effect is positive). This comes mostly from a difference in ACT scores between these two options and explains about 36% of the total dif-ference between these two options’ MFT-B scores. However, management students would hypothetically score 4.23 points lower (the return effect is negative) if they experienced the same returns as finance students, given their own charac-teristics (and most of it comes from the higher returns on management ACT scores). Therefore, the value added to the management students’ ACT scores is higher than the value added to finance students’ ACT scores. The return effect on finance and management students’ GPAs is very small, indi-cating that grades in both options mean similar achievement. We can conclude that management students performed up
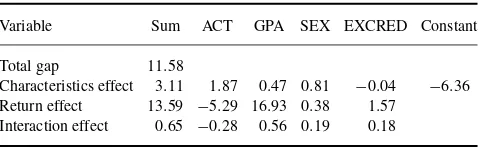
TABLE 8
The Oaxaca-Blinder Decomposition: Finance Versus Marketing
Variable Sum ACT GPA SEX EXCRED Constant
Total gap 11.58
Characteristics effect 3.11 1.87 0.47 0.81 −0.04 −6.36 Return effect 13.59 −5.29 16.93 0.38 1.57
Interaction effect 0.65 −0.28 0.56 0.19 0.18
FIGURE 1 Oaxaca-Blinder decomposition: Returns and characteristics effects.
to, or even exceeded expectations, compared with finance students and the lower MFT-B scores for this cohort comes mainly from the lower ACT scores at the start of the program. Therefore, we found no support for Hypothesis 2.
Quite different results were obtained when finance and marketing options were compared (Table 8).
As expected, if marketing students had the same character-istics as finance students, they would score 3.11 points higher on the MFT-B given marketing students’ returns. This comes mostly from a difference in ACT scores between these two options. However, marketing students would hypothetically score 13.59 points higher if they experienced the same re-turns as finance students, given their own characteristics, and most of it comes from the bigger return on their GPA. This
return effect explains most of the score gap between these two options. Therefore, a 4.0 GPA in marketing means much less achievement than a 4.0 GPA in finance (note that this was not the case when management and finance options were compared). Therefore, it appears that marketing students did not perform up to expectations because their returns on GPA were lower than expected. Therefore, we found support for our Hypothesis 2 in this instance. The interpretation would be that marketing students are not exposed to the same rigorous learning production function as finance majors.
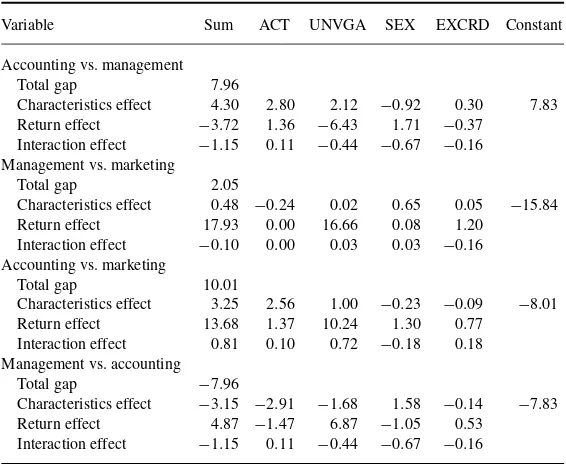
Other options can be compared in the same manner (Table 9), but from these two examples we can conclude that the support for Hypothesis 2 depends on the cohort analyzed.
TABLE 9
The Oaxaca-Blinder Decomposition
Variable Sum ACT UNVGA SEX EXCRD Constant
Accounting vs. management Total gap 7.96
Characteristics effect 4.30 2.80 2.12 −0.92 0.30 7.83 Return effect −3.72 1.36 −6.43 1.71 −0.37
Interaction effect −1.15 0.11 −0.44 −0.67 −0.16 Management vs. marketing
Total gap 2.05
Characteristics effect 0.48 −0.24 0.02 0.65 0.05 −15.84 Return effect 17.93 0.00 16.66 0.08 1.20
Interaction effect −0.10 0.00 0.03 0.03 −0.16 Accounting vs. marketing
Total gap 10.01
Characteristics effect 3.25 2.56 1.00 −0.23 −0.09 −8.01 Return effect 13.68 1.37 10.24 1.30 0.77
Interaction effect 0.81 0.10 0.72 −0.18 0.18 Management vs. accounting
Total gap −7.96
Characteristics effect −3.15 −2.91 −1.68 1.58 −0.14 −7.83 Return effect 4.87 −1.47 6.87 −1.05 0.53
Interaction effect −1.15 0.11 −0.44 −0.67 −0.16
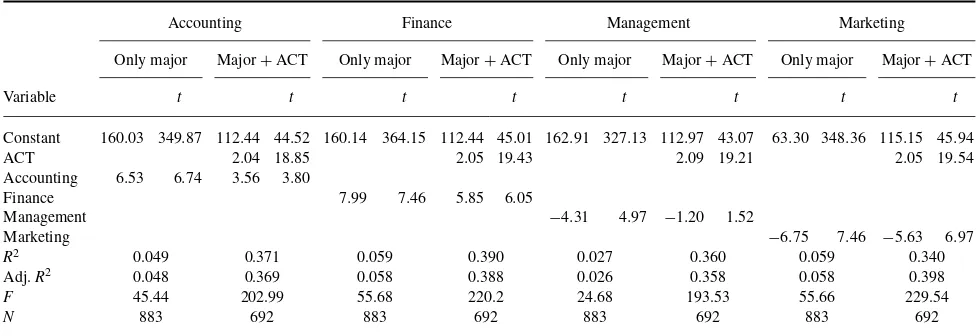
TABLE 10
The Effect of ACT on Major Dummies
Accounting Finance Management Marketing
Only major Major+ACT Only major Major+ACT Only major Major+ACT Only major Major+ACT
Variable t t t t t t t t
Constant 160.03 349.87 112.44 44.52 160.14 364.15 112.44 45.01 162.91 327.13 112.97 43.07 63.30 348.36 115.15 45.94
ACT 2.04 18.85 2.05 19.43 2.09 19.21 2.05 19.54
Accounting 6.53 6.74 3.56 3.80
Finance 7.99 7.46 5.85 6.05
Management −4.31 4.97 −1.20 1.52
Marketing −6.75 7.46 −5.63 6.97
R2 0.049 0.371 0.059 0.390 0.027 0.360 0.059 0.340
Adj.R2 0.048 0.369 0.058 0.388 0.026 0.358 0.058 0.398
F 45.44 202.99 55.68 220.2 24.68 193.53 55.66 229.54
N 883 692 883 692 883 692 883 692
The results reported in Table 9 suggest that when ences in characteristics, differences in returns, and differ-ences in characteristics-returns are examined across the four majors, the two highest scoring cohorts (accounting and fi-nance majors) received MFT-B results below the indicated expectations, the management cohort exceeded expectations, and that the lowest scoring cohort (marketing) received a score below expectations. Taking student characteristics and learning production functions into account provides a sub-stantially different interpretive framework than the use of ob-served scores alone. What we found is that a student cohort that would have been considered the lowest scoring group on the MFT-B (management students) with a simple raw score perspective turns out to have actually exceeded scoring ex-pectations given their capability characteristics. One way to interpret this result is that management students had a de-velopmental experience within the curriculum that increased their returns as evidenced by performance on the MFT-B.
To confirm our conclusions from the decomposition anal-ysis, we ran additional tests examining the dummy codes of majors with and without ACT scores as a covariate (Table 10). As expected from regressions reported in Table 4 and the decomposition analysis, the coefficients on the dummy codes for finance and accounting are higher, when included alone, and decrease but still remain significant after control-ling for the ACT. For management majors, the coefficient on the dummy variable is negative without controlling for the ACT. However, after controlling for the ACT the coef-ficient is bigger and even becomes insignificant. This is ex-pected because most of the difference between management and other majors is explained by the differences in students’ ACT scores (Tables 7 and 9). Finally, for marketing majors, the coefficient on the major dummy variable, when included alone, was negative and it stayed this way after controlling for the ACT because the difference between marketing and other majors was mainly in the production function and not in the ACT scores.
The previous tests could be performed in addition to the decomposition analysis. However, because some of the re-gressions’ explanatory powers are low, the tests should not be performed alone. Also, the decomposition let us explore the reasons behind the option changes in more detail.
CONCLUSIONS, CONTRIBUTIONS, LIMITATIONS, AND FUTURE STUDIES
In the present study, we were able to extend findings from previous studies on the MFT-B in several ways. First, we were able to use a much larger data set than prior studies, which was gathered over several years, and essentially represented a census of students taking the MFT-B within an institution. By virtue of the size and completeness of the data, it was pos-sible to offer a perspective on student characteristics which seems to reliably predict performance on the MFT-B. To the extent that MFT-B performance is considered a key perfor-mance indicator in an undergraduate business program, such a predictor model may have managerial and programmatic value. Indeed, the present analysis suggests that factors such as ACT scores and overall GPA, in fact, do predict success on the MFT-B.
Second, many business programs would like to bench-mark themselves against other business programs as a way to gain perspective on the relative sufficiency of their curricula and quality of instruction. Such benchmarking can only be meaningful if certain student characteristics are identified and taken into account—such as the effect of student ACT scores, GPAs, and motivation. We provide a unique perspective in this regard. Rather than simply conclude that an institutional or cohort MFT-B mean score higher than another necessarily represents better performance, we demonstrated a method-ological approach, which allowed simultaneous quantitative and qualitative distinctions. Our contention is that perfor-mance at expectation levels is precisely that—what was
expected. Performance above or below expectation levels create a different and more robust referent context and might properly direct attention to the academic and curricular cir-cumstances that created that outcome.
The contribution of our study lies in illustrating how co-hort performance on a standardized assessment of learning test might be analyzed and compared by considering outcome measures in the context of student characteristics, most no-tably general cognitive ability.
The focal performance metric in our study has been the MFT-B. ETS, publishers of the MFT-B, describe us-ing subject matter experts to produce the assessment tools (ETS, 2009), but provide no definitive evidence regard-ing validity—a factor that has attracted concerned attention (Allen & Bycio, 2007; Parmenter, 2007). The value of the per-formance findings, albeit not necessarily the potential value of the methodology, is of course limited by the validity of that measure.
The relatively large multiyear data set we have used has permitted certain performance comparisons within and between different cohorts at the same institution. We encourage other researchers to replicate, critique, and improve on this methodology. Our study demonstrates how intrainstitutional analysis could be of potential value to an assessment of learning processes and might provide certain management and curricular tools. Many authors have tried to assess student learning using various measures (e.g., Kuncel, Cred´e, & Thomas, 2007; Marshall, 2007; Moskal, Ellis, & Keon, 2008). Should data become available permitting comparisons of MFT-B scores across different institutions, taking student characteristics into account, meaningful com-parisons and insights about the quality of different academic programs could be even more significant for institutions. We strongly encourage this examination in future studies.
REFERENCES
Allen, J. S., & Bycio, P. (1997). An evaluation of the educational testing service major field achievement test in business.Journal of Accounting Education,15, 503–514.
Ammermueller, A. (2007). PISA: What makes the difference? Explaining the gap in test scores between Finland and Germany.Empirical Eco-nomics,33, 263–287.
Bagamery, B. D., Lasik J. J., & Nixon D. R. (2005). Determinants of success on the ETS business major field exam for students in an undergraduate multisite regional university business program.Journal of Education for Business,81, 55–63.
Bean, D. F., & Bernardi, R. A. (2002). Performance on the Major Field Test in Business: The explanatory power of SAT scores and gender.Journal of Private Enterprise,17/18, 172–178.
Becker W. E., & Salemi, M. K. (1977). The learning and cost effectiveness of AVT supplemented instruction: Specification of learning models.The Journal of Economic Education,8, 77–92.
Bernardi, R. A., & Bean, D. F. (1999). Preparer versus user introductory se-quence: The impact on performance in Intermediate Accounting I.Journal of Accounting Education,17, 141–156.
Bernardi, R. A., & Kelting, W. R. (1997). A career in public accounting: A comparison of four-year and transfer students.Accounting Educators’ Journal,9(2), 44–57.
Bielinska-Kwapisz, A., Brown, F. W., & Semenik, R. (2012). Interpreting standardized assessment test scores and setting performance goals in the context of student characteristics: The case of The Major Field Test in Business.Journal of Education for Business,87, 7–13.
Black, H. T., & Duhon, D. L. (2003). Evaluating and improving student achievement in business programs: The effective use of standardized assessment tests.Journal of Education for Business,79, 90–98. Blinder, A. (1973). Wage discrimination: Reduced form and structural
esti-mates.Journal of Human Resources,8, 436–455.
Blume, B., Baldwin, T., & Rubin, R. (2009). Reactions to different types of forced distribution performance evaluation systems.Journal of Business & Psychology,24(1), 77–91.
Bycio, P., & Allen J. S. (2007). Factors associated with performance on the Educational Testing Service (ETS) Major Field Achievement Test in Business (MFT-B).Journal of Education for Business,82, 196–201. Educational Testing Service. (2009). A guided tour of the Major
Field Tests. Retrieved from http://www.ets.org/Media/Tests/MFT/demo/ MFTdemoindex.html
Jann, B. (2008). A Stata implementation of the Blinder-Oaxaca decomposi-tion.The Stata Journal,8, 453–479.
Koenig, K. A., Frey, M. C., & Detterman, D. K. (2008). ACT and general cognitive ability.Intelligence,36, 153–160.
Kuncel, N. R., Cred´e, M., & Thomas, L. L. (2007). A meta-analysis of the predictive validity of the Graduate Management Admission Test (GMAT) and undergraduate grade point average (UGPA) for graduate student aca-demic performance.Academy of Management Learning & Education, 6(1), 51–68.
Lumsden, K. G., & Scott, A. (1987). The economics student reexamined: Male-female differences in comprehension.Research in Economic Edu-cation,18, 365–375.
Marshall, L. L. (2007). Measuring assurance of learning at the degree pro-gram and academic major levels.Journal of Education for Business,83, 101–109.
Martell, K. (2007). Assessing student learning: Are business schools making the grade?Journal of Education for Business,82, 189–195.
Mirchandani, D., Lynch, R., & Hamilton, D. (2001). Using the ETS Major Field Test in Business: Implications for assessment.Journal of Education for Business,77, 51–55.
Moskal, P., Ellis, T., & Keon, T. (2008). Summary of assessment in higher education and the management of student-learning data.Academy of Man-agement Learning & Education,7, 269–278.
National Association of State Boards of Accountancy. (1994).CPA can-didate performance on the uniform CPA examination. New York, NY: Author.
Oaxaca, R. (1973). Male-female wage differentials in urban labor markets. International Economic Review,14, 693–709.
Parmenter, D. A. (2007). Drawbacks to the utilization of the ETS Major Field Test in Business for outcomes assessment and accreditation.Proceedings of the Academy of Educational Leadership,12(2), 45–55.
Rode, J. C., Arthaud-Day, M. L., Mooney, C. H., Near, J. P., Baldwin, T. T., Bommer, W. H., et al. (2005). Life satisfaction and student performance. Academy of Management Learning & Education,4, 421–433.
Rook, S. P., & Tanyel, F. I. (2009). Value-added assessment using the Major Field Test in Business.Academy of Educational Leadership Journal,3(1), 87–94.
Stanley, T. D., & Jarrell, S. B. (1998). Gender wage discrimination bias? A meta-regression analysis.The Journal of Human Resources,33, 947–973. Terry, N., Mills, L., & Sollosy, M. (2008). Student grade motivation as a determinant of performance on the business Major Field ETS exam. Journal of College Teaching & Learning,5(7), 27–32.
Weichselbaumer, D., & Winter-Ebmer, R. (2005). A meta-analysis of the international gender wage gap.Journal of Economic Surveys,19, 479– 511.
Zeis, C., Waronska, A., & Fuller, R. (2009). Value-added program as-sessment using nationally standardized tests: Insights into internal va-lidity issues.Journal of Academy of Business and Economics,9(1), 114– 128.