Full Terms & Conditions of access and use can be found at
http://www.tandfonline.com/action/journalInformation?journalCode=vjeb20
Download by: [Universitas Maritim Raja Ali Haji] Date: 11 January 2016, At: 18:59
Journal of Education for Business
ISSN: 0883-2323 (Print) 1940-3356 (Online) Journal homepage: http://www.tandfonline.com/loi/vjeb20
What's the Best Course? Evidence From Alumni on
the Value of Business Presentations Preparation
Mary Marcel
To cite this article: Mary Marcel (2015) What's the Best Course? Evidence From Alumni on the Value of Business Presentations Preparation, Journal of Education for Business, 90:1, 10-17, DOI: 10.1080/08832323.2014.968515
To link to this article: http://dx.doi.org/10.1080/08832323.2014.968515
Published online: 06 Nov 2014.
Submit your article to this journal
Article views: 164
View related articles
What’s the Best Course? Evidence From Alumni
on the Value of Business Presentations Preparation
Mary Marcel
Bentley University, Waltham, Massachusetts, USA
Developing effective presentation skills is a core competence skill for business communicators. Self-report data from a survey of 1,610 2- to 12-year business alumni show that 37.1% present monthly and 27.9% present weekly in their current positions. Alumni who completed a general public speaking course, or both managerial communication and a public speaking course, reported higher current levels of confidence across 12 aspects of business presentations than alumni who took only a managerial communication course or who relied on embedded presentation assignments in disciplinary courses. Gains were reported for content skills since graduation, with less confidence handling nervousness and delivery.
Keywords: alumni, assurance of learning, business presentations, confidence, public speaking course
The need for assurance of learning processes has assumed central importance in business education (Rexeisen & Garrison, 2013). A new dimension, which we may call retention of learning, considers how long those skills may retain their utility postgraduation. Undergraduate business communication coursework covers a range of skills, includ-ing makinclud-ing presentations, interpersonal and group–team communication, and business writing, all of which are used by business employees (Keyton et al., 2013; Maes, Weldy, & Icenogle, 1997). But business alumni remain largely unutilized in evaluating the effectiveness and retention of presentation skills learning postgraduation, as a further step in closing the loop in assurance of learning research.
Employers view presentation skills as important. Robles (2012) found 100% of executives he surveyed listed com-munication—oral, speaking capability, written, presenting, listening—as extremely important. Stevens (2005) found that both improved oral skills and public speaking skills (general) were rated highest among the 104 Silicon Valley employers she surveyed. Winsor, Curtis, and Stephens (1997) also found top rankings for presentation skills in their study of 1,000 human resource managers. But there has been little research attempting to quantify how
frequently presentations are made in business settings, and how well our courses and other approaches are preparing graduates to deliver them.
This study investigates the frequency with which business graduates make presentations at work, and their self-assessed levels of comfort and confidence in doing so. It elicits feed-back from business alumni to assess which preparations have proven most lastingly useful in real-world work set-tings. Specifically, it compares the self-assessed effective-ness by 2- to 12-year busieffective-ness alumni of (a) a general public speaking course offered by a humanities department, (b) a managerial communications course offered by a business communication department, (c) both courses, or (d) a com-munication across the curriculum (CAC) approach involving presentations embedded in business courses.
LITERATURE REVIEW
A wide range of communication skills has been referenced by both professionals and academics as important for the optimal development of communication competence. Along with presentation skills, these include interpersonal, or one-on-one oral communication; group and team com-munication; meeting facilitation; and business writing. Sur-veys of business communication or managerial communication courses indicate that all these areas tend to be covered by such courses (Knight, 1999; Laster & Russ,
Correspondence should be addressed to Mary Marcel, Bentley Univer-sity, Department of Information Design and Corporate Communication, 175 Forest Street, Waltham, MA 02452, USA. E-mail: mmarcel@bentley. edu
ISSN: 0883-2323 print / 1940-3356 online DOI: 10.1080/08832323.2014.968515
2010; Morreale, Worley, & Hugenberg, 2010; Russ, 2009; Smith & Turner, 1993; Sharp & Brumberger, 2013; Tread-well & Applbaum, 1996; Wardrope & Bayless, 1999; Winsor et al., 1997).
There are also other pathways by which undergraduate business students can develop their competence as present-ers. Many colleges and universities offer general public speaking courses (Morreale et al., 2010). Less frequently to be found are undergraduate business major programs which require a discipline-specific communication course, such as in accounting, information systems or finance (Alshare, Lane, & Miller, 2011; Argenti, 1986). Communication Across the Curriculum approaches have also been deployed (Tuleja & Greenhalgh, 2008; Dannels, 2001).
One aspect of presenting, public speaking anxiety, has been well studied in undergraduates (Ayres & Ayres Sonandre, 2002; Dwyer, 2000; Elias, 1999; Ellis, 1995; Hsu, 2009; Hunter, Westwick, & Haleta, 2014; Lucchetti, Phipps, & Behnke, 2003; MacIntyre, Babin, & Clement, 1999; McCroskey, 2009; McKinney, 2009; Stanga & Ladd, 1990). But we know little about the persistence of this phe-nomenon in business graduates’ working careers. Fordham and Gabbin (1996) found that levels of communication apprehension did not substantially decrease between sopho-more and senior years despite business students having taken a communication course. Borzoi and Mills (2001) found that communication apprehension in upper level accounting students exceeded that of other majors. Hodis, Bardhan, and Hodis (2010), however, found increases in willingness to communicate over a semester-long under-graduate public speaking course. The relevant question con-cerns anxiety levels postgraduation, where the incentives of a real-life work situation could change graduates’ willing-ness to communicate. Thus an alumni study potentially answers questions about the persistence of findings con-cerning undergraduates’ anxiety and willingness to commu-nicate into the early career.
Beyond these studies, little research has been devoted to questions of how well the alumni of undergraduate business programs feel they are faring with respect to their overall presentation skill set postgraduation. Homer Cox (1976) surveyed a group of alumni from the University of Colo-rado, Southern Illinois University at Edwardsville, and Bowling Green State University who had taken a business communication course, but his results centered on writing. Thaddeus McEwen (1998) surveyed 82 managers who had graduated from a public Midwestern university. He found no correlation at all between level of business education (none, bachelor’s, or master’s degree) and communication competence. His respondents reported being weakest in public speaking competence, but McEwen did not correlate competence with prior course work. More recent surveys of alumni have not been reported. Thus, while research on what business communication courses do and should include have queried educators, business professionals and
business press (Keyton et al., 2013; Waldek, Durante, Hel-muth, & Marcia, 2012; Ulinski & O’Callahan, 2002; Wardrope, 2002; Peterson, 1997; Reinsch & Shelby, 1997; Waner, 1995), alumni of existing courses represent an underutilized source of information regarding the frequency of their actual use of this skill set, and the usefulness and effectiveness of their presentation preparation vis-a-vis their self-perceived levels of confidence in presenting once they have entered their careers.
One final rationale for conducting research on alumni has to do with assurance of learning and retention of learn-ing concerns. These include requirements for institutional accreditation, as well as optimizing long-term formation of students’ capacities to learn, perform, and reflect on practi-ces which they study as undergraduates (Hunter, Westwick, & Haleta, 2014; Rexeisen & Garrison, 2013; Marshall, 2007; Martell, 2007). To date, research on retention of learning effects has focused on enrolled students. Zhao and Alexander (2004) assessed the performance of a cohort of students during their sophomore- and senior-year business courses who had taken a comprehensive business communi-cation course as sophomores. They found that, while stu-dents benefited in their self-assessed skill development and grade outcomes across a variety of measures, the positive effects of the second-year course lessened over time. Since all business students at the university were required to take both courses, a blind comparison with a cohort of students who did not take the sophomore course was not possible. Marcal, Hennessey, Curren, and Roberts (2005) found that completing a communications course prior to taking a junior-level marketing course was associated with higher grades in the course, even when other factors such as prior GPA, age, socioeconomic status and major were controlled for. Kerby and Romine (2009) used a case-study of embed-ded oral presentation instruction and assessment in three levels of accounting courses, and found improvement in oral presentation competency over time. Hunter, Westwick, and Haleta (2014) found that a wide range of majors decreased in public speaking anxiety over the semester of a public speaking course. But these effects were measured during the undergraduate program. So while the results have been mixed for research conducted on business under-graduate students, outcomes have not been studied over an extended period of time for retention postgraduation.
STUDY DESIGN
This study surveyed bachelor’s degree graduates of business departments from a private New England university from 2002–2012 who had taken (a) a general public speaking course offered by the English department, COM 210; (b) a managerial communications course offered by a business communication department, IDCC 320; (c) both these two courses; or (d) no course which focused on presentations,
VALUE OF BUSINESS PRESENTATIONS PREPARATION 11
business or otherwise, while they were undergraduates. Data were collected between July and September 2013.
The number of individual presentations varies suffi-ciently between the two courses to create a meaningful dif-ference in focus. Based on a review of syllabi for these courses, COM 210 sections ranged between five and six individual graded presentations per semester for the years studied. IDCC 320 sections, by contrast, ranged from one to three individual presentations per semester, since this course is also required to offer the other traditional ele-ments of business or managerial communication, including business writing, group communication, meeting facilita-tion, and interpersonal communication.
All students at this university are required to take two com-munication intensive (CI) courses as part of their bachelor’s degree program: one from among their general education courses and one within their major. These courses, which rep-resent one aspect of a university-wide CAC approach, are reviewed by a faculty committee, and must include explicit instruction in writing and/or presenting elements, the ratio of which is determined by the offering faculty and/or depart-ment. In addition, many general business and business major courses require oral presentations, often by groups. Thus, while some students take one or both courses, no student in a business discipline would graduate without some exposure to presentations pedagogy or practice. But among non–course takers, there is wide variation in how much instruction on oral presentations was received, and how much individual pre-senting each student may do. For example, some CI courses focus on writing or interpersonal communication. In classes requiring presentations, each member of the team may not be required to actually speak in a group presentation, resulting in uneven levels of assured learning.
This study encompassed alumni who completed the fol-lowing undergraduate majors: Accountancy (AC); Accounting Information Systems; Computer Science (CS); Economics and Finance (ECOFI); Finance (FI); Corporate Finance and Accounting (CFA); Information Design and Corporate Communication (IDCC); Management (MG); Marketing (MK); Managerial Economics; and Arts and Sci-ences (A&S) majors. The registrar supplied the list of stu-dents who met the study’s requirements, totaling 7,858 names. Of these, 571 international students were removed from the list, for a separate study underway involving these
and additional questions concerning English as a second or other language (ESOL) issues. Of the remaining list, the alumni relations office provided current email addresses for 5,478 names. The relationship between the original list and the email list is reflected in Table 1. The AC/FI group includes CFA as well as ECOFI, while the IDCC/MG/MK group also includes managerial economics. The proportion of alumni receiving emails tracks at approximately 70% for all groups of majors.
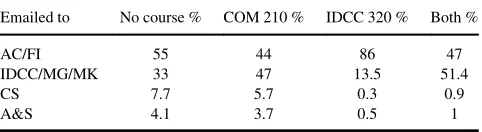
Among the alumni targeted for the study, two majors are required to complete one of the two courses being studied. The CFA is required to take IDCC 320 as a major course, and IDCC majors are required to take COM 210 as a major course. Thus, within the IDCC 320 respondent cohort, 80.8% of the sample is comprised of CFA majors, while within the COM 210 cohort, 6.6% comprised IDCC majors. CFA and IDCC majors therefore are underrepresented in the no course samples. Otherwise, there are no structural skews in students’ self-selection into or out of these courses. The percentages are captured in Table 2.
The survey was conducted via email using Qualtrics (Qualtrics, LLC, Provo, UT) survey software. Minimum response rates were calculated based on the expected eligi-ble percentage of respondents, excluding those not cur-rently employed, using the unemployment rate for recent business graduates of 7.4% found by Carnevale and Cheah (2013). Required minimum completed responses were cal-culated using Cochran’s rules for both continuous and cate-gorical data collection, as Likert-type scales were employed and different course-taking populations would be compared (Bartlett, Kotrlik, & Higgins, 2001). Given the somewhat lower expected response rates to email surveys
TABLE 1
Population and Email Samples
Major groups Populationn Surveys sentn Email as % of population Respondentsn Email response rate
AC/FI 4335 3022 69.4 842 27.9
IDCC/MG/MK 2845 2003 70.4 645 32.2
CS 400 284 71 66 23.2
A&S 278 167 60.1 57 34.13
Total 7858 5476 69.7 1,610 29.4
Note:AC/FI: Accounting/Finance; IDCC/MG/MK: Information Design and Corporate Communications/Managmenet/Marketing; CS: Computer Science; A&S: Arts and Sciences.
TABLE 2
Emails by Course and Major Group
Emailed to No course % COM 210 % IDCC 320 % Both %
AC/FI 55 44 86 47
IDCC/MG/MK 33 47 13.5 51.4
CS 7.7 5.7 0.3 0.9
A&S 4.1 3.7 0.5 1
Note:AC/FI: Accounting/Finance; IDCC/MG/MK: Information Design and Corporate Communications/Managmenet/Marketing; CS: Computer Science; A&S: Arts and Sciences.
in general (Kaplowitz, Hadlock, & Levina, 2004), one addi-tional step was taken to address possible nonrespondent bias (see Table 3). We performedt-tests comparing overall grade point averages (GPAs) of respondents and nonres-pondents by course group. The average overall GPA for all respondents was 3.12, while for all nonrespondents it was 3.41. Differences were statistically significant for COM 210 and no course takers atp<.05 but not for IDCC 320 course takers.
RESULTS
Respondents were 52% women and 48% men, which dif-fered from the university’s undergraduate population for the years studied. From 2002–2012, the female to male ratio was approximately 40:60 for undergraduates, so these numbers represent a disproportionate female response rate. Age-wise, 42% were 26 years old or younger, 36% were 27–30 years old, and 22% were 31 years old or older.
By course group, responses reached the numbers required according to Bartlett et al. (2001) for a .03 margin of error for continuous data and a .05 margin of error for categorical data. For all course groups, for continuous data, the alpha value achieved was .01,tD2.58. For categorical data, the no course and COM 210 groups achievedpD2.58 andpD.5, respectively. For the IDCC 320 cohort, categor-ical data reached p D.5, t D 1.96. For the both courses cohort for categorical data, we are slightly under (by four of 222 needed) to reachpD.5,tD1.96. These differential response rates were noted in order to better assess the
possible effects of major choice on outcomes (No€el, Michaels, & Levas, 2003).
Frequency of Presenting
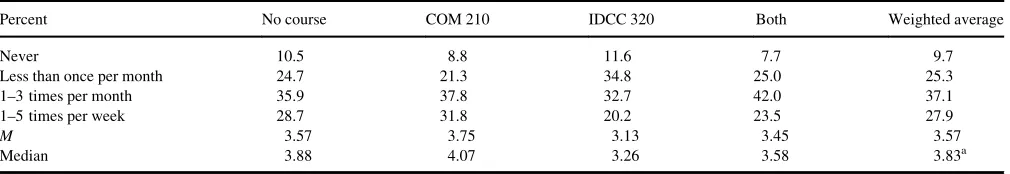
Respondents were asked how often they present. Weighted averages were calculated using a 7-point scale ranging from 1 (never) to 7 (daily). Table 4 shows that a weighted average of 9.7% of respondents reported never making sentations in their current position, and 25.3% making pre-sentations less than once per month. Of the remaining respondents, 37.1% reported presenting 1–3 times per month, and about 27.9% doing so 1–5 times per week. The weighted average was 3.57, which equates to 1–3 times per month. The weighted median was somewhat higher, 3.83, but still fell within the 1–3 times per month range of self-reports.
Regarding the different organization levels to which they present, about 92% reported presenting to persons above their level; 62% to below their level; and 81% to their same level.
Confidence in Presenting
Using a 12-item instrument and a 5-point Likert-type scale, all respondents were asked to assess their current levels of comfort and confidence in presenting at work. The 12 items were derived from the syllabi teaching objectives for COM 210 and IDCC 320 as they relate to presentations. They incorporate the elements of the Competent Speaker Speech Evaluation Form (Morreale, 1990), with some additional
TABLE 3
Response Rates by Major and Course Group
No course (nD548) COM 210 (nD581) IDCC 320 (nD264) Both courses (nD218) Overall (ND1,611) Major group Major group % of responses % of responses % of responses % of responses % of responses as % of sample
AC/FI 52.72 43.42 81.85 38.08 52.2 55.2
IDCC/MG/MK 35.39 47.89 17.38 59.17 40.2 36.6
CS 6.75 4.47 0.38 0.92 4.0 5.2
A&S 4.56 4.47 0.38 1.38 3.4 3.1
Note:AC/FI: Accounting/Finance; IDCC/MG/MK: Information Design and Corporate Communications/Managmenet/Marketing; CS: Computer Science; A&S: Arts and Sciences.
TABLE 4
Respondents’ Frequency of Presentations
Percent No course COM 210 IDCC 320 Both Weighted average
Never 10.5 8.8 11.6 7.7 9.7
Less than once per month 24.7 21.3 34.8 25.0 25.3
1–3 times per month 35.9 37.8 32.7 42.0 37.1
1–5 times per week 28.7 31.8 20.2 23.5 27.9
M 3.57 3.75 3.13 3.45 3.57
Median 3.88 4.07 3.26 3.58 3.83a
a
Weighted median.
VALUE OF BUSINESS PRESENTATIONS PREPARATION 13
categories. The 5-point Likert-type scale ranged from 1 (not at all comfortable and not very confident) to 5 (very com-fortable and confident). Table 5 shows that alumni who took both courses exceeded the average in eight categories, as did COM 210 course takers. Both IDCC 320 and no course takers exceeded the average in only two.
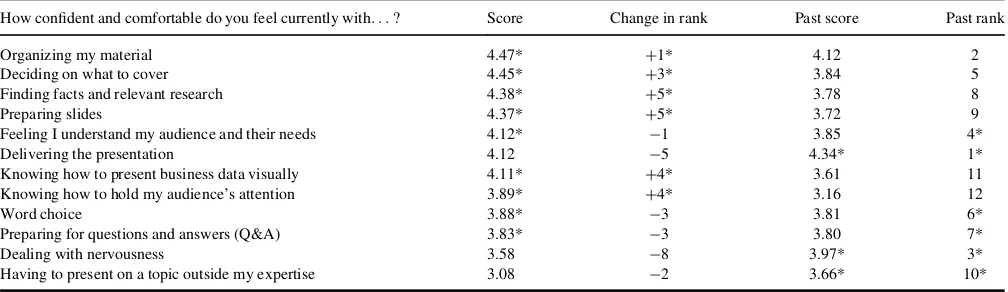
The same Likert-type scale asked respondents in the COM 210, IDCC 320, and both course groups to assess how well the courses in question had prepared them to make effective business presentations immediately upon graduation (past). When weighted average scores for both sets of results are rank-ordered, Table 6 reveals some disparities.
Across all three course-taking cohorts, based on rank ordering, course alumni reported greatest gains in confi-dence in (a) finding relevant facts and research, (b) prepar-ing slides, (c) knowprepar-ing how to present business data visually, (d) knowing how to hold their audience’s atten-tion, (e) deciding what to cover, and (f) organizing their material. On the other hand, alumni reported lower levels of confidence regarding (a) delivering the presentation, (b)
dealing with nervousness, (c) feeling that they understand their audience, (d) word choice, (e) preparing for Q&A, and (f) having to present on topics outside their expertise.
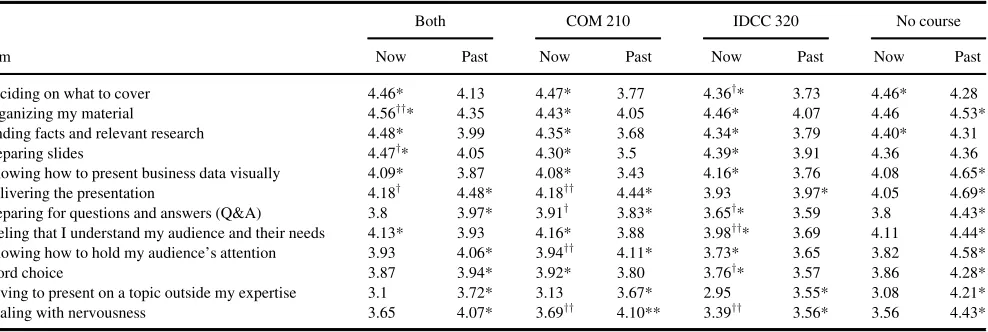
In terms of learning retention, Table 7 shows gains and losses for course takers versus alumni who took no course (s). Statistically significant gains were made in organizing, preparing slides and delivery by both course takers. COM 210 course takers made significant gains in delivery, hold-ing the audience’s attention, preparhold-ing for Q&A, and deal-ing with nervousness compared to present self-assessments by no course takers. By the same token, IDCC 320 course takers significantly lagged the no course group currently in deciding what to cover, preparing for Q&A, understanding their audience, and word choice.
DISCUSSION
In answering the primary research questions, we come to some interesting conclusions. Early-career business under-graduates report making presentations with sufficient
TABLE 5
How Confident and Comfortable Do You Feel in These Aspects?
Item
No course (nD546)
IDCC 320 (nD267)
COM 210 (nD581)
Both (nD219)
Average (ND1,613)
Deciding on what to cover 4.46* 4.36 4.47* 4.46* 4.45
Organizing my material 4.46 4.46 4.43 4.56* 4.46
Finding facts and relevant research 4.40* 4.34 4.35 4.48* 4.38
Preparing slides 4.36 4.39* 4.30 4.47* 4.36
Knowing how to present business data visually 4.08 4.16* 4.08 4.09 4.09 Delivering the presentation 4.05 3.93 4.18* 4.18* 4.09 Preparing for questions and answers (Q&A) 3.80 3.65 3.91* 3.80 3.81 Feeling that I understand my audience and their needs 4.11 3.98 4.16* 4.13 4.11 Knowing how to hold my audience’s attention 3.82 3.73 3.94* 3.93* 3.86
Word choice 3.86 3.76 3.92* 3.87 3.87
Having to present on a topic outside my expertise 3.08 2.95 3.13* 3.10* 3.08
Dealing with nervousness 3.56 3.39 3.69* 3.65* 3.57
Note:*indicates that the value exceeds the average.
TABLE 6
Current Levels Compared to Past at Time of Class for Course Takers
How confident and comfortable do you feel currently with. . .? Score Change in rank Past score Past rank
Organizing my material 4.47* C1* 4.12 2
Deciding on what to cover 4.45* C3* 3.84 5
Finding facts and relevant research 4.38* C5* 3.78 8
Preparing slides 4.37* C5* 3.72 9
Feeling I understand my audience and their needs 4.12* ¡1 3.85 4*
Delivering the presentation 4.12 ¡5 4.34* 1*
Knowing how to present business data visually 4.11* C4* 3.61 11 Knowing how to hold my audience’s attention 3.89* C4* 3.16 12
Word choice 3.88* ¡3 3.81 6*
Preparing for questions and answers (Q&A) 3.83* ¡3 3.80 7*
Dealing with nervousness 3.58 ¡8 3.97* 3*
Having to present on a topic outside my expertise 3.08 ¡2 3.66* 10*
Note:*indicates higher values.
frequency to make this skill set important: 37.1% make pre-sentations 1–3 times per month, while a separate 27.9% present 1–5 times per week. Thus 65% of respondents are presenting on a monthly to weekly basis. This finding con-firms the centrality of the presentation skill set, across all business majors studied.
In terms of the most lasting and effective preparation route, those reporting the highest levels of confidence in eight of 12 categories were alumni who took the basic pub-lic speaking course. Those who took both courses supersede the no course group in 10 of 12 categories. This suggests, overall, that the groups who took both courses and those who took COM 210 alone have fared better, in terms of their self-rated comfort and confidence levels, than the no course group. However, the latter have fared better than the IDCC 320 group, who self-rated the lowest of all four groups in every category except preparing slides and having to present on a topic outside their expertise.
Investigating specific levels of communication anxiety and their correlation to current confidence levels was beyond the scope of this survey. But decision-tree analysis revealed that there was no statistically significant relation-ship among undergraduate major and current levels of con-fidence in presenting in terms of the full scale. Thus for alumni, the relationship between their specific major and public speaking anxiety, which has been identified as sig-nificant in some studies on undergraduates, may be moder-ated over time.
A final consideration concerns the study population itself, who entered their business studies in the first semes-ter of their first year, and whose SAT scores and family incomes are above national averages. Per Elias (1999), it would be useful to compare these findings with alumni from large state-supported universities, and who came from
a more diverse range of precollege preparations. A current study is underway to assess possible effects of ESOL on building durable presentation skills.
CONCLUSIONS
The results of this study show that alumni two to 12 years out present frequently enough to warrant pedagogical atten-tion to developing this skill set. Those who took the general education public speaking or both that class (COM 210) and the managerial communication class (IDCC 320) fared better in terms of their current self-reported confidence levels than those who took the managerial communication class alone or who took no course at all. Across all majors, the greatest gains in confidence relative to levels at graduation occurred in the areas of organizing material, finding supporting data, presenting business data visually, and understanding audi-ences’ needs. The greatest losses in confidence occurred in terms of delivering the speech, handling nervousness, prepar-ing for questions and answers, and word choice. Thus while some business experience skills improved, self-management skills declined, suggesting the need for increased attention in these areas for all business majors.
It appears, then, that alumni of all majors studied who took coursework dedicated to improving their presentation skills did indeed reap the greatest and longest-lasting rewards, in terms of their self-reported levels of confidence and comfort across 12 dimensions of making business pre-sentations. In seeking to achieve a range of communication objectives in a managerial communication course, includ-ing writinclud-ing and interpersonal skills, we should not lose sight of the lasting benefits of instruction and graded perfor-mance in presenting.
TABLE 7
Comparison of Means of Gains and Losses: Course Takers Versus Non–Course Takers
Both COM 210 IDCC 320 No course
Item Now Past Now Past Now Past Now Past
Deciding on what to cover 4.46* 4.13 4.47* 3.77 4.36y* 3.73 4.46* 4.28 Organizing my material 4.56yy* 4.35 4.43* 4.05 4.46* 4.07 4.46 4.53* Finding facts and relevant research 4.48* 3.99 4.35* 3.68 4.34* 3.79 4.40* 4.31 Preparing slides 4.47y* 4.05 4.30* 3.5 4.39* 3.91 4.36 4.36 Knowing how to present business data visually 4.09* 3.87 4.08* 3.43 4.16* 3.76 4.08 4.65* Delivering the presentation 4.18y 4.48* 4.18yy 4.44* 3.93 3.97* 4.05 4.69* Preparing for questions and answers (Q&A) 3.8 3.97* 3.91y 3.83* 3.65y* 3.59 3.8 4.43* Feeling that I understand my audience and their needs 4.13* 3.93 4.16* 3.88 3.98yy* 3.69 4.11 4.44* Knowing how to hold my audience’s attention 3.93 4.06* 3.94yy 4.11* 3.73* 3.65 3.82 4.58* Word choice 3.87 3.94* 3.92* 3.80 3.76y* 3.57 3.86 4.28* Having to present on a topic outside my expertise 3.1 3.72* 3.13 3.67* 2.95 3.55* 3.08 4.21* Dealing with nervousness 3.65 4.07* 3.69yy 4.10** 3.39yy 3.56* 3.56 4.43*
Note:*indicates higher values.
y
pD.10.yypD.05.
VALUE OF BUSINESS PRESENTATIONS PREPARATION 15
REFERENCES
Alshare, K. A., Lane, P. L., & Miller, D. (2011). Business communication skills in information systems (IS) curricula: Perspectives of IS educators and students.Journal of Education for Business,86, 186–194. Argenti, P. (1986). Advanced management communication: An elective
course in corporate communication.The Journal of Business Communi-cation,23(4), 69–73.
Ayres, J., & Ayres Sonandre, D. (2002). The Stroop test for public speak-ing apprehension: Validity and reliability. Communication Research Reports,19, 167–174.
Bartlett, J. E. II, Kotrlik, J. W., & Higgins, C. C. (2001). Organizational research: Determining appropriate sample size in survey research. Infor-mation Technology, Learning and Performance Journal,19, 43–50. Borzoi, M. G., & Mills, T. H. (2001). Communication apprehension in
upper level accounting students: An assessment of skill development.
Journal of Education for Business,76, 193–198.
Carnevale, A. P., & Cheah, B. (2013).Hard times: College majors, unem-ployment and earnings. Washington, DC: Georgetown University Public Policy Institute. Retrieved from http://www9.georgetown.edu/grad/gppi/ hpi/cew/pdfs/HardTimes.2013.2.pdf
Cox, H. (1976). The voices of experiences: The business communication alumnus reports.The Journal of Business Communication,13(4), 35–46. Dannels, D. (2001). Taking the pulse of communication across the curricu-lum: A view from the trenches.Journal of the Association for Communi-cation Administration,30, 50–70.
Dwyer, K. K. (2000). The multidimensional model: Teaching students to self-manage high Communication Apprehension by self-selecting treat-ments.Communication Education,49, 72–81.
Elias, R. Z. (1999). An examination of nontraditional accounting students’ communication anxiety and ambiguity tolerance.Journal of Education for Business,75, 38–41.
Ellis, K. (1995). Apprehension, self-perceived competency, and teacher immediacy in the laboratory-supported public speaking course: Trends and relationships.Communication Education,44, 64–77.
Fordham, D. R., & Gabbin, A. L. (1996). Skills versus apprehension: Evi-dence on oral communication.Business Communication Quarterly,59
(3), 88–97.
Hodis, G. M., Bardhan, N. R., & Hodis, F. A. (2010). Patterns of change in willingness to communicate in public speaking contexts: A latent growth modeling analysis.Journal of Applied Communication Research,38, 248–267.
Hsu, C.-F. (2009). The relationships of trait anxiety, audience nonverbal feedback, and attributions to public speaking state anxiety. Communica-tion Research Reports,26, 237–246.
Hunter, K. M., Westwick, J. N., & Haleta, L. L. (2014). Assessing success: The impacts of a fundamentals of speech course on decreasing public speaking anxiety.Communication Education,63, 124–135.
Kaplowitz, M. D., Hadlock, T. D., & Levina, R. (2004). A comparison of web and mail survey response rates. Public Opinion Quarterly, 68, 94–101.
Kerby, D., & Romine, J. (2009). Develop oral presentation skills through accounting curriculum design and course-embedded assessment. Jour-nal of Education for Business,85, 172–179.
Keyton, J., Caputo, J. A., Ford, E. A., Fu, R., Leibowitz, S. A., Liu, T.,. . . Wu, C. (2013). Investigating verbal workplace communication behav-iors.The Journal of Business Communication,50, 152–169.
Knight, M. (1999). Writing and other communication standards in undergraduate business education: A study of current program requirements, practices, and trends.Business Communication Quar-terly,62, 10–28.
Laster, N. M., & Russ, T. L. (2010). Looking across the divide: Analyzing cross-disciplinary approaches for teaching business communication.
Business Communication Quarterly,73, 248–264.
Lucchetti, A. F., Phipps, G. L., & Behnke, R. R. (2003). Trait anticipatory public speaking anxiety as a function of self-efficacy expectations and self-handicapping strategies. Communication Research Reports, 20, 348–356.
Maclntyre, P. D., Babin, P. A., & Clement, R. (1999). Willingness to com-municate: Antecedents and consequences.Communication Quarterly,
47, 215–229.
Maes, J. D., Weldy, T. G., & Icenogle, M. L. (1997). A managerial perspective: Oral communications competency is most important for business students in the workplace.The Journal of Business Com-munication,34, 67–80.
Marcal, L. H., Hennessey, J. E., Curren, M. T., & Roberts, W. W. (2005). Do business communication courses improve student performance in Introductory Marketing? Journal of Education for Business, 80, 289–294.
Marshall, L. L. (2007). Measuring assurance of learning at the degree pro-gram and academic major levels.Journal of Education for Business,83, 101–109.
Martell, K. (2007). Assessing student learning: Are business schools mak-ing the grade?Journal of Education for Business,82, 187–195. McCroskey, J. C. (2009). Communication apprehension: What have we
learned in the last four decades.Human Communication: A Publication of the Pacific and Asian Communication Association,12, 157–171. McEwen, T. (1998). The impact of type and level of college degree on
managerial communication competence.Journal of Education for Busi-ness,73, 352–358.
McKinney, B. C. (2009). Communication apprehension in Asia.Asian Profile,37, 201–207.
Morreale, S. P. (1990, November).The competent speaker. Paper presented at the Speech Communication Association Conference on Assessment of Communication Competency, Denver, CO.
Morreale, S. P., Worley, D. W., & Hugenberg, B. (2010). The basic com-munication course at two- and four-year U.S. colleges and universities: Study VIII: The 40th anniversary. Communication Education, 59, 405–430.
No€el, N. M., Michaels, C., & Levas, M. G. (2003). The relationship of per-sonality traits and self-monitoring behavior to choice of business major.
Journal of Education for Business,78, 153–157.
Peterson, M. S. (1997). Personnel interviewers’ perceptions of the impor-tance and adequacy of applicants’ communication skills. Communica-tion EducaCommunica-tion,46, 287–291.
Reinsch, N. L. Jr., & Shelby, A. N. (1997). What communication abilities do practitioners need? Evidence from MBA students.Business Commu-nication Quarterly,60, 7–29.
Rexeisen, R. J., & Garrison, M. J. (2013). Closing the loop in assurance of learning programs: Current practices and future challenges.Journal of Education for Business,88, 280–285.
Robles, M. M. (2012). Executive perceptions of the top 10 soft skills needed in today’s workplace.Business Communication Quarterly,75, 453–465.
Russ, T. L. (2009). The status of the business communication course at U.S. colleges and universities.Business Communication Quarterly,72, 395–413.
Sharp, M. R., & Brumberger, E. R. (2013). Business communication cur-ricula today: Revisiting the top 50 undergraduate business schools. Busi-ness Communication Quarterly,76(1), 5–27.
Smith, J. H., & Turner, P. H. (1993). A survey of communication depart-ment curriculum in four-year colleges and universities.Journal of the Association for Communication Administration,1, 34–49.
Stanga, K. G., & Ladd, R. T. (1990). Oral Communication Apprehension in beginning accounting majors: An exploratory study. Issues in Accounting Education,6, 180–199.
Stevens, B. (2005). What communication skills do employers want? Silicon Valley recruiters respond.Journal of Employment Counseling,42, 2–9.
Treadwell, D., & Applbaum, R. (1996). The basic course in organizational communication: A national survey.Journal of the Association for Com-munication Administration,1, 12–24.
Tuleja, E. A., & Greenhalgh, A. M. (2008). Communicating across the cur-riculum in an undergraduate business program: Management 100- Lead-ership and communication in groups. Business Communication Quarterly,71(1), 27–43.
Ulinski, M., & O’Callaghan, S. (2002). A comparison of MBA students’ and employers’ perceptions of the value of oral communi-cation skills for employment.Journal of Education for Business,77, 193–197.
Waldeck, J., Durante, C., Helmuth, B., & Marcia, B. (2012). Communica-tion in a changing world: Contemporary perspectives on business com-munication competence. Journal of Education for Business, 87, 230–240.
Waner, K. K. (1995). Business communication competencies needed by employees as perceived by business faculty and business professionals.
Business Communication Quarterly,58(4), 51–56.
Wardrope, W. J. (2002). Department chairs’ perceptions of the importance of business communication skills.Business Communication Quarterly,
65(4), 60–72.
Wardrope, W. J., & Bayless, M. L. (1999). Content of the business commu-nication course: An analysis of the coverage.Business Communication Quarterly,62(4), 33–40.
Winsor, J. L., Curtis, D. B., & Stephens, R. D. 1997. National preferences in business communication education: A survey update.Journal of the Association for Communication Administration,3, 170–179.
Zhao, J. J., & Alexander, M. W. (2004). The impact of business communi-cation educommuni-cation on students’ short- and long-term performances. Busi-ness Communication Quarterly,67, 24–40.
VALUE OF BUSINESS PRESENTATIONS PREPARATION 17