M
otion planning is a key problem in robotics that is concerned with finding a path that satisfies a goal specification subject to constraints. In its simplest form, the solution to this problem consists of finding a path connecting two states, and the only constraint is to avoid collisions. Even for this version of the motion planning prob-lem, there is no efficient solution for the general case [1]. The addi-tion of differential constraints on robot moaddi-tion or more general goal specifications makes motion planning even harder. Given itscom-plexity, most planning algorithms forego completeness and optimal-ity for slightly weaker notions such as resolution
completeness, probabilistic completeness [2], and asymptotic optimality.
Comparing Planning Algorithms Sampling-based planning algorithms
are the most common probabilisti-cally complete algorithms and are
widely used on robot platforms with many degrees of freedom. Within this class of
algo-rithms, many variants have been proposed over the last 20 years, yet there is still no characterization of which al-gorithms are well-suited for which classes of problems. We present a benchmarking infrastructure for motion plan-ning algorithms that can be a useful component for such a char-acterization. The infrastructure is aimed both at end users who want to se-lect a motion planning algorithm that per-forms best on problems of interest, as well as motion planning researchers who want to compare the performance of a new algorithm relative to other state-of-the-art algorithms.
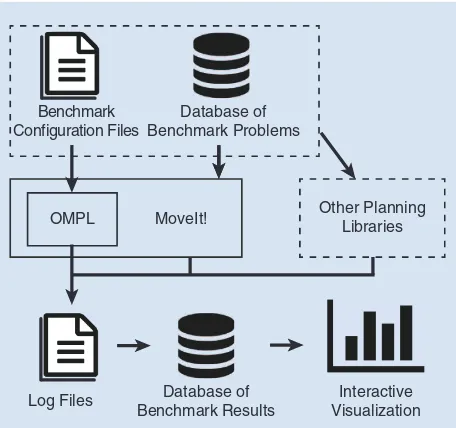
The benchmarking infrastructure consists of three main compo-nents (see Figure 1). First, we have created an extensive benchmark-ing software framework that is included in the Open Motion
Digital Object Identifier 10.1109/MRA.2015.2448276 Date of publication: 18 August 2015
Benchmarking Motion
Planning Algorithms
By Mark Moll, loan A. Sucan, and Lydia E. Kavraki
˛
An Extensible Infrastructure
for Analysis and Visualization
maze—©istockphoto.com/iserg,
Planning Library (OMPL, http://ompl.kavrakilab.org), a C++ library that contains implementations of many sampling-based algorithms [3]. One can immediately compare any new plan-ning algorithm to the more than 30 other planplan-ning algorithms that currently exist within OMPL. There is also flexibility in the types of motion planning problems that can be bench-marked, as discussed in the “Defining Motion Planning Prob-lems” section. Second, we have defined extensible formats for storing benchmark results. The formats are fairly straightfor-ward so that other planning libraries could easily produce compatible output. Finally, we have created an interactive, ver-satile visualization tool for compact presentation of collected benchmark data (see http://plannerarena.org). The tool and underlying database facilitate the analysis of performance across benchmark problems and planners. While the three components described above emphasize generality, we have also created a simple command line tool, specifically for rigid body motion planning that takes as input a plain text descrip-tion of a modescrip-tion planning problem.
Benchmarking sampling-based planners is nontrivial for several reasons. Since these planners rely on sampling, perfor-mance cannot be judged from a single run. Instead, bench-marks need to be run repeatedly to obtain a distribution of some performance metric of interest. Simply comparing the means of such distributions may not always be the correct way to assess the performance. Second, it is well known that different sampling strategies employed by sampling-based algorithms typically perform well only for certain classes of problems, but it is difficult to exactly define such classes. Finally, different applications require optimization for differ-ent metrics (e.g., path quality versus time of computation) and there is no universal metric to assess performance of planning algorithms across all benchmarks.
There have been some attempts in the past to come up with a general infrastructure for comparing different plan-ning algorithms (see [4], [5]). This article is in the same spirit but includes an extended and extensible set of metrics and offers higher levels of abstraction and concrete entry-level points for end users. Furthermore, we also introduce an ex-tensible logging format that other software can use and a vi-sualization tool. To the best of our knowledge, none of the prior work offered the ability to interactively explore and vi-sualize benchmark results. The Motion Planning Kernel (MPK) software system described in [4] is similar to OMPL in that both aim to provide a generic, extensible motion planning library, but MPK appears to no longer be main-tained or developed. There has been significant work on metrics used for comparing different planning algorithms (see [6], [7]), and our benchmarking infrastructure includes many of these metrics.
The contribution of this article is not to any particular benchmark problem, metric, or planner but provides a gener-ic, extensible benchmarking infrastructure that facilitates easy analysis and visualization of replicable benchmark results. Since it is integrated with the widely used and actively devel-oped OMPL, it becomes straightforward to compare any new
motion planning algorithm to many other state-of-the-art motion planning algorithms. All relevant information per-taining to how benchmarks were run is stored in a database to enable replicability of results.
Benchmarking Infrastructure
OMPL provides a high level of abstraction for defining mo-tion planning problems.
The planning algorithms in OMPL are, to a large extent, agnostic with re-spect to the space they are planning in. Similarly, the benchmarking infrastruc-ture within OMPL allows the user to collect various statistics for different types of motion planning problems. The basic workflow is as follows.
● The user defines a motion planning problem. This involves
defining the state space of the robot, a function that deter-mines which states are valid (e.g., collision-free), the starting state of the robot, and the goal. The complete definition of a motion planning problem is contained within a C++ ob-ject, which is used to construct a benchmark object.
● The user specifies which planning algorithms should be
used to solve the problem, time, and memory limits for each run and the number of runs for each planner.
● The benchmark is run. Upon completion, the collected
sults are saved to a log file. A script is used to add the re-sults in the log file to a SQL database. The rere-sults can be queried directly in the database or explored and visualized interactively through a website set up for this purpose (http://plannerarena.org).
Figure 1. An overview of the benchmarking infrastructure.
ompl moveit!
database of benchmark results
interactive Visualization other planning
libraries benchmark
configuration Files
database of benchmark problems
log Files
There is still no
characterization of which
algorithms are well-suited
for which classes
Defining Motion Planning Problems
The most common benchmark motion planning problems are those where robots are modeled as rigid bodies due to their simplicity (it is easy for users to intuitively assess per-formance). We have developed a simple plain-text file for-mat that describes such problems with a number of key-value pairs. Robots and environments are specified by mesh files. The state validity function is, in this case, hard-coded to be a collision checker. Besides the start and goal positions of the robot, the user can also specify an optimi-zation objective, such as path length, minimum clearance along the path, or mechanical work. There are several plan-ning algorithms in OMPL that optimize a path with respect
to a specified objective. (Others that do not sup-port optimization simply ignore this objective.) It is also possible to specify simple kinodynamic mo-tion planning problems. OMPL.app, the applica-tion layer on top of the core OMPL library, pre-defines the following sys-tems that can be used: 1) a first-order car, 2) a second-order car, 3) a blimp, and 4) a quadrotor. We have not developed
controllers or steering functions for these systems. Kinody-namic planners in OMPL fall back in such cases on sam-pling random controls. This makes planning for these systems extremely challenging; however, if controllers are available, then OMPL can use them. With a few lines of code, the command line tool can be modified to allow new planning algorithms or new types of planning problems to be specified in the configuration files.
The benchmark configuration files can be created with the graphical user interface (GUI) included with OMPL.app. A user can load meshes in a large variety of formats, define start and goal states, try to solve the problem with different plan-ners, and save the configuration file. The user can also visual-ize the tree/graph produced by a planning algorithm to get a sense of the difficulty of a particular problem. In the configu-ration file, the user can specify whether the solution paths (all or just the best one) should be saved during benchmarking. Saved paths can be played back with the GUI.
When defining motion planning problems in code, many of the limitations of the command line tool go away. Arbi-trary state spaces and kinodynamic systems can be used and different notions of state validity and different optimization objectives can be defined. In addition, any user-defined plan-ning algorithm can be used. The OMPL application pro-grammer interface (API) imposes only minimal requirements on new planning algorithms. In particular, the
API is not limited to sampling-based algo-rithms (in [8], for example, several non-sampling-based planners are integrated into OMPL). The low barrier to entry has lead to numerous contributions of plan-ning algorithms from other groups: OMPL 1.0 includes 29 planning algorithms. Since all these algorithms use the same low-level functionality for, e.g., collision checking, benchmarking highlights the differences in the motion planning algorithms them-selves.
The benchmarking facilities in MoveIt! [9] are based on and compatible with those in OMPL. The problem setup is somewhat similar to the OMPL command line tool. In MoveIt!, robots are specified by Unified Robot Description Format (URDF) files, which specify a robot’s geometry and kine-matics. Motion planning problems to be benchmarked are stored in a database.
Specifying Planning Algorithms
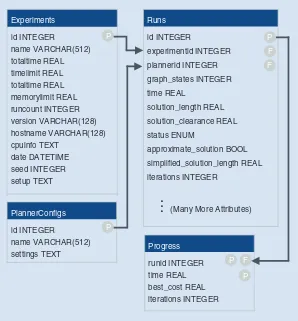
Once a motion planning problem has been specified, the next step is to select one or more planners that are appropriate for the given problem. Within OMPL, planners are divided into two categories: 1) geomet-ric/kinematic planners and 2) kinodynam-ic planners. The first category can be Figure 2. The schema for a database of benchmark results. The P and F denote the
primary and foreign keys of each table, respectively. runs
There is no universal metric
to assess performance of
planning algorithms across
further divided into two subcategories: 1) planners that ter-minate when any solution is found and 2) planners that at-tempt to compute an optimized solution (with respect to a user-specified optimization objective). For optimizing plan-ners, a threshold on optimality can be set to control how close to optimal the solution needs to be. At one extreme, when this threshold is set to zero, planners will run until time runs out. At the other extreme, when the threshold is set to infinity, planners act like nonoptimizing planners and will terminate as soon as any solution is found.
Typically, a user specifies multiple planners. By default, OMPL will try to make reasonable parameter choices for each planner. However, a user can also fine-tune any parameter set-ting for a planner. With the command line tool’s configuration files, this is easily accomplished by adding lines of the form planner.parameter=value. The parameter code infra-structure is generic, and when a programmer specifies a pa-rameter for a planner it can be specified through the configuration file without having to change the parsing of con-figuration files. It is also possible to add many instances of the same type of planner. This is useful for parameter sweeps. Each instance can be given a slightly different name to help distinguish the results for each instance. Each run of a planner is executed in a separate thread, therefore, if a planner hangs, the benchmark program can detect that and forcibly terminate the planner thread (the run is recorded as a crash and the benchmarking will continue with the next run).
Database of Benchmark Runs
After a benchmark run is completed, a log file is written out. With the help of a script, the benchmark results stored in the log file can be added to a SQLite3 database. Multiple bench-mark log files can be added to the same database. The SQLite3 database facilitates distribution of all relevant bench-mark data and users can simply transfer one single file. Fur-thermore, the database can be easily programmatically queried with almost any programming language. In contrast, extracting information directly from the log files or some other custom storage format would require more effort to perform the types of analysis and visualization that is en-abled by our database schema described below.
Figure 2 shows the database schema that is used. Each benchmark log file corresponds to one experiment. The ex-periments table contains an entry for each experiment that contains the basic benchmark parameters and the detailed in-formation about the hardware on which the experiment was performed (in the cpuinfo column). Information about each of the planner instances that were specified is stored in the PlannerConfigs table. For each planner instance, all parame-ter values are stored as a string representation of a list of key-value pairs (in the settings column). While we could have created a separate column in the PlannerConfigs table for each parameter, the parameters are planner specific with very few shared parameters among planners.
The main results are stored in the Runs table. Each entry in this table corresponds to one run of a particular planner
trying to solve a particular motion planning problem. After a run is completed, several attributes are collected such as the number of generated states (graph_states), duration of the run (time), length of the solution path (solution_ length), clearance along the solution path (solution_ clearance), and so on. Default solutions are simplified (through a combination of shortcutting and smoothing [10]), which usually improves the solution quality at a mini-mal time cost. Runs can terminate for a variety of reasons, such as a solution was found, the planner timed out (without any solution or with an approximate solution), or the planner crashed. We use an enumerate type for this attribute (stored in status), and the labels for each value are stored in the enums table (not shown
in Figure 2).
The progress table stores information peri-odically collected during a run. This collection is done in a separate thread so as to minimize the ef-fect on the run itself. Progress information is currently only available for optimizing planners. It is used to store the cost of the solution found at a particular time. By aggre-gating progress informa-tion from many runs for each planner, we can compare rates of conver-gence to optimality (see “Interactive Analysis of Results” section).
The database schema has been designed with extensibility in mind. Large parts of the schema are optional and other
columns can be easily added. This does not require new parsers or additional code. Instead, the log files contain enough structure to allow planners to define their own run and progress properties. Thus, when new log files are added to a database, new columns are automatically added to runs and progress. Planners that do not report on certain proper-ties will just store the value “N/A” in the corresponding col-umns. Additional run properties for a new type of planner are easily defined by storing key-value pairs in a dictionary of planner data, which is obtained after each run. Additional progress properties are defined by adding a function to a list of callback functions.
Log files have a fairly straightforward plain text format that is easy to generate and parse. (The complete syntax is specified at http://ompl.kavrakilab.org/benchmark.html.) This makes it easy for other motion planning libraries to
The infrastructure is aimed
both at end users who
want to select a motion
planning algorithm
that performs best on
problems of interest, as
well as motion planning
researchers who want to
compare the performance
of a new algorithm relative
to other state-of-the-art
generate compatible log files that can be added to the same type of benchmark database. For example, MoveIt!’s
bench-marking capabilities do not directly build on OMPL’s benchmark capa-bilities, yet it can produce compatible benchmark log files. This makes it possible to see how a planning algorithm’s per-formance changes when moving from abstract benchmark problems in OMPL to elaborate real-world settings created with MoveIt! (possibly from experimental data).
Interactive Analysis of Results
There are many different ways to visualize benchmark per-formance. It is nearly impossible to create a tool that can au-tomatically select the right visualizations for a given benchmark database. We have created a website called Plan-ner Arena (http://plannerarena.org), where benchmark data can be uploaded and selected results can be visualized. The website interface is dynamically constructed based on the content of the benchmark database. Selection widgets are created automatically for the benchmark problems, the per-formance attributes, the planning algorithms, and so on. The code that powers Planner Arena is included in the OMPL distribution and can be run locally to evaluate one’s own re-sults privately or be modified to create custom visualizations. There are currently three types of plots included on the
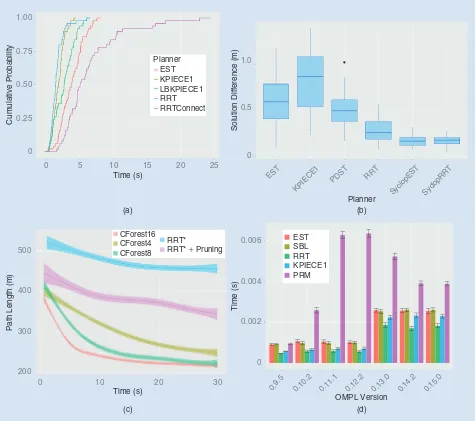
Figure 3. The sample output produced from a benchmark database by the Planner Arena server for various motion planning problems (but not the ones shown in Figure 4). (a) The performance plot of an empirical cumulative distribution function of solution times for a rigid body benchmark. (b) The performance plot of the distance between best found approximate solution and goal for a kinodynamic problem. (c) The progress plot of the convergence rate of asymptotically optimal planners. (d) The regression plot of test results for a trivial benchmark.
0 0.002 0.004 0.006
0.9.5 0.10.2 0.11.1 0.12.2 0.13.0 0.14.2 0.15.0 OMPL Version
Time (s)
EST SBL RRT KPIECE1 PRM
0 0.25 0.50 0.75 1.00
0 5 10 15 20 25
Time (s)
Cumulative Probability
EST KPIECE1 LBKPIECE1 RRT RRTConnect Planner
0 0.5 1.0
EST
KPIECE1
PDST RRT
Syclo pEST
Solution Difference (m)
Syclo pRR
T
Path Length (m)
500
400
200 300
0 10 20 30
Time (s)
(d) (c)
CForest16 CForest4 CForest8
RRT*
RRT* + Pruning
Planner
(a) (b)
The Planner Arena
website makes it easy
to interactively explore
Planner Arena site: 1) overall performance plots, 2) progress plots, and 3) regression plots. We will describe these plots in more detail below.
Plots of Overall Performance
The overall performance plots can show how different plan-ners compare on various measures. The most common per-formance measure is the time needed for a planner to find a feasible solution. By default, integer-and real-valued perfor-mance metrics (such as solution time) are plotted as box plots that provide useful summary statistics for each planner: median, confidence intervals, and outliers. However, in some cases visualizing the cumulative distribution function can re-veal additional useful information. For instance, from Fig-ure 3(a) one can easily read off the probability that a given planner can solve a particular benchmark within a specified amount of time. For very hard problems, where most plan-ners time out without finding a solution, it might be infor-mative to look at solution difference: the gap between the best found solution and the goal [Figure 3(b)]. For optimiz-ing planners, it is often more interestoptimiz-ing to look at the best solution found within some time limit. The overall perfor-mance page allows one to select a motion planning problem that was benchmarked, a particular benchmark attribute to plot, the OMPL version (in case the database contains data for multiple versions), and the planners to compare.
Most of the measures are plotted as box plots. Missing data are ignored. It is important to keep in mind that if a planner failed to solve a problem 99 times out of a 100 runs, then the average solution length is determined by one run. To make missing data more apparent, a table below the plot shows how many data points there were for each planner and how many of those were missing values.
Performance is often hard to judge by one metric alone. Depending on the application, a combination of metrics is often necessary to be able to choose an appropriate planner. For example, in our experience LBKPIECE [11] (one of the planning algorithms in OMPL) tends to be among the fast-est planners, but it also tends to produce longer paths. For time-critical applications this may be acceptable, but for ap-plications that place greater importance on short paths an-other planner might be more appropriate. There will also be exceptions to general trends. Bidirectional planners (such as RRT-Connect [12]) tend to be faster than unidirectional planners (such as RRT [12]), but Figure 3(a) shows that this is not always the case. This underscores the need for a good set of benchmark problems that are representative of differ-ent applications.
Progress Plots
Some planners in OMPL are not limited to reporting infor-mation after a run is completed, but can also periodically report information during a run. In particular, for asymptoti-cally optimal planners it is interesting to look at the conver-gence rate of the best path cost (e.g., path length). By default, Planner Arena will plot the smoothed mean as well as a 95%
confidence interval for the mean [Figure 3(c)]. Optionally, individual measurements can be shown as semitransparent dots, which can be useful to get a better idea of the overall distribution. Analogous to the performance plots, missing data are ignored. During the first couple seconds of a run, a planner may never find a solution path. Below the progress plot, we plot the number
of data points available for a particular planner at each 1-s time interval.
Regression Plots
Regression plots show how the performance of t h e s a m e p l a n n e r s change over different versions of OMPL [Fig-ure 3(d)]. This is mostly a tool for developers
using OMPL that can help in the identification of changes with unintended side effects on performance. However, it also allows a user to easily compare the performance of a user’s modifications to the planners in OMPL with the lat-est official release. In regression plots, the results are shown as a bar plot with error bars.
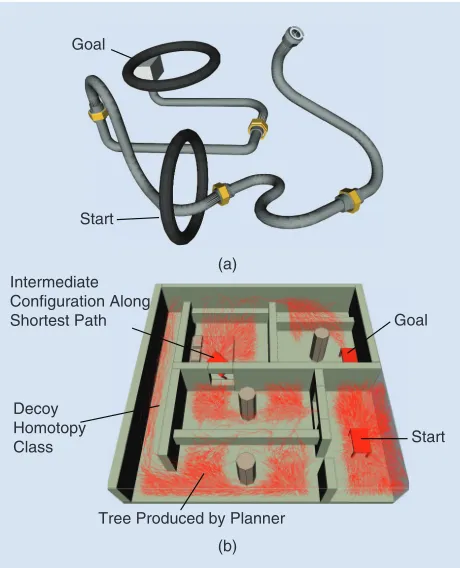
Any of the plots can be downloaded as a PDF file or as RData. The PDF format is useful if the plot is just needs touch ups. The RData file contains both the plot as well as all Figure 4. Two of the sample benchmark problems included on Planner Arena: (a) with a long, twisty narrow passage and (b) with several suboptimal decoy homotopy classes of paths.
Start Goal Intermediate
Configuration Along Shortest Path
Decoy Homotopy Class
Tree Produced by Planner Goal
Start
(a)
(b)
For community-wide
adoption of benchmarks
it is important to adopt
standard input and output
the data shown in the plot and can be loaded into R. The plot can be completely customized, further analysis can be ap-plied to the data, or the data can be plotted in an entirely dif-ferent way.
The default benchmark database stored on the server cur-rently contains results for nine different benchmark problems. They include simple rigid body type problems and hard prob-lems specifically designed for optimizing planners (problems that contain several suboptimal decoy homotopy classes), kinodynamic problems, and a multirobot problem (see Figure 4).
Discussion
We expect that with input from leaders in the motion planning community as well as with extensive simula-tions and experiments, we can create a suite of motion planning benchmarks. We plan to develop benchmarks along two different directions. First, there are toy prob-lems that isolate one of a number of common difficulties that could trip up a motion planning algorithm (such as a very narrow passage or the existence of many false leads). Such benchmarks may provide some insights that lead to algorithmic improvements. Second, we would like to develop a benchmark suite where performance (by some measure) is predictive of performance of more complex real-world scenarios.
Other planning libraries can use the same set of bench-mark problems. While OMPL could be extended with other planning algorithms, we recognize that for community-wide adoption of benchmarks it is important to adopt standard input and output file formats. The log file format and database schema for storing benchmark results described in this article are general enough that they can be adapted by other motion planning software. This would allow for a di-rect comparison of different implementations of plan-ning algorithms.
The Planner Arena website makes it easy to interactively explore benchmark results. At this point, we do not claim that the benchmarks included in the default database on Planner Arena form some sort of standard benchmark set, although they are representative of the types of problems that have been used in prior work [13]. Furthermore, the set of problems we present for results will increase over time.
Acknowledgments
Mark Moll and Lydia E. Kavraki are supported in part by tional Science Foundation grant 1317849 as part of the Na-tional Robotics Initiative program 1317849. The authors would like to thank Luis Torres for his contributions to the benchmarking capabilities in OMPL.
References
[1] J. Canny, The Complexity of Robot Motion Planning. Cambridge, MA: MIT
Press, 1988.
[2] H. Choset, K. M. Lynch, S. Hutchinson, G. Kantor, W. Burgard, L. E.
Ka-vraki, and S. Thrun, Principles of Robot Motion: Theory, Algorithms, and
Im-plementations. Cambridge, MA: MIT Press, 2005.
[3] I. A. Şucan, M. Moll, and L. E. Kavraki. (2012, Dec.). The open motion
planning library. IEEE Robot. Automat. Mag. [Online]. 19(4), pp. 72–82.
Avail-able: http://ompl.kavrakilab.org
[4] I. Gipson, K. Gupta, and M. Greenspan, “MPK: An open extensible motion
planning kernel,” J. Robot. Syst., vol. 18, no. 8, pp. 433–443, 2001.
[5] B. Cohen, I. A. Şucan, and S. Chitta, “A generic infrastructure for
bench-marking motion planners,” in Proc. IEEE/RSJ Int. Conf. Intelligent Robots
Sys-tems, Oct. 2012, pp. 589–595.
[6] R. J. Geraerts, “Sampling-based motion planning: Analysis and path quali-ty,” Ph.D. dissertation, Dept. Comput. Sci., Utrecht Univ., Utrecht, The Neth-erlands, May 2006.
[7] M. A. M. Aguirre, “Metrics for sampling-based motion planning,” Ph.D. dis-sertation, Dept. Comput. Sci., Texas A&M Univ., College Station, TX, Dec. 2007. [8] J. Luo and K. Hauser, “An empirical study of optimal motion planning,” in
Proc. IEEE/RSJ Int. Conf. Intelligent Robots Systems, 2014, pp. 1761–1768. [9] I. A. Şucan and S. Chitta. (2015, July 28). MoveIt! [Online]. Available: http: //moveit.ros.org
[10] R. Geraerts and M. Overmars, “Creating high-quality paths for motion
planning,” Int. J. Robot. Res., vol. 26, no. 8, pp. 845–863, 2007.
[11] I. A. Şucan and L. E. Kavraki, “A sampling-based tree planner for systems
with complex dynamics,” IEEE Trans. Robot., vol. 28, no. 1, pp. 116–131, 2012.
[12] J. Kuffner and S. M. LaValle, “RRT-Connect: An efficient approach to
sin-gle-query path planning,” in Proc. IEEE Int. Conf. Robotics Automation, San
Francisco, CA, Apr. 2000, pp. 995–1001.
[13] (2015, July 28). Algorithms & applications group motion planning puzzles. [Online]. Available: https://parasol.tamu.edu/dsmft/benchmarks/
Mark Moll, Department of Computer Science, Rice University, Houston, Texas 77251. E-mail: [email protected].
loan A. Şucan, Google, Mountain View, California 94043. E-mail: [email protected].
Lydia E. Kavraki, Department of Computer Science, Rice Uni-versity, Houston, Texas 77005. E-mail: [email protected].