Psychographics of would be teachers: Are we fishing in the right pond?
Assoc.Prof. Dr.Hj.Abdul Raheem Mohamad Yusof 1
1Chief Operating Officer, Malaysia Technical University Showcase, Bangi Gateway.
Corresspondence: Assoc.Prof. Dr.Hj.Abdul Raheem Mohamad Yusof, Malaysia Technical University Showcase, Bangi Gateway. E-mail:
Received: April 27, 2017 Accepted: Mei 29, 2017 Online Published: June 27, 2017
Abstract
Purpose of this paper: The objectives of this research paper are to identify the psychographics of would be teacher at Universiti Pendidikan Sultan Idris (UPSI) and to determine whether student teachers at the various faculties have different psychographic profiles.
Introduction: The analysis of consumer lifestyles, called psychographics, provides insights into consumer behavior. Psychographic delves into how consumers describe themselves. Psychographic is the practice of combining psychology, lifestyle, and demographics variables into the analysis. Psychographic analysis is a technique that investigates how people live, what interest them, and what they like. It is also called lifestyle analysis or AIO, because it relies on
a number of statements about a person’s activities, interests, and opinions. According to the VALS™ system there are eight categories of psychographic profiles: Thinkers, Achievers, Experiencers, Believers, Strivers, Makers, Innovators and Survivors.
Design/Methodology: A survey instrument, the VALS™ survey was used to gather
information. The survey instrument consists of a 40-item questionnaire. Data was collected from 392 student teachers at Universiti Pendidikan Sultan Idris. ANOVA was used to determine if there are differences in psychographics profiles between students at the various faculties.
Findings: Psychographic profiles of student teachers at Universiti Pendidikan Sultan Idris fell into the three categories (Strivers, Experiencers, and Achievers) and there is a difference in psychographic profiles between student teachers at the various faculties.
Research limitations/implications: There are methodological limitations and generalizability limitations which need some attention.
Practical implications: Academics and administrators at teacher training institutions can use this information in training teachers and ensuring diversity of psychographic profiles of teachers.
Value of paper/ what is original?: Profiling of student teachers according to their
psychographics. Understanding the student teachers’ psychographic profiles is a key to
Introduction
The strategic thrusts of the Education Development Master Plan (2006-2010) are: (1) Nation building, (2) Developing human capital, (3) Strengthening national schools, (4) Bridging the education gap, (5) Enhancing the teaching profession, and (6) Accelerating excellence of educational institutions (Zulkurnain, 2007). One of the critical success factors to fully achieve these thrusts are the kinds of teachers we have in our education system. Are we fishing in the right pond? We need to target the right kind of students for teacher training programs.
The Ministry of Education launched a comprehensive review of the education system in Malaysia in 2011. A fundamental objective of this review is to ensure that its students are being equipped with the knowledge and skills required for success in life. The Malaysia Education Blueprint 2013 – 2025 (Preschool to Post-Secondary Education) suggests 11 strategic and operational shifts that would be required to achieve that vision (www.moe.gov.my). The shifts are: (1) Provide equal access to quality education of an international standard, (2) Ensure every child is proficient in Bahasa Malaysia and English Language and is encouraged to learn an additional language, (3) Develop values-driven Malaysians, (4) Transform teaching into the profession of choice, (5) Ensure high performing school leaders in every school, (6) Empower JPNs, PPDs, and schools to customize solutions based on need, (7) Leverage ICT and to scale up quality learning across Malaysia, (8) Transform Ministry delivery capabilities and capacity, (9) Partner with parents, community, and private sector at scale, (10) Maximize student outcomes for every Ringgit, and (11) Increase transparency for direct public accountability.
According to Witchel (2003), studies specific to the teaching profession have found that vocational personality types have a high correlation with job satisfaction. However, little to no research has been discovered regarding the type of personality, values or lifestyles that might successfully match the personality or psychographic style necessary to succeed in the online environment as a university instructor. Academic recruitment is an important part of the education system. Psychographic information need to be incorporated in the screening process to ensure that the right candidate are trained to be teachers. Psychographics covers a wide range of descriptors including activities, interests, opinions, values, attitudes, and personality traits (Robertson, 1984). In a study conducted by Siti Rafiah, et.al., (2012) good personality is
insufficient in enhancing the teachers’ commitment and responsibilities towards their students unless it is complemented by the teachers’ cognitive competency.
Objectives
Psychographics
Psychographics can be described as a science that studies how people react to the world around them according to their values and lifestyles. As a form of social group analysis psychographics can be used to help design and create more effective communication tools and communication environments. It helps marketers understand who we are communicating to -- what they might respond to positively or negatively; where their psychological, emotional and even spiritual switches may be found.
The science as we know it today was developed in the 1960s by Arnold Mitchell at Stanford Research Institute. Originating from his work in social statistics as a mathematician at Princeton University, it emerged as original breakthroughs doctoral work in Psychology.
'Psychographic profiling' categorizes people into unique 'typologies' (profiles) based primarily upon their apparent values and lifestyles. The more standard age/gender/income demographic definitions, although important and included in the research, collectively play a lesser role in the psychographics formula. As the world changes, all typologies will experience changes in their nature, and the way we communicate to them will also have to change. Mitchell's primary typologies break the largest cross-section of North American adults into eight primary profiles:
The key is to understand that each of these groups or primary typologies -- according to values and lifestyle influences -- develops its own unique 'language'; of shapes, symbols, semiotics, images, self-images, colors and even words. A colour which turns one group on (positive impact) may turn another group off (negative impact), be uninteresting (neutral and negative) to some and be almost invisible (without impact -- neutral or negative) to other groups. The same goes for words, shapes, symbols, textures and more.
Psychographics is the science of using psychology and demographics to better understand consumers. SRI Consulting Business Intelligence’s (SRI-BI) VALSTM framework
is one of the most popular commercially available classification systems based on psychographic measurements (Kotler, 2003). VALS classified the adult population of Americans into eight primary groups based on their psychological attributes and key demographics. Basically, the Americans were divided into two major categories: high PRIMARY TYPOLOGIES -- and parts of their distinguishing natures
Survivors -- mostly older, poor, removed from cultural mainstream
Sustainers -- mostly young, struggling, angry, distrustful
Belongers -- traditional, home is domain, rather fit in than stand out
Emulators -- ambitious, competitive, upwardly mobile, material pursuit
Experientials -- want direct experience, inner growth, art and home
I-Am-Mes -- young, exhibitionist, impulsive, narcissistic, inventive
Achievers -- Leaders, professionals, status focus, materialistic, trusting
resources, high innovation and low resources, low innovation. The main inclinations of the four groups with high resources and high innovations are:
1. Innovators/Actualizers: Successful, sophisticated, active, “take charge” people.
Purchases often reflect cultivated tastes for relatively upscale, niche-oriented products. People with high self-esteem and plentiful resources. Though image is important, it is not to impress others but as a reflection of their taste and character. Socially conscious and have a diverse rich life and open to new ideas and change. They are established or emerging leaders of business or government.
2. Thinkers/Fulfilled: Mature, satisfied, comfortable, and reflective. Are well educated and are in professional jobs or recently retired. Favor durability, functionality, and value in products. Fairly knowledgeable about world events and have a social consciousness.
3. Achievers: Successful, career- and work-oriented. Value stability and status quo. Favor established and prestige products that demonstrate success to their peers. Likely to be politically and economically conservative. Lives revolve around their family and church.
4. Experiencers: Young, vital, enthusiastic, impulsive, and rebellious. Spend a comparatively high proportion of income on clothing, fast food, music, movies, and video. Seek variety and excitement in the products they consume.
The main inclinations of the four groups with low resources and low innovations are:
1. Believers: Conservative, conventional, and traditional. Favor familiar products and established brands especially locally made products. They value church, family, and community.
2. Strivers: Uncertain, insecure, approval-seeking, resource constrained. Favor stylish products that emulate the purchases of those with greater material wealth. Constantly seek approval of their peers and people around them.
3. Makers: Practical, self-sufficient, traditional, family-oriented. Favor only products with a practical or functional purpose such as tools, utility vehicles, fishing equipment. Are value conscious and buy do-it-yourself (DIY) products. Are conservative and suspicious of government intrusion.
4. Survivors/Strugglers: Elderly, resigned, passive, concerned, resource constrained and generally not well educated. Cautious consumers who are loyal to favorite brands, especially if they can buy them at a discount. Typically are more concerned with safety and security.
1. Integrators: These consumers are active, inquisitive, trend-leading, informed, and affluent. They travel frequently and consume a wide range of media.
2. Self Innovators and Self Adopters: These consumers desire personal experience, fashionable display, social activities, daring ideas, and exciting, graphic entertainment.
3. Ryoshiki Innovators and Ryoshiki Adapters: These consumers are guided by their concern for their home, family, and social status, although they have done well educationally, career-wise, and in terms of professional knowledge. (Ryoshiki
means “good values.”)
4. Tradition Innovators and Tradition Adapters: These consumers adhere to traditional religions and customs, prefer long-familiar home furnishings and dress, and hold conservative social opinions.
5. High Pragmatics and Low Pragmatics: These consumers are not very active and not well informed, have few interests and seem flexible and even uncommitted in their lifestyle choices.
6. Sustainers: These consumers lack money, youth, and high education. They dislike innovation and are typically oriented to sustaining the past.
Six distinct segments were found among Asian managers and businesspeople (Evelyn, 1999):
1. Contemporary Leaders: They are passionate and energetic about life; think on a global scale for personal and career needs; like eating out, fashion, buying art and antiques; and watch cable TV.
2. Corporate Leader Wannabes: These are 20-somethings who want to be Contemporary Leaders. They value both tradition and modern “in” things. They
buy second-hand Mercedes Benzes with Honda as the next best thing. They enjoy reading, and attending Western concerts and watching science fiction movies. 3. Global Individuals: They are foreign educated and confident. They are jet-setters
who like new ways of doing things. They are surrounded by high-tech products such as notebooks and palmtop PCs. They have little time for shopping.
4. Contented Homebodies: These managers feel that they have achieved enough and are ready to slow down and spend more time with the family. They spend a lot of time watching TV but seldom go to the movies.
5. Family Types: They spend the most time within a network of family and friends. They value personal ties over money. As family entertainment is important, they splurge on big karaoke systems. They watch local TV and like to be well-dressed. 6. Strugglers: They feel highly stressed and very trapped by work and family. They
Seven Singaporean psychographic segments identified by Survey Research Singapore were (Magdelene, 1997):
1. Middle Singaporeans: They want to keep up and not lose out to others. Older, more affluent, and better educated, they include professionals and executives. 2. Hard-pressed Providers: They feel pressured and economically obliged to provide
for their families. Though competitive, they do not see a bright future.
3. Disciplined Conservatives: They lead purposeful lives with religion playing a key role. They value filial piety, marriage, and education.
4. Ambitious Strivers: They are success-oriented, competitive, and energetic. They are less concerned with traditional values but are comfortable with rapid changes in technology. They work and play hard.
5. Old Drifters: They are not motivated and believe more in fate.
6. Disaffected: They are frustrated with the rat race. Materialistic and spendthrift, they are drawn to brand names and sales, and may take short-cuts and less than honest means to achieve success.
7. Contented Nesters: They tend to be dependent on others and are happy with their state in life.
The eight psychographics segments found in the Taiwanese market were (DeMooij & Keegan, 1991):
1. Traditional Homebodies: They have a fairly traditional view about life. They are not interested in trends. Instead they like to watch television, especially soap operas.
2. Confident Traditionalist: They have traditional outlook on morals and social values. They are competitive and have highly developed self image.
3. Family-centered Fatalists: They are family-oriented, fairly contented with the status quo; and are not interested in trendy goods.
4. Lethargics: Their overriding characteristic is “ordinariness”, difficult to reach through media.
5. Middle-class Hopefuls: They are down-to-earth; optimistic; reasonable spenders interested in new things; and take few risks with their money.
6. Discontented Moderns: They follow new trends but also retain a number of key traditional attitudes. They are heavy TV watchers and look for fun.
7. Rebellious Young: Although relatively affluent, they are discontented, nonconforming, trend setters, impulsive buyers, and relatively individualistic.
8. Young Strivers: They are of average affluence, competitive, materialistic, average TV viewers, and look for specific goods that fit self-image and needs.
thinkers, confident conservatives, excitement seekers, disciplined innovators, and solo sustainers.
Consumers tend to be dynamic in that resources available to them changes over time and the pressure on these resources change too, thus their VALS category may also change. However, the psychological motivations measured by VALS are enduring traits which may last up to 15 years or more (Hoffman, 2003).
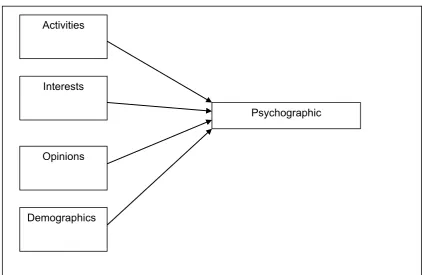
The conceptual framework
The conceptual framework for psychographic is depicted in figure 1 below.
Figure 1: Conceptual framework for Psychographic
Research Methodology
This is a cross-sectional descriptive research design. The reasons for using a cross-sectional research analysis are:
1. This study is interested in generating a representative sample with which summary statistics could be generated and their relationships established and compared. 2. This study attempts to draw various conclusions from the data collected and to
make some recommendations from these conclusions.
3. Time limitation makes it impossible for this study to be conducted as a longitudinal study.
Activities
Interests
Opinions
Demographics
In order to sample a representative sample of the population under-study, the survey method will be utilized. The questionnaires for this study will make use of the SRIC-BI questionnaire. However, some changes were made so as to make it more appropriate for this study. The questionnaires were also translated to Bahasa Malaysia so as to help the respondents understand the questions better. The Bahasa Malaysia vesion was reverse-translated to ensure congruency across both versions (Brinslin et al., 1973). The questionnaires were then distributed to students from the various faculties. A total of 392 students from the various faculties participated in this survey. The responses were them keyed-in keyed-into the sric-bi.com for analysis. The overall Cronbach’s alpha reliability coefficient scores
for the instruments used was 0.8750. Generally, the above reliability coefficient indicated that there was a high level of consistency in the responses given by the respondents. Reliability coefficients of 0.70 and above were considered more than acceptable for most behavioral science applications (Nunnaly, 1978).
Findings
The objective of this section is to present, interpret and discuss the results of the
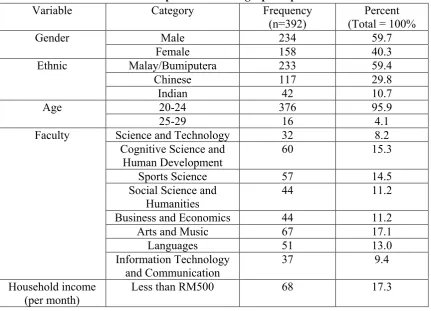
various tests that were carried out. Table 1 below gives a summary of the respondents’
demographics.
Table 1: Respondents’ demographics profile
Variable Category Frequency
(n=392)
Percent (Total = 100%
Gender Male 234 59.7
Female 158 40.3
Ethnic Malay/Bumiputera 233 59.4
Chinese 117 29.8
Indian 42 10.7
Age 20-24 376 95.9
25-29 16 4.1
Faculty Science and Technology 32 8.2
Cognitive Science and
Business and Economics 44 11.2
RM501-RM1000 123 31.4
RM1001-RM2000 169 43.1
RM2001-RM3000 16 4.1
More than RM3001 16 4.1
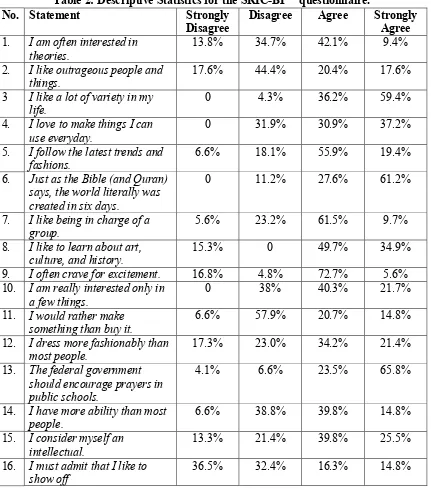
The independent variables studied were activities, interests, and opinions. Table 2 shows the descriptive statistics for AIO based on the SRIC-BI™ questionnaire.
Table 2: Descriptive Statistics for the SRIC-BI™ questionnaire.
No. Statement Strongly
Disagree
Disagree Agree Strongly Agree
1. I am often interested in theories.
13.8% 34.7% 42.1% 9.4%
2. I like outrageous people and things. says, the world literally was created in six days.
0 11.2% 27.6% 61.2%
10. I am really interested only in a few things.
0 38% 40.3% 21.7%
11. I would rather make something than buy it.
6.6% 57.9% 20.7% 14.8%
12. I dress more fashionably than most people.
17.3% 23.0% 34.2% 21.4%
17. I like trying new things. 6.6% 8.2% 53.1% 32.1% 18. I am interested in how
mechanical things, such as engines, work. or more in a foreign country.
6.6% 12.5% 52.8% 28.1%
23. I like a lot of excitement in my life.
4.1% 10.7% 63.8% 21.4%
24. I must admit that my interests are somewhat narrow and limited.
18.9% 49.0% 10.7% 21.4%
25. I like making things of wood, metal, or other such material
17.3% 48.7% 23.2% 10.7%
26. I want to be considered fashionable.
6.6% 17.6% 43.4% 32.4%
27. A woman’s life is fulfilled
only if she can provide a happy home for her family.
4.1% 8.4% 27.3% 60.2%
28. I like the challenge of doing something I have never done before.
34. I would like to understand more about how the universe works.
4.1% 6.6% 49.0% 40.3%
35. I like my life to be pretty much the same from week to week.
Of the total respondents 51.5% are interested in theories and only 38% like outrageous people and things. It should be noted that 95.6% like a lot of variety in their life, while 68.1% like to make things they can use everyday. When asked about trends and fashion, 75.3% believed that they are following the latest trends and fashion and 55.6% of them thought that they dress more fashionably than most people, and 73.5% like to dress in the latest fashion, and 75.8% want to be considered fashionable. More than 80 percent (88.8%) of the respondents believed that the world was created in six days (as mentioned in the holy Bible and the holy Quran). More than 70 percent (71.2%) like being in charge of a group, 74.5% like to lead others and 84.6% said that they like to learn about art, culture, and history, and 55.4% like to learn about things even if they may never of use to them. The majority of them (78.3%) crave for excitement, 85.2% like a lot of excitement in their life, only 38% are really interested only in a few things, only 32.1% agreed that their interests are somewhat narrow and limited, and 85.2% like trying new things, and 55.4% of them are always looking for a thrill, and 91.8% like the challenge of doing something they have never done before, and 85% like doing things that are new and different. Only 19.8% of them like their life to be pretty much the same from week to week. Only 35.5% agreed that they would rather make something than buy it, while 33.9% like to make things of wood, metal, or other such material, and 54.3% like to look through hardware or automotive stores. Of the total, 89.3% think that the federal government should encourage prayers in public schools and 76.8% of them believe that there is too much sex on television today. While 89.3% of them would like to understand more about how the universe works, only 55.4% of them are interested in how mechanical things, such as engines work. More than 50% (54.6%) believed that they have more ability than most people, while 65.3% considered themselves as intellectuals. Only 31.1% admitted that they like to show off. Slightly more than 80 percent (80.9%) of them would like to spend a year or more in a foreign country. More than 80 percent (87.5%) of them believed that a
woman’s life is fulfilled only if she can provide a happy home for her family. The result of the SRIC-BI™ analysis is shown in table 3 below.
Table 3: Psychographic of UPSI undergraduate students
Primary VALS
emphasis given to the dominant approach.
Strivers 30.1%
Experiencers 12.8%
Achievers 58.1%
Strivers (www.sric-bi.com/VALS/strivers) are trendy and love fun. Strivers are motivated by achievement and are concerned about opinions and approval of others. Success is defined by money, which they don’t have enough of to meet their desires. Strivers favor
Strivers see themselves as having a job rather than a career. A lack of marketable skills and focus often prevents them from moving ahead in life. Strivers are active consumers. Shopping is both a social activity and also an opportunity to demonstrate to peers their ability to buy products or services. As consumers, they tend to be as impulsive as their financial circumstances will allow.
Experiencers (www.sric-bi.com/VALS/experiencers) are motivated by self-expression. As young, enthusiastic, and impulsive consumers, they quickly become enthusiastic about new possibilities but are equally quick to cool off. Experiencers search for variety and excitement, relishing the new, the offbeat, and the risky. Their energy finds a vent in exercise, sports, outdoor recreation, and social activities. Experieners are passionate consumers and spend a comparatively high proportion of their income on fashion, entertainment, and socializing. Experiencers purchases display the emphasis they place on
looking good and having “cool” stuff.
Achievers (www.sric-bi.com/VALS/achievers) are motivated by the desire for achievement. They have goal-oriented lifestyles and a deep obligation to career and family. Their social lives display this focus and are structured around their family, their place of worship, and work. They live conventional lives, are politically conservative, and respect authority and the status quo. Achievers value consensus, predictability, and stability over risk, intimacy, and self-discovery. Achievers are active in the consumer marketplace because they have many wants and needs. Image is an important aspect to Achievers. They favor established and prestige products/services that demonstrate success to their peers. They are often interested in a variety of time-saving devices due to their busy lives.
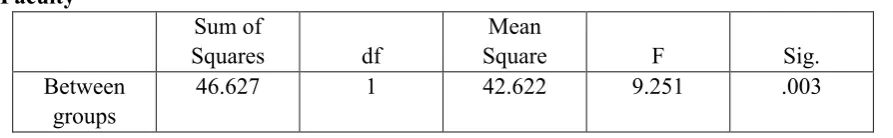
In order to test whether there is a difference in psychographic between students at the various faculties, ANOVA was carried out. The result of the ANOVA test is shown in tables 4, 5, 6, and 7.
Table 4: Test of Homogeneity of Variance Faculty
Levene
Statistic df1 df2 Sig.
.144 1 390 .750
Levene’s test for homogeneity of variance is not significant (p > .05) and thus we can
be confident that the population variance for each group are approximately equal.
Within groups
1797.117 390 4.608
Total 1839.745 391
Given that p < .05, the null hypothesis can be rejected and the alternative hypothesis which states that the Primary VALS is different across faculties be accepted.
Table 6: Test of Homogeneity of Variance Faculty
Levene
Statistic df1 df2 Sig.
2.225 2 389 .109
Levene’s test for homogeneity of variance is not significant (p > .05) and thus we can be confident that the population variance for each group are approximately equal.
Table 7: ANOVA: Secondary VALS Faculty
Given that p < .05, the null hypothesis can be rejected and the alternative hypothesis which states that the Secondary VALS is different across faculties be accepted.
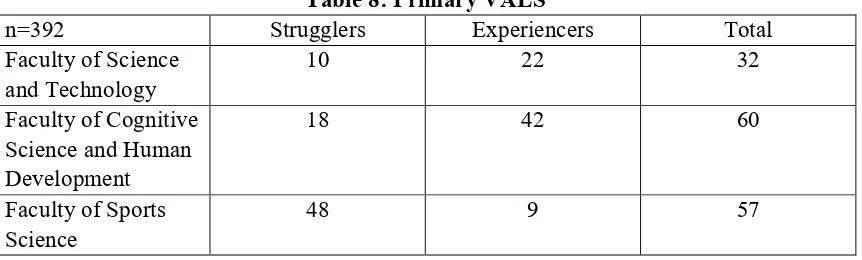
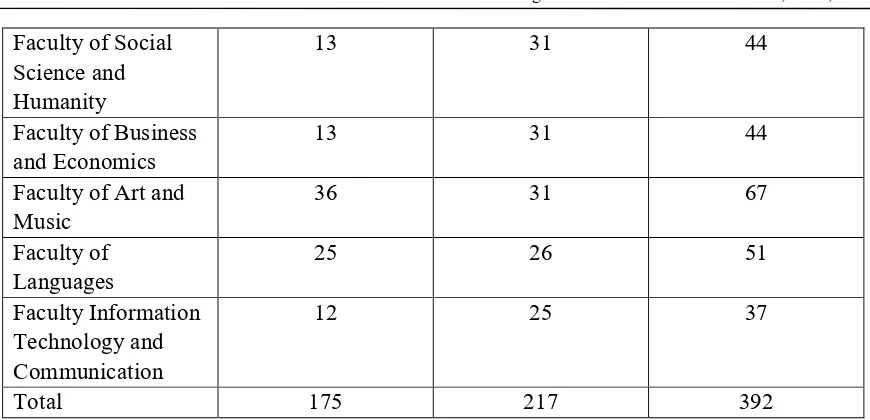
Table 8 and table 9 shows the Primary VALS and Secondary VALS respectively according to the faculties.
Table 8: Primary VALS
n=392 Strugglers Experiencers Total
Faculty of Social
Faculty of Art and Music
Table 9: Secondary VALS
n=392 Strugglers Experiencers Achievers Total
Faculty of Science
Research limitation
The research has a few limitations. The use of the sric-bi.com psychographic conceptualizations may not be sufficiently elaborate or appropriate. While the total sample size is respectable, the cross-faculty sub-samples are not large and may not be robust enough to withstand generalization.
Direction for future research and recommendations
There are a number of directions for future research. Firstly, the study needs to be validated with larger samples from each faculty. Secondly, to introduce an overall trend dimensions in the psychographic measures in order to incorporate the time aspect, thus making
it possible to measure the direction of change of the respondents’ psychographics. Thirdly, to
design a psychographic instrument more appropriate for Malaysians.
Conclusions
The three main psychographic profiles of undergraduate students at Sultan Idris Education University (UPSI) are Strivers, Experiencers, and Achievers. Therefore, this study may have implications for educational programs to identify likely candidate who are innovators in adapting and implementing new technologies and new teaching methods, as well as in aiding in the spreading the learning and diffusion curve to other teachers who are late adopters of new technologies and teaching methods. A key to maintaining a high-quality recruiting campaign to replenish and expand the profession of teaching is in understanding the psychographic profiles of would be teacher. Recruiting efforts of teacher training institutions should be targeted towards those psychographic categories that would be most successful in the teaching profession. Psychographic profiling can also be used in the selection of academic leaders.
References
Brinslin, R. W., Lonner, W.J. & Thondike, R.M. (1973). Cross cultural research methods. New York: John-Wiley & Sons.
De Mooij, M.K. and Keegan, W. (1991). Lifestyle Research in Asia, Advertising Worldwide. Hemel Hempstead: Prentice Hall, pp. 119-30.
Hoffman, K.D. et al. (2003). Marketing Best Practices, 2nd.edition. Ohio: Thomson.
Kotler, P. et al. (2003). Marketing Management: An Asian Perspective, Singapore: Prentice Hall.
Lum, Magdelene. (1997). The 7 Types of Singaporeans, The Sunday Times (Singapore). May 11, pp. 10-11.
Malaysia Education Blueprint 2013-2025 (Preschool to Post-Secondary Education). Retrieved 20 August 2017 from http://www.moe.gov.my.
Witchel, A.D. (2003). The use of psychographics as an indicator of job success for online
faculty. D.B.A. thesis, Argosy University, Sarasota.
www.sric-bi.com/VALS/JVALS.shtml retrieved 15 August 2015.
Rohaizat Baharun, Abu Bakar Abdul Hamid, Ahmad Sharifuddin Shamsudin, Nor Zafir Md Salleh, Norzaidahwati Zaidin & Zuraidah Sulaiman. (2011). Market segmentation in Malaysia by using psychographic dimensions for unit trust products. African Journal of Business Management. Vol.5 (13). pp. 5040-5047. Retrieved 08 August 2017 from
http://www.academicjournals.org/AJBM
Siti Rafiah Abd Hamid, Sharifah Sariah Syed Hassan & Nik Ahmad Hashim Ismail. (2012). Teaching Quality and Performance Among Experienced Teachers in Malaysia. Australian Journal of Teacher Education. Vol. 37 Issue 11. Retrieved 13 September 2017 from http://www.ro.ecu.edu.au
Yap, Evelyn. (1999). Selling with Savvy, Regionally. The Straits Times (Singapore), July 24. p. 58