In 1970 the New York Times cost 15 cents, the median price of a single-family home was $23,400, and the average wage in manufacturing was $3.36 per hour. In 2000 the Timescost 75 cents, the price of a home was $166,000, and the aver-age waver-age was $14.26 per hour.This overall increase in prices is called inflation, and it is the subject of this chapter.
The rate of inflation—the percentage change in the overall level of prices— varies greatly over time and across countries. In the United States, according to the consumer price index, prices rose an average of 2.4 percent per year in the 1960s, 7.1 percent per year in the 1970s, 5.5 percent per year in the 1980s, and 3.0 percent in the 1990s. Even when the U.S inflation problem became severe during the 1970s, it was nothing compared to the episodes of extraordinarily high inflation, called hyperinflation, that other countries have experienced from time to time. A classic example is Germany in 1923, when prices rose an average of 500 percent per month.
In this chapter we examine the classical theory of the causes, effects, and social costs of inflation.The theory is “classical” in the sense that it assumes that prices are flexible. As we first discussed in Chapter 1, most economists believe this as-sumption describes the behavior of the economy in the long run. By contrast, many prices are thought to be sticky in the short run, and beginning in Chapter 9, we incorporate this fact into our analysis. Yet, for now, we ignore short-run price stickiness. As we will see, the classical theory of inflation not only provides a good description of the long run, it also provides a useful foundation for the short-run analysis we develop later.
The “hidden forces of economic law’’ that lead to inflation are not as myste-rious as Keynes claims in the quotation that opens this chapter. Inflation is sim-ply an increase in the average level of prices, and a price is the rate at which money is exchanged for a good or a service.To understand inflation, therefore,
4
Money and Inflation
C H A P T E RThere is no subtler, no surer means of overturning the existing basis of
so-ciety than to debauch the currency.The process engages all the hidden forces
of economic law on the side of destruction, and does it in a manner which
not one man in a million is able to diagnose.
User JOEWA:Job EFF01420:6264_ch04:Pg 76:25579#/eps at 100%
*25579*
Wed, Feb 13, 2002 9:08 AM we must understand money—what it is, what affects its supply and demand, andwhat influence it has on the economy.Thus, Section 4-1 begins our analysis of inflation by discussing the economist’s concept of “money’’and how, in most modern economies, the government controls the quantity of money in the hands of the public. Section 4-2 shows that the quantity of money determines the price level and that the rate of growth in the quantity of money determines the rate of inflation.
Inflation in turn has numerous effects of its own on the economy. Section 4-3 discusses the revenue that the government raises by printing money, sometimes called the inflation tax. Section 4-4 examines how inflation affects the nominal interest rate. Section 4-5 discusses how the nominal interest rate in turn affects the quantity of money people wish to hold and, thereby, the price level.
After completing our analysis of the causes and effects of inflation, in Section 4-6 we address what is perhaps the most important question about inflation: Is it a major social problem? Does inflation amount to “overturning the existing basis of society,’’as the chapter’s opening quotation suggests?
Finally, in Section 4-7, we discuss the extreme case of hyperinflation. Hyper-inflations are interesting to examine because they show clearly the causes, effects, and costs of inflation. Just as seismologists learn much by studying earthquakes, economists learn much by studying how hyperinflations begin and end.
4-1
What Is Money?
When we say that a person has a lot of money, we usually mean that he or she is wealthy. By contrast, economists use the term moneyin a more specialized way.To an economist, money does not refer to all wealth but only to one type of it:moneyis the stock of assets that can be readily used to make transactions. Roughly speaking, the dollars in the hands of the public make up the nation’s stock of money.
The Functions of Money
Money has three purposes. It is a store of value, a unit of account, and a medium of exchange.
As a store of value, money is a way to transfer purchasing power from the present to the future. If I work today and earn $100, I can hold the money and spend it tomorrow, next week, or next month. Of course, money is an imperfect store of value: if prices are rising, the amount you can buy with any given quan-tity of money is falling. Even so, people hold money because they can trade the money for goods and services at some time in the future.
stores post their prices in dollars and cents. A car dealer tells you that a car costs $20,000, not 400 shirts (even though it may amount to the same thing). Similarly, most debts require the debtor to deliver a specified number of dollars in the fu-ture, not a specified amount of some commodity. Money is the yardstick with which we measure economic transactions.
As a medium of exchange, money is what we use to buy goods and ser-vices.“This note is legal tender for all debts, public and private’’is printed on the U.S. dollar.When we walk into stores, we are confident that the shopkeepers will accept our money in exchange for the items they are selling. The ease with which money is converted into other things—goods and services—is sometimes called money’s liquidity.
To better understand the functions of money, try to imagine an economy without it: a barter economy. In such a world, trade requires the double coincidence of wants—the unlikely happenstance of two people each having a good that the other wants at the right time and place to make an exchange. A barter economy permits only simple transactions.
Money makes more indirect transactions possible. A professor uses her salary to buy books; the book publisher uses its revenue from the sale of books to buy paper; the paper company uses its revenue from the sale of paper to pay the lum-berjack; the lumberjack uses his income to send his child to college; and the col-lege uses its tuition receipts to pay the salary of the professor. In a complex, modern economy, trade is often indirect and requires the use of money.
The Types of Money
Money takes many forms. In the U.S. economy we make transactions with an item whose sole function is to act as money: dollar bills.These pieces of green paper with small portraits of famous Americans would have little value if they were not widely accepted as money. Money that has no intrinsic value is called fiat money because it is established as money by government decree, or fiat.
Although fiat money is the norm in most economies today, most societies in the past have used for money a commodity with some intrinsic value. Money of this sort is called commodity money. The most widespread example of commodity money is gold. When people use gold as money (or use paper money that is redeemable for gold), the economy is said to be on a gold standard. Gold is a form of commodity money because it can be used for various purposes—jewelry, dental fillings, and so on—as well as for transactions. The gold standard was common throughout the
world during the late nineteenth century. “And how would you like your funny money?”
Dr
awing by Bernard Schoenbaum; © 1979
The New Y
o
rk
User JOEWA:Job EFF01420:6264_ch04:Pg 78:25581#/eps at 100%
*25581*
Wed, Feb 13, 2002 9:08 AMHow Fiat Money Evolves
It is not surprising that some form of commodity money arises to facilitate ex-change: people are willing to accept a commodity currency such as gold because it has intrinsic value.The development of fiat money, however, is more perplexing. What would make people begin to value something that is intrinsically useless?
To understand how the evolution from commodity money to fiat money takes place, imagine an economy in which people carry around bags of gold. When a purchase is made, the buyer measures out the appropriate amount of gold. If the seller is convinced that the weight and purity of the gold are right, the buyer and seller make the exchange.
The government might first get involved in the monetary system to help people reduce transaction costs. Using raw gold as money is costly because it takes time to verify the purity of the gold and to measure the correct quantity.To reduce these costs, the government can mint gold coins of known purity and weight.The coins are easier to use than gold bullion because their values are widely recognized.
The next step is for the government to accept gold from the public in ex-change for gold certificates—pieces of paper that can be redeemed for a certain
C A S E S T U D Y
Money in a POW Camp
An unusual form of commodity money developed in some Nazi prisoner of war (POW) camps during World War II.The Red Cross supplied the prisoners with various goods—food, clothing, cigarettes, and so on.Yet these rations were allo-cated without close attention to personal preferences, so the allocations were often inefficient. One prisoner may have preferred chocolate, while another may have preferred cheese, and a third may have wanted a new shirt. The differing tastes and endowments of the prisoners led them to trade with one another.
Barter proved to be an inconvenient way to allocate these resources, however, because it required the double coincidence of wants. In other words, a barter sys-tem was not the easiest way to ensure that each prisoner received the goods he valued most. Even the limited economy of the POW camp needed some form of money to facilitate transactions.
Eventually, cigarettes became the established “currency’’ in which prices were quoted and with which trades were made. A shirt, for example, cost about 80 cigarettes. Services were also quoted in cigarettes: some prisoners offered to do other prisoners’ laundry for 2 cigarettes per garment. Even nonsmokers were happy to accept cigarettes in exchange, knowing they could trade the cigarettes in the future for some good they did enjoy. Within the POW camp the cigarette became the store of value, the unit of account, and the medium of exchange.1
1R. A. Radford, “The Economic Organisation of a P.O.W. Camp,’’Economica(November 1945):
quantity of gold. If people believe the government’s promise to redeem the paper bills for gold, the bills are just as valuable as the gold itself. In addition, because the bills are lighter than gold (and gold coins), they are easier to use in transac-tions. Eventually, no one carries gold around at all, and these gold-backed gov-ernment bills become the monetary standard.
Finally, the gold backing becomes irrelevant. If no one ever bothers to redeem the bills for gold, no one cares if the option is abandoned. As long as everyone continues to accept the paper bills in exchange, they will have value and serve as money. Thus, the system of commodity money evolves into a system of fiat money. Notice that in the end, the use of money in exchange is a social conven-tion: everyone values fiat money because they expect everyone else to value it.
C A S E S T U D Y
Money and Social Conventions on the Island of Yap
The economy of Yap, a small island in the Pacific, once had a type of money that was something between commodity and fiat money. The traditional medium of exchange in Yap was fei, stone wheels up to 12 feet in diameter.These stones had holes in the center so that they could be carried on poles and used for exchange. Large stone wheels are not a convenient form of money. The stones were heavy, so it took substantial effort for a new owner to take his fei home after completing a transaction. Although the monetary system facilitated exchange, it did so at great cost.
Eventually, it became common practice for the new owner of the fei not to bother to take physical possession of the stone. Instead, the new owner accepted a claim to the fei without moving it. In future bargains, he traded this claim for goods that he wanted. Having physical possession of the stone became less im-portant than having legal claim to it.
This practice was put to a test when a valuable stone was lost at sea during a storm. Because the owner lost his money by accident rather than through negli-gence, everyone agreed that his claim to the feiremained valid. Even generations later, when no one alive had ever seen this stone, the claim to this feiwas still val-ued in exchange.2
2Norman Angell,The Story of Money(New York: Frederick A. Stokes Company, 1929), 88–89.
How the Quantity of Money Is Controlled
User JOEWA:Job EFF01420:6264_ch04:Pg 80:25583#/eps at 100%
*25583*
Wed, Feb 13, 2002 9:08 AMIn the United States and many other countries, monetary policy is delegated to a partially independent institution called the central bank.The central bank of the United States is the Federal Reserve—often called the Fed. If you look at
a U.S. dollar bill, you will see that it is called a Federal Reserve Note. Decisions over
monetary policy are made by the Federal Open Market Committee. This com-mittee is made up of members of the Federal Reserve Board, who are appointed by the president and confirmed by Congress, together with the presidents of the regional Federal Reserve Banks. The Federal Open Market Committee meets about every six weeks to discuss and set monetary policy.
The primary way in which the Fed controls the supply of money is through open-market operations—the purchase and sale of government bonds.When the Fed wants to increase the money supply, it uses some of the dollars it has to buy government bonds from the public. Because these dollars leave the Fed and enter into the hands of the public, the purchase increases the quantity of money in circulation. Conversely, when the Fed wants to decrease the money supply, it sells some government bonds from its own portfolio. This open-market sale of bonds takes some dollars out of the hands of the public and, thus, decreases the quantity of money in circulation.
In Chapter 18 we discuss in detail how the Fed controls the supply of money. For our current discussion, these details are not crucial. It is sufficient to assume that the Fed (or any other central bank) directly controls the supply of money.
How the Quantity of Money Is Measured
One goal of this chapter is to determine how the money supply affects the econ-omy; we turn to that problem in the next section. As background for that analy-sis, let’s first discuss how economists measure the quantity of money.
Because money is the stock of assets used for transactions, the quantity of money is the quantity of those assets. In simple economies, this quantity is easy to measure. In the POW camp, the quantity of money was the quantity of cigarettes in the camp. But how can we measure the quantity of money in more complex economies such as ours? The answer is not obvious, because no single asset is used for all transactions. People can use various assets, such as cash or checks, to make transactions, although some assets are more convenient than others. This ambiguity leads to numerous measures of the quantity of money.
The most obvious asset to include in the quantity of money is currency, the sum of outstanding paper money and coins. Most day-to-day transactions use currency as the medium of exchange.
A second type of asset used for transactions is demand deposits, the funds
people hold in their checking accounts. If most sellers accept personal checks, as-sets in a checking account are almost as convenient as currency. In both cases, the assets are in a form ready to facilitate a transaction. Demand deposits are, there-fore, added to currency when measuring the quantity of money.
Because it is hard to judge which assets should be included in the money stock, various measures are available.Table 4-1 presents the four measures of the money stock that the Federal Reserve calculates for the U.S. economy, together with a list of which assets are included in each measure. From the smallest to the
largest, they are designated C,M1,M2, and M3.The most common measures for
studying the effects of money on the economy are M1 and M2.There is no
con-sensus, however, about which measure of the money stock is best. Disagreements about monetary policy sometimes arise because different measures of money are moving in different directions.
4-2
The Quantity Theory of Money
Having defined what money is and described how it is controlled and measured,
we can now examine how the quantity of money affects the economy.To do this, we must see how the quantity of money is related to other economic variables, such as prices and incomes.
Amount in March 2001
Symbol Assets Included (billions of dollars)
C Currency $ 539
M1 Currency plus demand deposits, 1,111
traveler’s checks, and other checkable deposits
M2 M1 plus retail money market mutual 5,100
fund balances, saving deposits (including money market deposit accounts), and small time deposits
M3 M2 plus large time deposits, 7,326
repurchase agreements, Eurodollars, and institution-only money market mutual fund balances
Source:Federal Reserve.
The Measures of Money
t a b l e 4 - 1
User JOEWA:Job EFF01420:6264_ch04:Pg 82:25585#/eps at 100%
*25585*
Wed, Feb 13, 2002 9:08 AMTransactions and the Quantity Equation
People hold money to buy goods and services. The more money they need for such transactions, the more money they hold.Thus, the quantity of money in the economy is related to the number of dollars exchanged in transactions.
The link between transactions and money is expressed in the following equa-tion, called the quantity equation:
Money× Velocity =Price ×Transactions
M × V = P × T.
Let’s examine each of the four variables in this equation.
The right-hand side of the quantity equation tells us about transactions.
Trepresents the total number of transactions during some period of time, say, a year. In other words,T is the number of times in a year that goods or ser-vices are exchanged for money.P is the price of a typical transaction—the number of dollars exchanged. The product of the price of a transaction and the number of transactions,PT, equals the number of dollars exchanged in a year.
The left-hand side of the quantity equation tells us about the money used to make the transactions.Mis the quantity of money.Vis called the transactions velocity of money and measures the rate at which money circulates in the economy. In other words, velocity tells us the number of times a dollar bill changes hands in a given period of time.
For example, suppose that 60 loaves of bread are sold in a given year at $0.50 per loaf.Then Tequals 60 loaves per year, and Pequals $0.50 per loaf.The total number of dollars exchanged is
PT=$0.50/loaf ×60 loaves/year =$30/year.
The right-hand side of the quantity equation equals $30 per year, which is the dollar value of all transactions.
Suppose further that the quantity of money in the economy is $10. By rear-ranging the quantity equation, we can compute velocity as
V= PT/M
= ($30/year)/($10) = 3 times per year.
That is, for $30 of transactions per year to take place with $10 of money, each dollar must change hands 3 times per year.
From Transactions to Income
When studying the role of money in the economy, economists usually use a slightly different version of the quantity equation than the one just introduced. The problem with the first equation is that the number of transactions is difficult to measure.To solve this problem, the number of transactions Tis replaced by the
total output of the economy Y.
Transactions and output are related, because the more the economy produces, the more goods are bought and sold.They are not the same, however.When one person sells a used car to another person, for example, they make a transaction using money, even though the used car is not part of current output. Nonethe-less, the dollar value of transactions is roughly proportional to the dollar value of output.
If Ydenotes the amount of output and Pdenotes the price of one unit of
out-put, then the dollar value of output is PY. We encountered measures for these
variables when we discussed the national income accounts in Chapter 2:Y is
real GDP,Pis the GDP deflator, and PYis nominal GDP. The quantity equation
becomes
Money× Velocity =Price ×Output
M × V = P × Y.
Because Yis also total income,Vin this version of the quantity equation is called
the income velocity of money. The income velocity of money tells us the number of times a dollar bill enters someone’s income in a given period of time. This version of the quantity equation is the most common, and it is the one we use from now on.
The Money Demand Function and the Quantity Equation
When we analyze how money affects the economy, it is often useful to express the quantity of money in terms of the quantity of goods and services it can buy. This amount,M/P, is called real money balances.
Real money balances measure the purchasing power of the stock of money. For example, consider an economy that produces only bread. If the quantity of money is $10, and the price of a loaf is $0.50, then real money balances are 20 loaves of bread.That is, at current prices, the stock of money in the economy is able to buy 20 loaves.
A money demand functionis an equation that shows what determines the quantity of real money balances people wish to hold. A simple money demand function is
(M/P)d=kY,
where k is a constant that tells us how much money people want to hold for
User JOEWA:Job EFF01420:6264_ch04:Pg 84:25587#/eps at 100%
*25587*
Wed, Feb 13, 2002 9:09 AM The money demand function is like the demand function for a particulargood. Here the “good’’is the convenience of holding real money balances. Just as owning an automobile makes it easier for a person to travel, holding money makes it easier to make transactions. Therefore, just as higher income leads to a greater demand for automobiles, higher income also leads to a greater demand for real money balances.
This money demand function offers another way to view the quantity equa-tion. To see this, add to the money demand function the condition that the de-mand for real money balances (M/P)dmust equal the supply M/P.Therefore,
M/P=kY.
A simple rearrangement of terms changes this equation into
M(1/k) =PY,
which can be written as
MV=PY,
where V=1/k. This simple mathematics shows the link between the demand
for money and the velocity of money. When people want to hold a lot of money for each dollar of income (k is large), money changes hands
infre-quently (Vis small). Conversely, when people want to hold only a little money
(k is small), money changes hands frequently (V is large). In other words, the
money demand parameter kand the velocity of money Vare opposite sides of
the same coin.
The Assumption of Constant Velocity
The quantity equation can be viewed as a definition: it defines velocity Vas the
ratio of nominal GDP,PY, to the quantity of money M.Yet if we make the
addi-tional assumption that the velocity of money is constant, then the quantity equa-tion becomes a useful theory of the effects of money, called the quantity theory of money.
As with many of the assumptions in economics, the assumption of constant velocity is only an approximation to reality.Velocity does change if the money demand function changes. For example, when automatic teller machines were introduced, people could reduce their average money holdings, which meant a fall in the money demand parameter kand an increase in velocity V.
Nonethe-less, experience shows that the assumption of constant velocity provides a good approximation in many situations. Let’s therefore assume that velocity is constant and see what this assumption implies about the effects of the money supply on the economy.
Once we assume that velocity is constant, the quantity equation can be seen as a theory of what determines nominal GDP. The quantity equation says
where the bar over V means that velocity is fixed. Therefore, a change in the quantity of money (M) must cause a proportionate change in nominal GDP (PY). That is, if velocity is fixed, the quantity of money determines the dollar value of the economy’s output.
Money, Prices, and Inflation
We now have a theory to explain what determines the economy’s overall level of prices.The theory has three building blocks:
1.The factors of production and the production function determine the level
of output Y.We borrow this conclusion from Chapter 3.
2.The money supply determines the nominal value of output,PY.This
conclu-sion follows from the quantity equation and the assumption that the velocity of money is fixed.
3.The price level Pis then the ratio of the nominal value of output,PY, to the
level of output Y.
In other words, the productive capability of the economy determines real GDP, the quantity of money determines nominal GDP, and the GDP deflator is the ratio of nominal GDP to real GDP.
This theory explains what happens when the Fed changes the supply of money. Because velocity is fixed, any change in the supply of money leads to a proportionate change in nominal GDP. Because the factors of production and the production function have already determined real GDP, the change in nomi-nal GDP must represent a change in the price level. Hence, the quantity theory implies that the price level is proportional to the money supply.
Because the inflation rate is the percentage change in the price level, this the-ory of the price level is also a thethe-ory of the inflation rate.The quantity equation, written in percentage-change form, is
% Change in M+% Change in V=% Change in P+% Change in Y.
Consider each of these four terms. First, the percentage change in the quantity of money M is under the control of the central bank. Second, the percentage change in velocity Vreflects shifts in money demand; we have assumed that ve-locity is constant, so the percentage change in veve-locity is zero.Third, the percent-age change in the price level P is the rate of inflation; this is the variable in the equation that we would like to explain. Fourth, the percentage change in output Ydepends on growth in the factors of production and on technological progress, which for our present purposes we can take as given. This analysis tells us that (except for a constant that depends on exogenous growth in output) the growth in the money supply determines the rate of inflation.
User JOEWA:Job EFF01420:6264_ch04:Pg 86:25589#/eps at 100%
*25589*
Wed, Feb 13, 2002 9:09 AMC A S E S T U D Y
Inflation and Money Growth
“Inflation is always and everywhere a monetary phenomenon.’’So wrote Milton Friedman, the great economist who won the Nobel Prize in economics in 1976. The quantity theory of money leads us to agree that the growth in the quantity of money is the primary determinant of the inflation rate.Yet Friedman’s claim is empirical, not theoretical. To evaluate his claim, and to judge the usefulness of our theory, we need to look at data on money and prices.
Friedman, together with fellow economist Anna Schwartz, wrote two treatises on monetary history that documented the sources and effects of changes in the quantity of money over the past century.3Figure 4-1 uses some of their data and
3
Milton Friedman and Anna J. Schwartz,A Monetary History of the United States, 1867–1960 (Princeton, NJ: Princeton University Press, 1963); Milton Friedman and Anna J. Schwartz, Mone-tary Trends in the United States and the United Kingdom: Their Relation to Income, Prices, and Interest Rates, 1867–1975(Chicago: University of Chicago Press, 1982).
f i g u r e 4 - 1
Historical Data on U.S. Inflation and Money Growth In this scatterplot of money growth and inflation, each point represents a decade. The horizontal axis shows the average growth in the money supply (as measured by M2) over the decade, and the vertical axis shows the average rate of inflation (as measured by the GDP defl a-tor). The positive correlation between money growth and inflation is evidence for the quantity theory’s prediction that high money growth leads to high inflation.
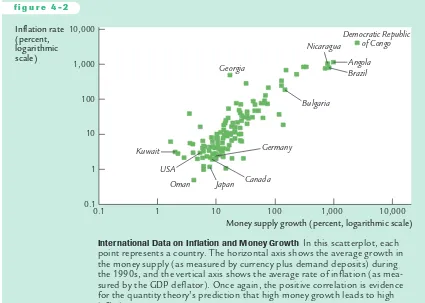
Figure 4-2 examines the same question with international data. It shows the average rate of inflation and the average rate of money growth in more than 100 countries during the 1990s.Again, the link between money growth and inflation is clear. Countries with high money growth tend to have high inflation, and countries with low money growth tend to have low inflation.
If we looked at monthly data on money growth and inflation, rather than data for 10-year periods, we would not see as close a connection between these two variables. This theory of inflation works best in the long run, not in the short run. We examine the short-run impact of changes in the quantity of money when we turn to economic fluctuations in Part IV of this book.
f i g u r e 4 - 2
Inflation rate (percent, logarithmic scale)
1,000 10,000
100
10
1
0.1
Money supply growth (percent, logarithmic scale)
0.1 1 10 100 1,000 10,000
Nicaragua Angola Brazil
Bulgaria Georgia
Kuwait USA
Japan Canada Germany
Oman
Democratic Republic of Congo
International Data on Inflation and Money Growth In this scatterplot, each point represents a country. The horizontal axis shows the average growth in the money supply (as measured by currency plus demand deposits) during the 1990s, and the vertical axis shows the average rate of inflation (as mea-sured by the GDP deflator). Once again, the positive correlation is evidence for the quantity theory’s prediction that high money growth leads to high inflation.
Source:International Financial Statistics.
User JOEWA:Job EFF01420:6264_ch04:Pg 88:25591#/eps at 100%
*25591*
Wed, Feb 13, 2002 9:09 AM4-3
Seigniorage: The Revenue From
Printing Money
So far, we have seen how growth in the money supply causes inflation. But what might ever induce the government to increase the money supply? Here we ex-amine one answer to this question.
Let’s start with an indisputable fact: all governments spend money. Some of this spending is to buy goods and services (such as roads and police), and some is to provide transfer payments (for the poor and elderly, for example). A govern-ment can finance its spending in three ways. First, it can raise revenue through taxes, such as personal and corporate income taxes. Second, it can borrow from the public by selling government bonds.Third, it can print money.
The revenue raised through the printing of money is called seigniorage.The term comes from seigneur,the French word for “feudal lord.”In the Middle Ages, the lord had the exclusive right on his manor to coin money.Today this right be-longs to the central government, and it is one source of revenue.
When the government prints money to finance expenditure, it increases the money supply.The increase in the money supply, in turn, causes inflation. Print-ing money to raise revenue is like imposPrint-ing an inflation tax.
At first it may not be obvious that inflation can be viewed as a tax.After all, no one receives a bill for this tax—the government merely prints the money it needs. Who then pays the inflation tax? The answer is the holders of money. As prices rise, the real value of the money in your wallet falls.When the government prints new money for its use, it makes the old money in the hands of the public less valuable.Thus, inflation is like a tax on holding money.
The amount raised by printing money varies from country to country. In the United States, the amount has been small: seigniorage has usually accounted for less than 3 percent of government revenue. In Italy and Greece, seigniorage has often been more than 10 percent of government revenue.4 In countries experi-encing hyperinflation, seigniorage is often the government’s chief source of revenue—indeed, the need to print money to finance expenditure is a primary cause of hyperinflation.
C A S E S T U D Y
Paying for the American Revolution
Although seigniorage has not been a major source of revenue for the U.S. gov-ernment in recent history, the situation was very different two centuries ago. Be-ginning in 1775 the Continental Congress needed to find a way to finance the Revolution, but it had limited ability to raise revenue through taxation. It, there-fore, relied on the printing of fiat money to help pay for the war.
The Continental Congress’s reliance on seigniorage increased over time. In 1775 new issues of continental currency were about $6 million. This amount
4
4-4
Inflation and Interest Rates
As we first discussed in Chapter 3, interest rates are among the most important macroeconomic variables. In essence, they are the prices that link the present and the future. Here we discuss the relationship between inflation and interest rates.
Two Interest Rates: Real and Nominal
Suppose you deposit your savings in a bank account that pays 8 percent interest annually. Next year, you withdraw your savings and the accumulated interest.Are you 8 percent richer than you were when you made the deposit a year earlier?
The answer depends on what “richer’’means. Certainly, you have 8 percent more dollars than you had before. But if prices have risen, so that each dollar buys less, then your purchasing power has not risen by 8 percent. If the inflation rate was 5 percent, then the amount of goods you can buy has increased by only 3 percent. And if the inflation rate was 10 percent, then your purchasing power has fallen by 2 percent.
Economists call the interest rate that the bank pays the nominal interest rate and the increase in your purchasing power the real interest rate. If i
de-notes the nominal interest rate,rthe real interest rate, and
p
the rate of inflation, then the relationship among these three variables can be written asr=i−
p
.The real interest rate is the difference between the nominal interest rate and the rate of inflation.5
The Fisher Effect
Rearranging the terms in our equation for the real interest rate, we can show that the nominal interest rate is the sum of the real interest rate and the inflation rate:
i=r+
p
.increased to $19 million in 1776, $13 million in 1777, $63 million in 1778, and $125 million in 1779.
Not surprisingly, this rapid growth in the money supply led to massive infl a-tion.At the end of the war, the price of gold measured in continental dollars was more than 100 times its level of only a few years earlier.The large quantity of the continental currency made the continental dollar nearly worthless. This experi-ence also gave birth to a once-popular expression: people used to say something was “not worth a continental,’’meaning that the item had little real value.
5Mathematical note:This equation relating the real interest rate, nominal interest rate, and inflation rate
is only an approximation.The exact formula is (1 +r) =(1 +i)/(1 +
User JOEWA:Job EFF01420:6264_ch04:Pg 90:25593#/eps at 100%
*25593*
Wed, Feb 13, 2002 9:09 AM The equation written in this way is called the Fisher equation, after economistIrving Fisher (1867–1947). It shows that the nominal interest rate can change for two reasons: because the real interest rate changes or because the inflation rate changes.
Once we separate the nominal interest rate into these two parts, we can use this equation to develop a theory that explains the nominal interest rate. Chapter 3 showed that the real interest rate adjusts to equilibrate saving and investment. The quantity theory of money shows that the rate of money growth determines the rate of inflation.The Fisher equation then tells us to add the real interest rate and the inflation rate together to determine the nominal interest rate.
The quantity theory and the Fisher equation together tell us how money growth affects the nominal interest rate.According to the quantity theory, an increase in the rate of money growth of 1 percent causes a 1-percent increase in the rate of inflation. According to the Fisher equation, a 1-percent increase in the rate of inflation in turn causes a 1-percent increase in the nominal interest rate. The one-for-one relation between the inflation rate and the nominal interest rate is called the Fisher effect.
C A S E S T U D Y
Inflation and Nominal Interest Rates
How useful is the Fisher effect in explaining interest rates? To answer this ques-tion we look at two types of data on inflation and nominal interest rates.
f i g u r e 4 - 3
Percent
16
14
12
10
8
6
4
2
0
⫺2
Nominal interest rate
Inflation rate
1950 1955 1960 1965 1970
Year
1975 1980 1985 1990 1995 2000
Inflation and Nominal Interest Rates Over Time This figure plots the nominal interest rate (on three-month Treasury bills) and the inflation rate (as measured by the CPI) in the United States since 1954. It shows the Fisher effect: higher inflation leads to a higher nominal interest rate.
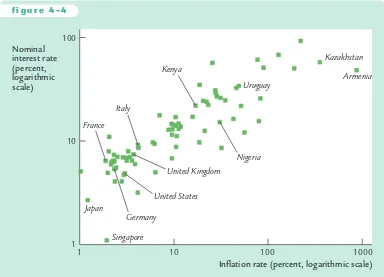
Similar support for the Fisher effect comes from examining the variation across countries.As Figure 4-4 shows, a nation’s inflation rate and its nominal in-terest rate are related. Countries with high inflation tend to have high nominal interest rates as well, and countries with low inflation tend to have low nominal interest rates.
The link between inflation and interest rates is well known to Wall Street in-vestment firms. Because bond prices move inversely with interest rates, one can get rich by predicting correctly the direction in which interest rates will move. Many Wall Street firms hire Fed watchers to monitor monetary policy and news about inflation in order to anticipate changes in interest rates.
f i g u r e 4 - 4
Inflation rate (percent, logarithmic scale) Nominal
interest rate (percent, logarithmic scale)
100
10
1
1 10 100 1000
Kenya
Kazakhstan
Armenia
Nigeria Uruguay
United Kingdom
United States
Singapore Germany Japan
France Italy
Inflation and Nominal Interest Rates Across Countries This scatterplot exhibits the average nominal interest rate on short-term Treasury bills and the average inflation rate in 77 countries during the 1990s. The positive correlation between the inflation rate and the nominal interest rate is evidence for the Fisher effect.
Source:International Financial Statistics.
User JOEWA:Job EFF01420:6264_ch04:Pg 92:25595#/eps at 100%
*25595*
Wed, Feb 13, 2002 9:09 AMTwo Real Interest Rates:
Ex Ante
and
Ex Post
When a borrower and lender agree on a nominal interest rate, they do not know what the inflation rate over the term of the loan will be. Therefore, we must distinguish between two concepts of the real interest rate: the real inter-est rate the borrower and lender expect when the loan is made, called the ex ante real interest rate, and the real interest rate actually realized, called the ex
post real interest rate.
Although borrowers and lenders cannot predict future inflation with cer-tainty, they do have some expectation of the inflation rate. Let
p
denote actualfuture inflation and
p
ethe expectation of future inflation.The ex anterealinter-est rate is i−
p
e, and the ex postreal interest rate is i−p
.The two real interest rates differ when actual inflationp
differs from expected inflationp
e.How does this distinction between actual and expected inflation modify the Fisher effect? Clearly, the nominal interest rate cannot adjust to actual inflation, because actual inflation is not known when the nominal interest rate is set.The nominal interest rate can adjust only to expected inflation. The Fisher effect is more precisely written as
i=r+
p
e.The ex ante real interest rate r is determined by equilibrium in the market for goods and services, as described by the model in Chapter 3.The nominal interest rate imoves one-for-one with changes in expected inflation
p
e.C A S E S T U D Y
Nominal Interest Rates in the Nineteenth Century
Although recent data show a positive relationship between nominal interest rates and inflation rates, this finding is not universal. In data from the late nineteenth and early twentieth centuries, high nominal interest rates did not accompany high inflation. The apparent absence of any Fisher effect during this time puzzled Irving Fisher. He suggested that inflation “caught merchants napping.’’
How should we interpret the absence of an apparent Fisher effect in nine-teenth-century data? Does this period of history provide evidence against the adjustment of nominal interest rates to inflation? Recent research suggests that this period has little to tell us about the validity of the Fisher effect.The reason is that the Fisher effect relates the nominal interest rate to expected inflation and, according to this research, inflation at this time was largely unexpected.
4-5
The Nominal Interest Rate and the
Demand for Money
The quantity theory is based on a simple money demand function: it assumes that the demand for real money balances is proportional to income.Although the quantity theory is a good place to start when analyzing the effects of money on the economy, it is not the whole story. Here we add another determinant of the quantity of money demanded—the nominal interest rate.
The Cost of Holding Money
The money you hold in your wallet does not earn interest. If, instead of holding that money, you used it to buy government bonds or deposited it in a savings ac-count, you would earn the nominal interest rate.The nominal interest rate is the opportunity cost of holding money: it is what you give up by holding money rather than bonds.
Another way to see that the cost of holding money equals the nominal inter-est rate is by comparing the real returns on alternative assets. Assets other than money, such as government bonds, earn the real return r. Money earns an ex-pected real return of −
p
e, because its real value declines at the rate of inflation.When you hold money, you give up the difference between these two returns. Thus, the cost of holding money is r−(−
p
e), which the Fisher equation tells us isthe nominal interest rate i.
Just as the quantity of bread demanded depends on the price of bread, the quantity of money demanded depends on the price of holding money. Hence, the demand for real money balances depends both on the level of income and on the nominal interest rate.We write the general money demand function as
(M/P)d=L(i,Y).
The letter Lis used to denote money demand because money is the economy’s most liquid asset (the asset most easily used to make transactions).This equation states that the demand for the liquidity of real money balances is a function of
6Robert B. Barsky,“The Fisher Effect and the Forecastability and Persistence of Inflation,’’Journal
of Monetary Economics19 (January 1987): 3–24.
User JOEWA:Job EFF01420:6264_ch04:Pg 94:25597#/eps at 100%
*25597*
Wed, Feb 13, 2002 9:09 AMincome and the nominal interest rate. The higher the level of income Y, the
greater the demand for real money balances. The higher the nominal interest rate i, the lower the demand for real money balances.
Future Money and Current Prices
Money, prices, and interest rates are now related in several ways. Figure 4-5 illus-trates the linkages we have discussed. As the quantity theory of money explains, money supply and money demand together determine the equilibrium price level. Changes in the price level are, by definition, the rate of inflation. Inflation, in turn, affects the nominal interest rate through the Fisher effect. But now, be-cause the nominal interest rate is the cost of holding money, the nominal interest rate feeds back to affect the demand for money.
Consider how the introduction of this last link affects our theory of the price level. First, equate the supply of real money balances M/Pto the demand L(i,Y):
M/P=L(i,Y).
Next, use the Fisher equation to write the nominal interest rate as the sum of the real interest rate and expected inflation:
M/P=L(r+
p
e,Y).This equation states that the level of real money balances depends on the ex-pected rate of inflation.
f i g u r e 4 - 5
Inflation Rate Price
Level Money
Supply
Money Demand
Nominal Interest Rate
The last equation tells a more sophisticated story than the quantity theory about the determination of the price level. The quantity theory of money says that today’s money supply determines today’s price level.This conclusion remains partly true: if the nominal interest rate and the level of output are held constant, the price level moves proportionately with the money supply. Yet the nominal interest rate is not constant; it depends on expected inflation, which in turn de-pends on growth in the money supply.The presence of the nominal interest rate in the money demand function yields an additional channel through which money supply affects the price level.
This general money demand equation implies that the price level depends not only on today’s money supply but also on the money supply expected in the future.To see why, suppose the Fed announces that it will raise the money supply in the future, but it does not change the money supply today. This an-nouncement causes people to expect higher money growth and higher infla-tion. Through the Fisher effect, this increase in expected inflation raises the nominal interest rate.The higher nominal interest rate reduces the demand for real money balances. Because the quantity of money has not changed, the re-duced demand for real money balances leads to a higher price level. Hence, higher expected money growth in the future leads to a higher price level today.
The effect of money on prices is complex. The appendix to this chapter works out the mathematics relating the price level to current and future money. The conclusion of the analysis is that the price level depends on a weighted average of the current money supply and the money supply ex-pected to prevail in the future.
4-6
The Social Costs of Inflation
Our discussion of the causes and effects of inflation does not tell us much about the social problems that result from inflation.We turn to those problems now.
The Layman
’
s View and the Classical Response
If you ask the average person why inflation is a social problem, he will probably answer that inflation makes him poorer.“Each year my boss gives me a raise, but prices go up and that takes some of my raise away from me.’’The implicit as-sumption in this statement is that if there were no inflation, he would get the same raise and be able to buy more goods.
User JOEWA:Job EFF01420:6264_ch04:Pg 96:25599#/eps at 100%
*25599*
Wed, Feb 13, 2002 9:09 AMinflation slowed,firms would increase the prices of their products less each year and, as a result, would give their workers smaller raises.
According to the classical theory of money, a change in the overall price level is like a change in the units of measurement. It is as if we switched from measuring distances in feet to measuring them in inches: numbers get larger, but nothing really changes. Imagine that tomorrow morning you wake up and find that, for some reason, all dollar figures in the economy have been multi-plied by ten.The price of everything you buy has increased tenfold, but so has your wage and the value of your savings. What difference would this make? All numbers would have an extra zero at the end, but nothing else would change.Your economic well-being depends on relative prices, not the overall price level.
Why, then, is a persistent increase in the price level a social problem? It turns out that the costs of inflation are subtle. Indeed, economists disagree about the size of the social costs. To the surprise of many laymen, some economists argue that the costs of inflation are small—at least for the moderate rates of inflation that most countries have experienced in recent years.7
7
See, for example, Chapter 2 of Alan Blinder,Hard Heads, Soft Hearts:Tough-Minded Economics for a Just Society(Reading, MA: Addison Wesley, 1987).
C A S E S T U D Y
What Economists and the Public Say About Inflation
As we have been discussing, laymen and economists hold very different views about the costs of inflation. Economist Robert Shiller has documented this dif-ference of opinion in a survey of the two groups.The survey results are striking, for they show how the study of economics changes a person’s attitudes.
In one question, Shiller asked people whether their “biggest gripe about infl a-tion”was that “inflation hurts my real buying power, it makes me poorer.”Of the general public, 77 percent agreed with this statement, compared to only 12 percent of economists. Shiller also asked people whether they agreed with the following statement:“When I see projections about how many times more a col-lege education will cost, or how many times more the cost of living will be in coming decades, I feel a sense of uneasiness; these inflation projections really make me worry that my own income will not rise as much as such costs will.”
Among the general public, 66 percent said they fully agreed with this statement, while only 5 percent of economists agreed with it.
The Costs of Expected Inflation
Consider first the case of expected inflation. Suppose that every month the price level rose by 1 percent.What would be the social costs of such a steady and pre-dictable 12-percent annual inflation?
One cost is the distortion of the inflation tax on the amount of money people hold. As we have already discussed, a higher inflation rate leads to a higher nominal interest rate, which in turn leads to lower real money bal-ances. If people are to hold lower money balances on average, they must make more frequent trips to the bank to withdraw money—for example, they might withdraw $50 twice a week rather than $100 once a week. The incon-venience of reducing money holding is metaphorically called the shoe-leather cost of inflation, because walking to the bank more often causes one’s shoes to wear out more quickly.
A second cost of inflation arises because high inflation induces firms to change their posted prices more often. Changing prices is sometimes costly: for example, it may require printing and distributing a new catalog. These costs are called menu costs, because the higher the rate of inflation, the more often restaurants have to print new menus.
A third cost of inflation arises because firms facing menu costs change prices infrequently; therefore, the higher the rate of inflation, the greater the variability in relative prices. For example, suppose a firm issues a new catalog every January. If there is no inflation, then the firm’s prices relative to the overall price level are constant over the year.Yet if inflation is 1 percent per month, then from the be-ginning to the end of the year the firm’s relative prices fall by 12 percent. Sales from this catalog will tend to be low early in the year (when its prices are rela-tively high) and high later in the year (when its prices are relarela-tively low). Hence, when inflation induces variability in relative prices, it leads to microeconomic inefficiencies in the allocation of resources.
8 Robert J. Shiller,“Why Do People Dislike Inflation?”in Christina D. Romer and David H.
Romer, eds.,Reducing Inflation: Motivation and Strategy (Chicago: University of Chicago Press, 1997).
The public’s distaste for inflation may be psychological. Shiller asked those surveyed if they agreed with the following statement:“I think that if my pay went up I would feel more satisfaction in my job, more sense of fulfillment, even if prices went up just as much.”Of the public, 49 percent fully or partly agreed with this statement, compared to 8 percent of economists.
User JOEWA:Job EFF01420:6264_ch04:Pg 98:25601#/eps at 100%
*25601*
Wed, Feb 13, 2002 9:09 AMA fourth cost of inflation results from the tax laws. Many provisions of the tax code do not take into account the effects of inflation. Inflation can alter individ-uals’ tax liability, often in ways that lawmakers did not intend.
One example of the failure of the tax code to deal with inflation is the tax treatment of capital gains. Suppose you buy some stock today and sell it a year from now at the same real price. It would seem reasonable for the government not to levy a tax, because you have earned no real income from this investment. Indeed, if there is no inflation, a zero tax liability would be the outcome. But suppose the rate of inflation is 12 percent and you initially paid $100 per share for the stock; for the real price to be the same a year later, you must sell the stock for $112 per share. In this case the tax code, which ignores the effects of inflation, says that you have earned $12 per share in income, and the government taxes you on this capital gain. The problem, of course, is that the tax code measures income as the nominal rather than the real capital gain. In this example, and in many oth-ers, inflation distorts how taxes are levied.
A fifth cost of inflation is the inconvenience of living in a world with a chang-ing price level. Money is the yardstick with which we measure economic trans-actions.When there is inflation, that yardstick is changing in length.To continue the analogy, suppose that Congress passed a law specifying that a yard would equal 36 inches in 2002, 35 inches in 2003, 34 inches in 2004, and so on. Although the law would result in no ambiguity, it would be highly inconvenient.When some-one measured a distance in yards, it would be necessary to specify whether the measurement was in 2002 yards or 2003 yards; to compare distances measured in different years, one would need to make an “inflation’’ correction. Similarly, the dollar is a less useful measure when its value is always changing.
For example, a changing price level complicates personal financial planning. One important decision that all households face is how much of their income to consume today and how much to save for retirement. A dollar saved today and invested at a fixed nominal interest rate will yield a fixed dollar amount in the fu-ture.Yet the real value of that dollar amount—which will determine the retiree’s living standard—depends on the future price level. Deciding how much to save would be much simpler if people could count on the price level in 30 years being similar to its level today.
The Costs of Unexpected Inflation
Consider, for example, a person taking out a mortgage in 1960. At the time, a 30-year mortgage had an interest rate of about 6 percent per year.This rate was based on a low rate of expected inflation—inflation over the previous decade had averaged only 2.5 percent. The creditor probably expected to receive a real return of about 3.5 percent, and the debtor expected to pay this real return. In fact, over the life of the mortgage, the inflation rate averaged 5 percent, so the ex post real return was only 1 percent. This unanticipated inflation benefited the debtor at the expense of the creditor.
Unanticipated inflation also hurts individuals on fixed pensions. Workers and
firms often agree on a fixed nominal pension when the worker retires (or even earlier). Because the pension is deferred earnings, the worker is essentially pro-viding the firm a loan: the worker provides labor services to the firm while young but does not get fully paid until old age. Like any creditor, the worker is hurt when inflation is higher than anticipated. Like any debtor, the firm is hurt when inflation is lower than anticipated.
These situations provide a clear argument against variable inflation.The more variable the rate of inflation, the greater the uncertainty that both debtors and creditors face. Because most people are risk averse—they dislike uncertainty—the unpredictability caused by highly variable inflation hurts almost everyone.
Given these effects of uncertain inflation, it is puzzling that nominal contracts are so prevalent. One might expect debtors and creditors to protect themselves from this uncertainty by writing contracts in real terms—that is, by indexing to some measure of the price level. In economies with high and variable inflation, indexation is often widespread; sometimes this indexation takes the form of writing contracts using a more stable foreign currency. In economies with mod-erate inflation, such as the United States, indexation is less common.Yet even in the United States, some long-term obligations are indexed. For example, Social Security benefits for the elderly are adjusted annually in response to changes in the consumer price index. And in 1997, the U.S. federal government issued inflation-indexed bonds for the first time.
Finally, in thinking about the costs of inflation, it is important to note a widely documented but little understood fact: high inflation is variable inflation.That is, countries with high average inflation also tend to have inflation rates that change greatly from year to year.The implication is that if a country decides to pursue a high-inflation monetary policy, it will likely have to accept highly variable infl a-tion as well. As we have just discussed, highly variable inflation increases uncer-tainty for both creditors and debtors by subjecting them to arbitrary and potentially large redistributions of wealth.
C A S E S T U D Y
The Free Silver Movement, the Election of 1896, and the Wizard of Oz
User JOEWA:Job EFF01420:6264_ch04:Pg 100:25603#/eps at 100%
*25603*
Wed, Feb 13, 2002 9:09 AM9
The movie made 40 years later hid much of the allegory by changing Dorothy’s slippers from silver to ruby. For more on this topic, see Henry M. Littlefield,“The Wizard of Oz: Parable on Pop-ulism,’’American Quarterly16 (Spring 1964): 47–58; and Hugh Rockoff,“The Wizard of Oz as a Monetary Allegory,’’Journal of Political Economy98 (August 1990): 739–760.
United States fell 23 percent. This deflation was good for creditors, primarily the bankers of the Northeast, but it was bad for debtors, primarily the farmers of the South and West. One proposed solution to this problem was to replace the gold standard with a bimetallic standard, under which both gold and silver could be minted into coin. The move to a bimetallic standard would increase the money supply and stop the deflation.
The silver issue dominated the presidential election of 1896.William McKin-ley, the Republican nominee, campaigned on a platform of preserving the gold standard. William Jennings Bryan, the Democratic nominee, supported the bimetallic standard. In a famous speech, Bryan proclaimed,“You shall not press down upon the brow of labor this crown of thorns, you shall not crucify mankind upon a cross of gold.’’Not surprisingly, McKinley was the candidate of the conservative eastern establishment, while Bryan was the candidate of the southern and western populists.
This debate over silver found its most memorable expression in a children’s book,The Wizard of Oz.Written by a midwestern journalist, L. Frank Baum, just after the 1896 election, it tells the story of Dorothy, a girl lost in a strange land far from her home in Kansas. Dorothy (representing traditional American values) makes three friends: a scarecrow (the farmer), a tin woodman (the industrial worker), and a lion whose roar exceeds his might (William Jennings Bryan).To-gether, the four of them make their way along a perilous yellow brick road (the gold standard), hoping to find the Wizard who will help Dorothy return home. Eventually they arrive in Oz (Washington), where everyone sees the world through green glasses (money). The Wizard (William McKinley) tries to be all things to all people but turns out to be a fraud. Dorothy’s problem is solved only when she learns about the magical power of her silver slippers.9
Although the Republicans won the election of 1896 and the United States stayed on a gold standard, the Free Silver advocates got the inflation that they wanted. Around the time of the election, gold was discovered in Alaska, Australia, and South Africa. In addition, gold refiners devised the cyanide process, which facil-itated the extraction of gold from ore.These developments led to increases in the money supply and in prices. From 1896 to 1910 the price level rose 35 percent.
One Benefit of Inflation
So far, we have discussed the many costs of inflation.These costs lead many econ-omists to conclude that monetary policymakers should aim for zero inflation.Yet there is another side to the story. Some economists believe that a little bit of
The argument for moderate inflation starts with the observation that cuts in nominal wages are rare:firms are reluctant to cut their workers’nominal wages, and workers are reluctant to accept such cuts. A 2-percent wage cut in a zero-inflation world is, in real terms, the same as a 3-percent raise with 5-percent
in-flation, but workers do not always see it that way. The 2-percent wage cut may seem like an insult, whereas the 3-percent raise is, after all, still a raise. Empirical studies confirm that nominal wages rarely fall.
This fact suggests that some inflation may make labor markets work better. The supply and demand for different kinds of labor are always changing. Sometimes an increase in supply or decrease in demand leads to a fall in the equilibrium real wage for a group of workers. If nominal wages can’t be cut, then the only way to cut real wages is to allow inflation to do the job.Without inflation, the real wage will be stuck above the equilibrium level, resulting in higher unemployment.
For this reason, some economists argue that inflation “greases the wheels”
of labor markets. Only a little inflation is needed: an inflation rate of 2 percent
FYI
The great economist John Maynard Keynes was no friend of inflation, as this chapter’s opening quotation indicates. Here is the more complete passage from his famous book, The Economic Con-sequences of the Peace, in which Keynes predicted (correctly) that the treaty imposed on Germany after World War I would lead to economic hard-ship and renewed international tensions:
Lenin is said to have declared that the best way to destroy the Capitalist System was to debauch the currency. By a continuing process of inflation, governments can confiscate, secretly and unob-served, an important part of the wealth of their citizens. By this method they not only confiscate, but they confiscate arbitrarily; and, while the process impoverishes many, it actually enriches some. The sight of this arbitrary rearrangement of riches strikes not only at security, but at confi-dence in the equity of the existing distribution of wealth. Those to whom the system brings wind-falls, beyond their deserts and even beyond their expectations or desires, become “profiteers,” who are the object of the hatred of the bourgeoisie,
Keynes (and Lenin) on the Cost of Inflation
whom the inflationism has impoverished, not less than of the proletariat. As the inflation proceeds and the real value of the currency fluctuates wildly from month to month, all permanent relations between debtors and creditors, which form the ultimate foundation of capitalism, become so utterly disordered as to be almost meaningless; and the process of wealth-getting degenerates into a gamble and a lottery.
Lenin was certainly right. There is no subtler, no surer means of overturning the existing basis of society than to debauch the currency. The process engages all the hidden forces of eco-nomic law on the side of destruction, and does it in a manner which not one man in a million is able to diagnose.10
History has given ample support to this assess-ment. A recent example occurred in Russia in 1998, where many citizens saw high rates of in-flation wipe out their ruble-denominated savings. And, as Lenin would have predicted, this infla-tion put the country’s burgeoning capitalist sys-tem in serious jeopardy.
User JOEWA:Job EFF01420:6264_ch04:Pg 102:25605#/eps at 100%
*25605*
Wed, Feb 13, 2002 9:09 AM lets real wages fall by 2 percent per year, or 20 percent per decade, withoutcuts in nominal wages. Such automatic reductions in real wages are impossible with zero inflation.11
4-7
Hyperinflation
Hyperinflation is often defined as inflation that exceeds 50 percent per month, which is just over 1 percent per day. Compounded over many months, this rate of inflation leads to very large increases in the price level. An inflation rate of 50 percent per month implies a more than 100-fold increase in the price level over a year, and a more than 2-million-fold increase over three years. Here we con-sider the costs and causes of such extreme inflation.
The Costs of Hyperinflation
Although economists debate whether the costs of moderate inflation are large or small, no one doubts that hyperinflation extracts a high toll on society. The costs are qualitatively the same as those we discussed earlier. When inflation reaches extreme levels, however, these costs are more apparent because they are so severe.
The shoeleather costs associated with reduced money holding, for instance, are serious under hyperinflation. Business executives devote much time and en-ergy to cash management when cash loses its value quickly. By diverting this time and energy from more socially valuable activities, such as production and investment decisions, hyperinflation makes the economy run less efficiently.
Menu costs also become larger under hyperinflation. Firms have to change prices so often that normal business practices, such as printing and distributing catalogs with fixed prices, become impossible. In one restaurant during the Ger-man hyperinflation of the 1920s, a waiter would stand up on a table every 30 minutes to call out the new prices.
Similarly, relative prices do not do a good job of reflecting true scarcity during hyperinflations. When prices change frequently by large amounts, it is hard for customers to shop around for the best price. Highly volatile and rapidly rising prices can alter behavior in many ways. According to one report, when patrons entered a pub during the German hyperinflation, they would often buy two pitchers of beer. Although the second pitcher would lose value by getting warm over time, it would lose value less rapidly than the money left sitting in the pa-tron’s wallet.
11For a recent paper examining this benefit of inflation, see George A.Akerlof,William T. Dickens,
Tax systems are also distorted by hyperinflation—but in ways that are quite
different than under moderate inflation. In most tax systems there is a delay
be-tween the time a tax is levied and the time the tax is paid to the government. In the United States, for example, taxpayers are required to make estimated income tax payments every three months.This short delay does not matter much under
low inflation. By contrast, during hyperinflation, even a short delay greatly
re-duces real tax revenue. By the time the government gets the money it is due, the
money has fallen in value. As a result, once hyperinflations start, the real tax
rev-enue of the government often falls substantially.
Finally, no one should underestimate the sheer inconvenience of living with
hyperinflation. When carrying money to the grocery store is as burdensome as
carrying the groceries back home, the monetary system is not doing its best to facilitate exchange. The government tries to overcome this problem by adding more and more zeros to the paper currency, but often it cannot keep up with the exploding price level.
Eventually, these costs of hyperinflation become intolerable. Over time,
money loses its role as a store of value, unit of account, and medium of exchange.
Barter becomes more common. And more stable unofficial monies—cigarettes
or the U.S. dollar—start to replace the official money.
C A S E S T U D Y
Life During the Bolivian Hyperinflation
The following article from the Wall Street Journalshows what life was like during
the Bolivian hyperinflation of 1985.12What costs of inflation does this article
emphasize?
Precarious Peso—Amid Wild Inflation, Bolivians Concentrate on Swapping Currency
LA PAZ, Bolivia—When Edgar Miranda gets his monthly teacher’s pay of 25 million pesos, he hasn’t a moment to lose. Every hour, pesos drop in value. So, while his wife rushes to market to lay in a month’s supply of rice and noodles, he is off with the rest of the pesos to change them into black-market dollars.
Mr. Miranda is practicing the First Rule of Survival amid the most out-of-control inflation in the world today. Bolivia is a case study of how runaway inflation un-dermines a society. Price increases are so huge that the figures build up almost be-yond comprehension. In one six-month period, for example, prices soared at an annual rate of 38,000%. By official count, however, last year’s inflation reached 2,000%, and this year’s is expected to hit 8,000%—though other estimates range many times higher. In any event, Bolivia’s rate dwarfs Israel’s 370% and Argentina’s 1,100%—two other cases of severe inflation.
12