Vitamin and mineral
requirements
in human nutrition
(1998 : Bangkok, Thailand).
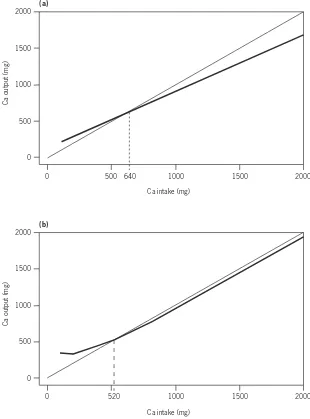
Vitamin and mineral requirements in human nutrition : report of a joint FAO/WHO expert consultation, Bangkok, Thailand, 21–30 September 1998.
1.Vitamins — standards 2.Micronutrients — standards 3.Trace elements — standards 4.Deficiency diseases — diet therapy 5.Nutritional requirements I.Title.
ISBN 92 4 154612 3 (LC/NLM Classification: QU 145)
© World Health Organization and Food and Agriculture Organization of the United Nations 2004
All rights reserved. Publications of the World Health Organization can be obtained from Market-ing and Dissemination, World Health Organization, 20 Avenue Appia, 1211 Geneva 27, Switzerland (tel: +41 22 791 2476; fax: +41 22 791 4857; e-mail: [email protected]). Requests for permis-sion to reproduce or translate WHO publications — whether for sale or for noncommercial distri-bution — should be addressed to Publications, at the above address (fax: +41 22 791 4806; e-mail: [email protected]), or to Chief, Publishing and Multimedia Service, Information Division, Food and Agriculture Organization of the United Nations, 00100 Rome, Italy.
The designations employed and the presentation of the material in this publication do not imply the expression of any opinion whatsoever on the part of the World Health Organization and the Food and Agriculture Organization of the United Nations concerning the legal status of any country, territory, city or area or of its authorities, or concerning the delimitation of its frontiers or boundaries. Dotted lines on maps represent approximate border lines for which there may not yet be full agreement.
The mention of specific companies or of certain manufacturers’ products does not imply that they are endorsed or recommended by the World Health Organization and the Food and Agriculture Organization of the United Nations in preference to others of a similar nature that are not men-tioned. Errors and omissions excepted, the names of proprietary products are distinguished by initial capital letters.
The World Health Organization and the Food and Agriculture Organization of the United Nations do not warrant that the information contained in this publication is complete and correct and shall not be liable for any damages incurred as a result of its use.
Designed by minimum graphics
Foreword xiii
Acknowledgements xvii
1. Concepts, definitions and approaches used to define nutritional
needs and recommendations 1
1.1 Introduction 1
1.2 Definition of terms 2
1.2.1 Estimated average requirement 2
1.2.2 Recommended nutrient intake 2
1.2.3 Apparently healthy 3
1.2.4 Protective nutrient intake 3
1.2.5 Upper tolerable nutrient intake level 4
1.2.6 Nutrient excess 4
1.2.7 Use of nutrient intake recommendations in population
assessment 5
1.3 Approaches used in estimating nutrient intakes for optimal
health 6
1.3.1 The clinical approach 8
1.3.2 Nutrient balance 8
1.3.3 Functional responses 9
1.3.4 Optimal intake 10
1.4 Conclusions 12
References 14
2. Vitamin A 17
2.1 Role of vitamin A in human metabolic processes 17
2.1.1 Overview of vitamin A metabolism 17
2.1.2 Biochemical mechanisms for vitamin A functions 19
2.2 Populations at risk for, and consequences of, vitamin A
deficiency 20
2.2.1 Definition of vitamin A deficiency 20
2.2.2 Geographic distribution and magnitude 20
2.2.3 Age and sex 21
2.2.4 Risk factors 22
2.2.5 Morbidity and mortality 23
2.3 Units of expression 24
2.4 Sources and supply patterns of vitamin A 27
2.4.1 Dietary sources 27
2.4.2 Dietary intake and patterns 27
2.4.3 World and regional supply and patterns 27
2.5 Indicators of vitamin A deficiency 29
2.5.1 Clinical indicators of vitamin A deficiency 29
2.5.2 Subclinical indicators of vitamin A deficiency 30
2.6 Evidence used for making recommendations 31
2.6.1 Infants and children 32
2.6.2 Adults 33
2.6.3 Pregnant women 33
2.6.4 Lactating women 34
2.6.5 Elderly 35
2.7 Recommendations for vitamin A requirements 35
2.8 Toxicity 36
2.9 Recommendations for future research 37
References 37
3. Vitamin D 45
3.1 Role of vitamin D in human metabolic processes 45
3.1.1 Overview of vitamin D metabolism 45
3.1.2 Calcium homeostasis 46
3.2 Populations at risk for vitamin D deficiency 48
3.2.1 Infants 48
3.2.2 Adolescents 48
3.2.3 Elderly 48
3.2.4 Pregnant and lactating women 49
3.3 Evidence used for estimating recommended intakes 51
3.3.1 Lack of accuracy in estimating dietary intake and skin
synthesis 51
3.3.2 Use of plasma 25-OH-D as a measure of vitamin D
status 51
3.4 Recommended intakes for vitamin D 53
3.5 Toxicity 54
3.6 Recommendations for future research 55
References 55
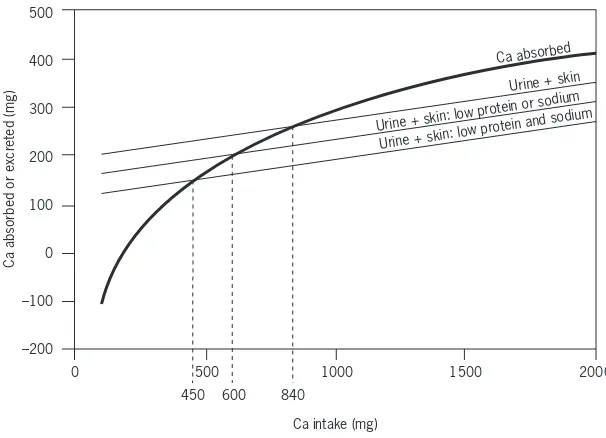
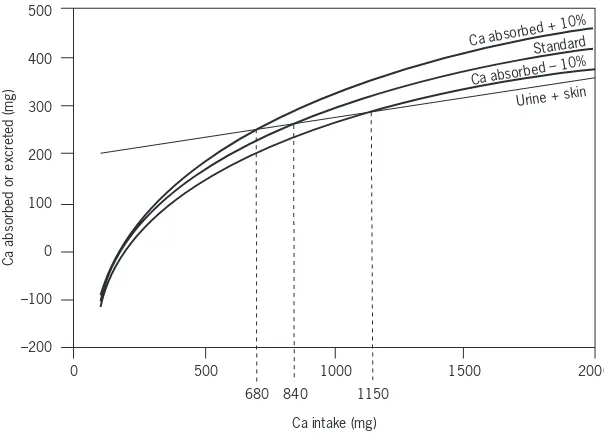
4. Calcium 59
4.1 Introduction 59
4.3 Biological role of calcium 61
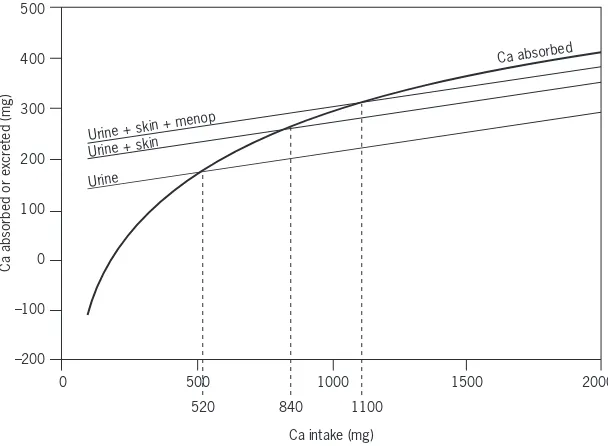
4.4 Determinants of calcium balance 62
4.4.1 Calcium intake 62
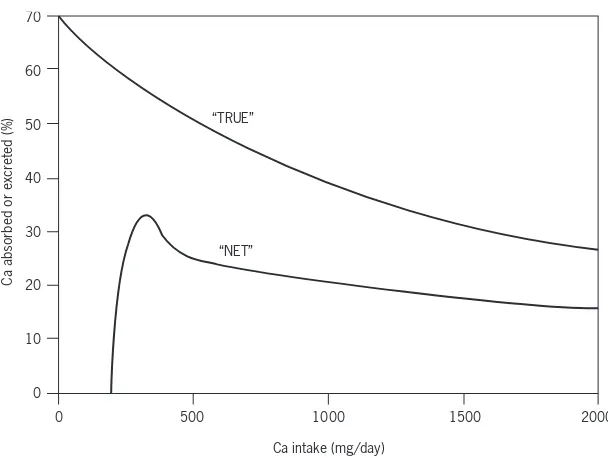
4.4.2 Calcium absorption 62
4.4.3 Urinary calcium 65
4.4.4 Insensible losses 66
4.5 Criteria for assessing calcium requirements and
recommended nutrient intakes 66
4.5.1 Methodology 66
4.5.2 Populations at risk for calcium deficiency 69
4.6 Recommendations for calcium requirements 69
4.6.1 Infants 69
4.6.2 Children 70
4.6.3 Adolescents 71
4.6.4 Adults 72
4.6.5 Menopausal women 72
4.6.6 Ageing adults 73
4.6.7 Pregnant women 73
4.6.8 Lactating women 73
4.7 Upper limits 74
4.8 Comparisons with other recommendations 74
4.9 Ethnic and environmental variations in the prevalence of
osteoporosis 75
4.9.1 Ethnicity 76
4.9.2 Geography 76
4.9.3 Culture and diet 77
4.9.4 The calcium paradox 78
4.10 Nutritional factors affecting calcium requirement 78
4.10.1 Sodium 78
4.10.2 Protein 79
4.10.3 Vitamin D 81
4.10.4 Implications 81
4.11 Conclusions 83
4.12 Recommendations for future research 85
References 85
5. Vitamin E 94
5.1 Role of vitamin E in human metabolic processes 94
5.2 Populations at risk for vitamin E deficiency 97
5.3 Dietary sources and possible limitations to vitamin E supply 100
5.4 Evidence used for estimating recommended intakes 101
5.6 Recommendations for future research 103
References 104
6. Vitamin K 108
6.1 Introduction 108
6.2 Biological role of vitamin K 108
6.3 Overview of vitamin K metabolism 110
6.3.1 Absorption and transport 110
6.3.2 Tissue stores and distribution 111
6.3.3 Bioactivity 112
6.3.4 Excretion 112
6.4 Populations at risk for vitamin K deficiency 113
6.4.1 Vitamin K deficiency bleeding in infants 113
6.4.2 Vitamin K prophylaxis in infants 114
6.4.3 Vitamin K deficiency in adults 115
6.5 Sources of vitamin K 115
6.5.1 Dietary sources 115
6.5.2 Bioavailability of vitamin K from foods 116
6.5.3 Importance of intestinal bacterial synthesis as
a source of vitamin K 117
6.6 Information relevant to the derivation of recommended
vitamin K intakes 117
6.6.1 Assessment of vitamin K status 117
6.6.2 Dietary intakes in infants and their adequacy 118
6.6.3 Factors of relevance to classical vitamin K deficiency
bleeding 119
6.6.4 Factors of relevance to late vitamin K deficiency
bleeding 120
6.6.5 Dietary intakes in older infants, children, and adults
and their adequacy 120
6.7 Recommendations for vitamin K intakes 122
6.7.1 Infants 0–6 months 122
6.7.2 Infants (7–12 months), children, and adults 125
6.8 Toxicity 126
6.9 Recommendations for future research 126
References 126
7. Vitamin C 130
7.1 Introduction 130
7.2 Role of vitamin C in human metabolic processes 130
7.2.1 Background biochemistry 130
7.2.3 Miscellaneous functions 131
7.3 Consequences of vitamin C deficiency 131
7.4 Populations at risk for vitamin C deficiency 132
7.5 Dietary sources of vitamin C and limitations to vitamin C
supply 134
7.6 Evidence used to derive recommended intakes of vitamin C 135
7.6.1 Adults 135
7.6.2 Pregnant and lactating women 137
7.6.3 Children 137
7.6.4 Elderly 138
7.6.5 Smokers 138
7.7 Recommended nutrient intakes for vitamin C 138
7.8 Toxicity 139
7.9 Recommendations for future research 139
References 139
8. Dietary antioxidants 145
8.1 Nutrients with an antioxidant role 145
8.2 The need for biological antioxidants 145
8.3 Pro-oxidant activity of biological antioxidants 147
8.4 Nutrients associated with endogenous antioxidant mechanisms 150
8.5 Nutrients with radical-quenching properties 151
8.5.1 Vitamin E 151
8.5.2 Vitamin C 153
8.5.3 b-Carotene and other carotenoids 154
8.6 A requirement for antioxidant nutrients 156
8.7 Recommendations for future research 158
References 158
9. Thiamine, riboflavin, niacin, vitamin B6,pantothenic acid,
and biotin 164
9.1 Introduction 164
9.2 Thiamine 165
9.2.1 Background 165
9.2.2 Biochemical indicators 166
9.2.3 Factors affecting requirements 167
9.2.4 Evidence used to derive recommended intakes 167
9.2.5 Recommended nutrient intakes for thiamine 168
9.3 Riboflavin 169
9.3.1 Background 169
9.3.2 Biochemical indicators 170
9.3.4 Evidence used to derive recommended intakes 171
9.3.5 Recommended nutrient intakes for riboflavin 172
9.4 Niacin 173
9.4.1 Background 173
9.4.2 Biochemical indicators 174
9.4.3 Factors affecting requirements 174
9.4.4 Evidence used to derive recommended intakes 175
9.4.5 Recommended nutrient intakes for niacin 175
9.5 Vitamin B6 175
9.5.1 Background 175
9.5.2 Biochemical indicators 177
9.5.3 Factors affecting requirements 178
9.5.4 Evidence used to derive recommended intakes 178
9.5.5 Recommended nutrient intakes for vitamin B6 179
9.6 Pantothenate 180
9.6.1 Background 180
9.6.2 Biochemical indicators 180
9.6.3 Factors affecting requirements 181
9.6.4 Evidence used to derive recommended intakes 181
9.6.5 Recommended nutrient intakes for pantothenic acid 182
9.7 Biotin 182
9.7.1 Background 182
9.7.2 Biochemical indicators 183
9.7.3 Evidence used to derive recommended intakes 183
9.7.4 Recommended nutrient intakes for biotin 184
9.8 General considerations for B-complex vitamins 184
9.8.1 Notes on suggested recommendations 184
9.8.2 Dietary sources of B-complex vitamins 185
9.9 Recommendations for future research 185
References 186
10. Selenium 194
10.1 Role of selenium in human metabolic processes 194
10.2 Selenium deficiency 196
10.2.1 Non-endemic deficiencies of selenium 196
10.2.2 Keshan disease 197
10.2.3 Kaschin-Beck disease 198
10.2.4 Selenium status and susceptibility to infection 198
10.2.5 Selenium and thyroid hormones 200
10.3 The influence of diet on selenium status 200
10.4 Absorption and bioavailability 204
10.6 Recommended selenium intakes 206
10.6.1 Adults 206
10.6.2 Infants 206
10.6.3 Pregnant and lactating women 208
10.7 Upper limits 209
10.8 Comparison with other estimates 209
10.9 Recommendations for future research 210
References 211
11. Magnesium 217
11.1 Tissue distribution and biological role of magnesium 217 11.2 Populations at risk for, and consequences of,
magnesium deficiency 218
11.3 Dietary sources, absorption, and excretion of magnesium 218 11.4 Criteria for assessing magnesium requirements and allowances 220
11.5 Recommended intakes for magnesium 222
11.6 Upper limits 225
11.7 Comparison with other estimates 225
11.8 Recommendations for future research 225
References 226
12. Zinc 230
12.1 Role of zinc in human metabolic processes 230
12.2 Zinc metabolism and homeostasis 231
12.3 Dietary sources and bioavailability of zinc 232
12.4 Populations at risk for zinc deficiency 234
12.5 Evidence used to estimate zinc requirements 235
12.5.1 Infants, children, and adolescents 236
12.5.2 Pregnant women 238
12.5.3 Lactating women 238
12.5.4 Elderly 239
12.6 Interindividual variations in zinc requirements and
recommended nutrient intakes 239
12.7 Upper limits 240
12.8 Adequacy of zinc intakes in relation to requirement estimates 241
12.9 Recommendations for future research 242
References 243
13. Iron 246
13.1 Role of iron in human metabolic processes 246
13.2 Iron metabolism and absorption 246
13.2.1 Basal iron losses 246
13.2.3 Menstrual iron losses 249
13.2.4 Iron absorption 250
13.2.5 Inhibition of iron absorption 252
13.2.6 Enhancement of iron absorption 254
13.2.7 Iron absorption from meals 255
13.2.8 Iron absorption from the whole diet 255
13.2.9 Iron balance and regulation of iron absorption 256
13.3 Iron deficiency 258
13.3.1 Populations at risk for iron deficiency 258
13.3.2 Indicators of iron deficiency 260
13.3.3 Causes of iron deficiency 261
13.3.4 Prevalence of iron deficiency 262
13.3.5 Effects of iron deficiency 263
13.4 Iron requirements during pregnancy and lactation 264
13.5 Iron supplementation and fortification 267
13.6 Evidence used for estimating recommended nutrient intakes 268
13.7 Recommendations for iron intakes 271
13.8 Recommendations for future research 272
References 272
14. Vitamin B12 279
14.1 Role of vitamin B12in human metabolic processes 279
14.2 Dietary sources and availability 279
14.3 Absorption 280
14.4 Populations at risk for, and consequences of, vitamin B12
deficiency 280
14.4.1 Vegetarians 280
14.4.2 Pernicious anaemia 281
14.4.3 Atrophic gastritis 281
14.5 Vitamin B12interaction with folate or folic acid 282
14.6 Criteria for assessing vitamin B12status 283
14.7 Recommendations for vitamin B12intakes 284
14.7.1 Infants 285
14.7.2 Children 285
14.7.3 Adults 285
14.7.4 Pregnant women 286
14.7.5 Lactating women 286
14.8 Upper limits 286
14.9 Recommendations for future research 287
References 287
15. Folate and folic acid 289
15.2 Populations at risk for folate deficiency 294
15.3 Dietary sources of folate 294
15.4 Recommended nutrient intakes for folate 295
15.5 Differences in bioavailability of folic acid and food folate:
implications for the recommended intakes 297
15.6 Considerations in viewing recommended intakes for folate 297
15.6.1 Neural tube defects 297
15.6.2 Cardiovascular disease 298
15.6.3 Colorectal cancer 298
15.7 Upper limits 299
15.8 Recommendations for future research 299
References 300
16. Iodine 303
16.1 Role of iodine in human metabolic processes 303
16.2 Populations at risk for iodine deficiency 304
16.3 Dietary sources of iodine 305
16.4 Recommended intakes for iodine 306
16.4.1 Infants 307
16.4.2 Children 309
16.4.3 Adults 309
16.4.4 Pregnant women 310
16.5 Upper limits 311
16.5.1 Iodine intake in areas of moderate iodine deficiency 312
16.5.2 Iodine intake in areas of iodine sufficiency 313
16.5.3 Excess iodine intake 314
References 315
17. Food as a source of nutrients 318
17.1 Importance of defining food-based recommendations 318
17.2 Dietary diversification when consuming cereal- and
tuber-based diets 325
17.2.1 Vitamin A 325
17.2.2 Vitamin C 325
17.2.3 Folate 326
17.2.4 Iron and zinc 326
17.3 How to accomplish dietary diversity in practice 327
17.4 Practices which will enhance the success of food-based
approaches 328
17.5 Delineating the role of supplementation and food fortification
for micronutrients which cannot be supplied by food 329
17.5.2 Supplementation 332
17.6 Food-based dietary guidelines 333
17.7 Recommendations for the future 335
17.8 Future research needs 335
References 336
Annex 1: Recommended nutrient intakes – minerals 338
Annex 2: Recommended nutrient intakes – water- and fat-soluble
In the past 20 years, micronutrients have assumed great public health im-portance. As a consequence, considerable research has been carried out to better understand their physiological role and the health consequences of micronutrient-deficient diets, to establish criteria for defining the degree of public health severity of micronutrient malnutrition, and to develop preven-tion and control strategies.
One of the main outcomes of this process is greatly improved knowledge of human micronutrient requirements, which is a crucial step in understand-ing the public health significance of micronutrient malnutrition and identify-ing the most appropriate measures to prevent them. This process also led to successive expert consultations and publications organized jointly by the Food and Agriculture Organization of the United Nations (FAO), the World Health Organization (WHO) and the International Atomic Energy Agency (IAEA) providing up-to-date knowledge and defining standards for micronu-trient requirements in 19731, 19882and in 19963. In recognition of this rapidly developing field, and the substantial new advances that have been made since the most recent publication in 1996, FAO and WHO considered it appropri-ate to convene a new expert consultation to re-evaluappropri-ate the role of micronu-trients in human health and nutrition.
To this end, background papers on the major vitamins, minerals and trace elements were commissioned and reviewed at a Joint FAO/WHO Expert Consultation (Bangkok, 21–30 September 1998). That Expert Consultation was assigned three main tasks:
• Firstly,the Consultation was asked to review the full range of vitamin and mineral requirements—19 micronutrients in all—including their role in
1Trace elements in human nutrition. Report of a WHO Expert Committee. Geneva, World Health Organization, 1973 (WHO Technical Report Series, No. 532).
2Requirements of vitamin A, iron, folate and vitamin B12. Report of a Joint FAO/WHO Expert Consultation. Rome, Food and Agriculture Organization of the United Nations, 1988 (FAO Food and Nutrition Series, No. 23).
normal human physiology and metabolism, and conditions of deficiency. This included focusing on and revising the requirements for essential vita-mins and minerals, including vitavita-mins A, C, D, E, and K; the B vitavita-mins; calcium; iron; magnesium; zinc; selenium; and iodine, based on the avail-able scientific evidence.
• Secondly, the Consultation was asked to prepare a report that would include recommended nutrient intakes for vitamins A, C, D, E, and K; the B vitamins; calcium; iron; magnesium; zinc; selenium; and iodine. The report should provide practical advice and recommendations which will constitute an authoritative source of information to all those from Member States who work in the areas of nutrition, agriculture, food production and distribution, and health promotion.
• Thirdly, the Consultation was asked to identify key issues for future research concerning each vitamin and mineral under review and to make preliminary recommendations on that research.
The present report presents the outcome of the Consultation combined with up-to-date evidence that has since become available to answer a number of issues which remained unclear or controversial at the time of the Consul-tation. It was not originally thought that such an evidence-based consultation process would be so controversial, but the reality is that there are surprisingly few data on specific health status indicators on which to base conclusions, whereas there is a great deal of information relative to overt deficiency disease conditions. The defining of human nutrient requirements and recommended intakes are therefore largely based on expert interpretation and consensus on the best available scientific information.
When looking at recommended nutrient intakes (RNIs) in industrialized countries over the last 25 years, it is noticeable that for some micronutrients these have gradually increased. The question is whether this is the result of better scientific knowledge and understanding of the biochemical role of the nutrients, or whether the criteria for setting requirement levels have changed, or a combination of both. The scientific knowledge base has vastly expanded, but it appears that more rigorous criteria for defining recommended levels is also a key factor.
“optimal nutrition”, and this has been one of the factors nudging defined requirements to still higher levels.
This shift in the goal for setting RNIs is not without reason. The popula-tions that are targeted for prevention through “optimal nutrition” are char-acterized by sedentary lifestyles and longer life expectancy. The populations in industrialized countries are ageing, and concern for the health of the older person has grown accordingly. In contrast, the micronutrient needs of popu-lation groups in developing countries are still viewed in terms of millions experiencing deficiency, and are then more appropriately defined as those that will satisfy basic nutritional needs of physically active younger populations. Nevertheless, one also needs to bear in mind the double burden of under- and overnutrition, which is growing rapidly in many developing countries.
Concern has been raised about possible differences in micronutrient needs of populations with different lifestyles for a very practical reason. The logic behind the establishment of micronutrient needs of industrialized nations has come about at the same time as a large and growing demand for a wide variety of supplements and fortificants, and manufacturers have responded quickly to meet this market. This phenomenon could easily skew national strategies for nutritional development, with an increased tendency to seek to resolve the micronutrient deficiency problems of developing countries by promoting supplements and fortification strategies, rather than through increasing the consumption of adequate and varied diets. Higher levels of RNIs often set in developed countries can easily be supported because they can be met with supplementation in addition to food which itself is often fortified. In contrast, it often becomes difficult to meet some of the micronutrient needs in some populations of developing countries by consuming locally available food, because foods are often seasonal, and neither supplementation nor fortifica-tion reach vulnerable populafortifica-tion groups.
Among the nutrients of greatest concern is calcium; the RNI may be difficult to meet in the absence of dairy products. The recently revised United States/Canada dietary reference intakes (DRIs) propose only an acceptable intake (AI) for calcium instead of a recommended daily allowance (RDA) in recognition of the fact that intake data are out of step with the relatively high intake requirements observed with experimentally derived values.1
Another nutrient of concern is iron, particularly during pregnancy, where supplementation appears to be essential during the second half of pregnancy.
Folic acidrequirements are doubled for women of childbearing age to prevent the incidence of neural tube defects in the fetus. Conversion factors for carotenoids are under review, with the pending conclusion that servings of green leafy vegetables needed to meet vitamin A requirements probably need to be at least doubled. In view of this uncertainty, only “recommended safe intakes” rather than RNIs are provided for this vitamin.
Seleniumis the subject of growing interest because of its properties as an
antioxidant. The RNIs recommended herein for this micronutrient are gen-erally lower than those derived by the United States Food and Nutrition Board because the latter are calculated on a cellular basis, whereas the present report relies on more traditional whole-body estimates.1
Are these “developments” or “new understandings” appropriate for and applicable in developing countries? The scientific evidence for answering this question is still emerging, but the time may be near when RNIs may need to be defined differently, taking into account the perspective of developing coun-tries based on developing country data. There may be a need to identify some biomarkers that are specific to conditions in each developing country. There is therefore a continuing urgent need for research to be carried out in devel-oping countries about their specific nutrient needs. The current situation also implies that the RNIs for the micronutrients of concern discussed above will need to be re-evaluated as soon as significant additional data are available.
Kraisid Tontisirin Graeme Clugston
Director Director
Division of Food and Nutrition Department of Nutrition for Food and Agriculture Organization Health and Development
of the United Nations World Health Organization
We wish to thank the authors of the background papers: Leif Hallberg, Department of Clinical Nutrition, Göteborg University, Annedalsklinikerna, Sahlgrenska University Hospital, Göteborg, Sweden; Glenville Jones, Depart-ment of Biochemistry—Medicine, Queen’s University, Kingston, Ontario, Canada; Madhu Karmarkar, Senior Adviser, International Council for Control of Iodine Deficiency Disorders, New Delhi, India; Mark Levine, National Institute of Diabetes & Digestive & Kidney Diseases, National Insti-tute of Health, Bethesda, MD, USA; Donald McCormick, Department of Biochemistry, Emory University School of Medicine, Atlanta, GA, USA; Colin Mills, Director, Postgraduate Studies, Rowett Research Institute, Bucksburn, Scotland; Christopher Nordin, Institute of Medical and Veteri-nary Sciences, Clinical Biochemistry Division, Adelaide, Australia; Maria Theresa Oyarzum, Institute of Nutrition and Food Technology (INTA), University of Chile, Santiago, Chile; Chandrakant Pandav, Regional Coordinator, South-Asia and Pacific International Council for Control of Iodine Deficiency Disorders; and Additional Professor, Center for Community Medicine, All India Institute of Medical Sciences, New Delhi, India; Brittmarie Sandström,1Research Department of Human Nutrition, The Royal Veterinary and Agricultural University, Frederiksberg, Denmark; John Scott, Department of Biochemistry, Trinity College, Dublin, Ireland; Martin Shearer, Vitamin K Research Unit of the Haemophilia Centre, The Rayne Institute, St Thomas’s Hospital, London, England; Ajay Sood, Department of Endocrinology and Metabolism, All India Institute of Medical Sciences, New Delhi, India; David Thurnham, Howard Professor of Human Nutrition, School of Biomedical Sciences, Northern Ireland Centre for Diet and Health, University of Ulster, Londonderry, Northern Ireland; Maret Traber, Linus Pauling Institute, Department of Nutrition and Food Management, Oregon State University, Corvallis, OR, USA; Ricardo Uauy, Director, Institute of Nutrition and Food Technology (INTA), University of Chile, Santiago,
Chile; Barbara Underwood, formerly Scholar-in-Residence, Food and Nutrition Board, Institute of Medicine, National Academy of Sciences, Washington, DC, USA; and Cees Vermeer, Faculteit der Geneeskunde Biochemie, Department of Biochemistry, University of Maastricht, Maas-tricht, Netherlands.
A special acknowledgement is made to the following individuals for their valuable contributions to, and useful comments on, the background docu-ments: Christopher Bates, Medical Research Council, Human Nutrition Research, Cambridge, England; Robert E. Black, Department of International Health, Johns Hopkins School of Hygiene and Public Health, Baltimore, MD, USA; James Blanchard, Pharmaceutical Sciences, Department of Pharmacol-ogy and ToxicolPharmacol-ogy, University of Arizona, Tucson, AZ, USA; Thomas Bothwell, Faculty of Medicine, University of the Witwatersrand, Witwater-srand, South Africa; Chen Chunming, Senior Adviser, Chinese Academy of Preventive Medicine, Beijing, China; William Cohn, F. Hoffman-La Roche Ltd, Division of Vitamins, Research and Technology Development, Basel, Switzerland; François Delange, International Council for Control of Iodine Deficieny Disorders, Brussels, Belgium; C. Gopalan, President, Nutrition Foundation of India, New Delhi, India; Robert P. Heaney, Creighton Uni-versity Medical Center, Omaha, NE, USA; Basil Hetzel, Children’s Health Development Foundation, Women’s and Children’s Hospital, North Ade-laide, Australia; Glenville Jones, Department of Biochemistry—Medicine, Queen’s University, Kingston, Ontario, Canada; Walter Mertz,1 Rockville, MD, USA; Ruth Oniang’o, Jomo Kenyatta University of Agriculture and Technology, Nairobi, Kenya; Robert Parker, Division of Nutritional Sciences, Cornell University, Ithaca, NY, USA; Robert Russell, Professor of Medicine and Nutrition and Associate Director, Human Nutrition Research Center on Aging, Tufts University, United States Department of Agriculture Agricul-tural Research Service, Boston, MA, USA; Tatsuo Suda, Department of Bio-chemistry, Showa University School of Dentistry, Tokyo, Japan; John Suttie, Department of Biochemistry, University of Wisconsin-Madison, Madison, WI, USA; Henk van den Berg, TNO Nutrition and Food Research Institute, Zeist, Netherlands; Keith West Jr., Johns Hopkins School of Hygiene and Public Health, Division of Human Nutrition, Baltimore, MD, USA; and Parvin Zandi, Head, Department of Food Science and Technology, National Nutrition & Food Technology Research Institute, Tehran, Islamic Republic of Iran.
Acknowledgements are also made to the members of the Secretariat: Ratko Buzina, formerly Programme of Nutrition, WHO, Geneva, Switzerland; Joan Marie Conway, Consultant, FAO, Rome, Italy; Richard Dawson, Consultant, Food and Nutrition Division, FAO, Rome, Italy; Sultana Khanum, Pro-gramme of Nutrition, WHO, Geneva, Switzerland; John R. Lupien, formerly Director, Food and Nutrition Division, FAO, Rome, Italy; Blab Nandi, Senior Food and Nutrition Officer, FAO Regional Office for Asia and the Pacific, Bangkok, Thailand; Joanna Peden, Public Health Nutrition Unit, London School of Hygiene and Tropical Medicine, London, England; and Zeina Sifri, Consultant, Food and Nutrition Division, FAO, Rome, Italy.
used to define nutritional needs and
recommendations
1.1 Introduction
The dietary requirement for a micronutrient is defined as an intake level which meets a specified criteria for adequacy, thereby minimizing risk of nutrient deficit or excess. These criteria cover a gradient of biological effects related to a range of nutrient intakes which, at the extremes, include the intake required to prevent death associated with nutrient deficit or excess. However, for nutri-ents where insufficient data on mortality are available, which is the case for most micronutrients discussed in this report, other biological responses must be defined. These include clinical disease as determined by signs and symp-toms of nutrient deficiency, and subclinical conditions identified by specific biochemical and functional measures. Measures of nutrient stores or critical tissue pools may also be used to determine nutrient adequacy.
Functional assays are presently the most relevant indices of subclinical con-ditions related to vitamin and mineral intakes. Ideally, these biomarkers should be sensitive to changes in nutritional state while at the same time be specific to the nutrient responsible for the subclinical deficiency. Often, the most sensitive indicators are not the most specific; for example, plasma fer-ritin, a sensitive indicator of iron status, may change not only in response to iron supply, but also as a result of acute infection or chronic inflammatory processes. Similarly anaemia, the defining marker of dietary iron deficiency, may also result from, among other things, deficiencies in folate, vitamin B12 or copper.
generally recognized that balance can be reached over a wide range of nutri-ent intakes. However, requiremnutri-ent levels defined using nutrinutri-ent balance have been used if no other suitable data are available.
1.2 Definition of terms
The following definitions relate to the micronutrient intake from food and water required to promote optimal health, that is, prevent vitamin and mineral deficiency and avoid the consequences of excess. Upper limits of nutrient intake are defined for specific vitamins and minerals where there is a poten-tial problem with excess either from food or from food in combination with nutrient supplements.
1.2.1 Estimated average requirement
Estimated average requirement (EAR) is the average daily nutrient intake level that meets the needs of 50% of the “healthy” individuals in a particular age and gender group. It is based on a given criteria of adequacy which will vary depending on the specified nutrient. Therefore, estimation of requirement starts by stating the criteria that will be used to define adequacy and then establishing the necessary corrections for physiological and dietary factors. Once a mean requirement value is obtained from a group of subjects, the nutrient intake is adjusted for interindividual variability to arrive at a recommendation (4,5,6).
1.2.2 Recommended nutrient intake
1.2.3 Apparently healthy
The term, “apparently healthy” refers to the absence of disease based on clin-ical signs and symptoms of micronutrient deficiency or excess, and normal function as assessed by laboratory methods and physical evaluation.
1.2.4 Protective nutrient intake
The concept of protective nutrient intake has been introduced for some micronutrients to refer to an amount greater than the RNI which may be pro-tective against a specified health or nutritional risk of public health relevance (e.g. vitamin C intake of 25mg with each meal to enhance iron absorption and prevent anaemia) (7). When existing data provide justifiable differences between RNI values and protective intake levels comment to that effect is made in the appropriate chapter of this document. Protective intake levels are expressed either as a daily value or as an amount to be consumed with a meal.
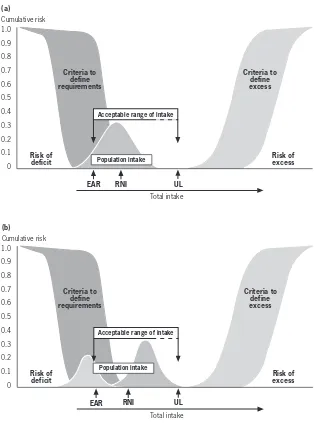
Criteria to define requirements
Criteria to define excess 1.0
0.9
0.8
0.7 0.6
0.5 0.4
0.3 0.2
0.1 0
Total intake Risk of
deficit
Risk of excess Cumulative risk
Acceptable range of intake
EAR RNI UL
The shaded ranges correspond to different approaches to defining requirements to prevent deficit and excess, respectively. The estimated average requirement (EAR) is the average daily intake required to prevent deficit in half of the population. The recommended nutrient intake (RNI) is the amount necessary to meet the needs of most (97.5%) of the population, set as the EAR plus 2 standard deviations. The tolerable upper intake level (UL) is the level at which no evidence of toxicity is demonstrable.
FIGURE 1.1
1.2.5 Upper tolerable nutrient intake level
Upper limits (ULs) of nutrient intake have been set for some micronutrients and are defined as the maximum intake from food, water and supplements that is unlikely to pose risk of adverse health effects from excess in almost all (97.5%) apparently healthy individuals in an age- and sex-specific population group (see Figure 1.1). ULs should be based on long-term exposure to all foods, including fortified food products. For most nutrients no adverse effects are anticipated when they are consumed as foods because their absorption and/or excretion are regulated. The special situation of consumption of nutri-tional supplements which, when added to the nutrient intake from food, may result in a total intake in excess of the UL is addressed for specific micronu-trients in subsequent chapters, as appropriate. The ULs as presented here do not meet the strict definition of the “no observed effect level” (NOEL) used in health risk assessment by toxicologists because in most cases, a dose–response curve for risk from exposure to a nutrient will not be available (8). For additional details on derivation of ULs, please refer to standard texts on this subject (9,10).
The range of intakes between the RNI and UL should be considered suf-ficient to prevent deficiency while avoiding toxicity. If no UL can be derived from experimental or observational data in humans, the UL can be defined from available data on the range of observed dietary intake of apparently healthy populations. In the absence of known adverse effects a default value for the UL of 10 times the RNI is frequently used (5, 10,11).
1.2.6 Nutrient excess
Traditional toxicology-based approaches to assessing adverse health effects from nutrient excess start by defining either the highest intake level at which no observed adverse effects of biological significance are found (i.e. the no observed adverse effect level (NOAEL)), or the lowest intake level at which adverse effects are observed (i.e. the lowest observed adverse effect level that are (LOAEL)). Uncertainty or modifying factors are then used to adjust a known NOAEL or LOAEL to define reference doses which represent chronic intake levels that are considered safe, or of no significant health risk, for humans. The nature of the adjustment used to modify the acceptable intake indicated by the NOAEL or LOAEL is based on the type and quality of the available data and its applicability to human populations (5, 9,11).
has been obtained in studies of insufficient duration to assure chronic safety; when the database which supports the NOAEL is incomplete; or when the experimental data provide a LOAEL instead of a true NOAEL. The usual value for each uncertainty factor is 10, leading to a 10-fold reduction in the acceptable intake level for each of the considerations listed above. The reduc-tions may be used in isolation or in combination depending on the specific micronutrient being assessed.
Modifying factors are additional uncertainty factors which have a value of 1 or more but less than 10, and are based on expert judgement of the overall quality of the data available. Given the paucity of human data, the limitations of animal models and uncertainties of interpretation, the traditional toxico-logical approach to determining limits for intake, as summarized here, may in fact lead to the definition of intakes which promote or even induce deficiency if followed by a population. This has recently been recognized by the WHO International Programme on Chemical Safety, and a special risk assessment model has been derived for elements that are both essential and have poten-tial toxicity (5, 9).
1.2.7 Use of nutrient intake recommendations in population
assessment
Recommendations given in this report are generally presented as population RNIs with a corresponding UL where appropriate. They are not intended to define the daily requirements of an individual. However “healthy” individu-als consuming within the range of the RNI and the UL can expect to mini-mize their risk of micronutrient deficit and excess. Health professionals caring for special population groups that do not meet the defined characterization of “healthy” should, where possible, adjust these nutrient-based recommen-dations to the special needs imposed by disease conditions and/or environ-mental situations.
given nutrient. It assumes that the variability of individual intakes is at least as large as the variability in requirements and that the distribution of intakes and requirements are independent of each other. The latter is most likely to be true in the case of vitamins and minerals, but clearly not for energy. The EAR cut-point method requires a single population with a symmetrical dis-tribution around the mean. If these conditions are met, the prevalence of inad-equate intakes corresponds to the proportion of intakes that fall below the EAR. It is clearly inappropriate to examine mean values of population intake and RNI to define the population at risk of inadequacy. The relevant infor-mation is the proportion of intakes in a population group that is below the EAR, not below the RNI (4, 5).
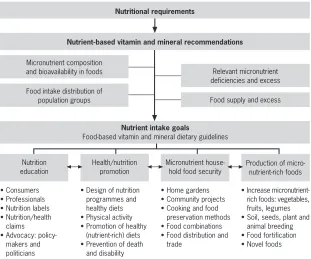
Figure 1.2 serves to illustrate the use of nutrient intake recommendations in risk assessment considering the model presented in Figure 1.1; the distribu-tions of nutrient intakes for a population have been added to explore risk of excess or deficit (2, 4,5). Figure 1.2a presents the case of a single population with intakes ranging from below the EAR to the UL with a mean intake close to the RNI. The fraction of the population that is below the EAR represents the prevalence of deficit; as depicted in the figure this is a sizeable group despite the fact that the mean intake for the population is close to the RNI. Figure 1.2b presents the case of a bimodal distribution of population intakes where the conditions to use the EAR cut-point method are not met. In this case it is clear that a targeted intervention to increase the intake of one group but not the other is needed. For example, if we examine the iron intake of a popula-tion we may find that vegetarians may be well below the recommended intake while those who consume meat may be getting sufficient iron. To achieve ade-quacy in this case we need to increase iron intake in the former but not the latter group (2,12).
1.3 Approaches used in estimating nutrient intakes for
optimal health
Criteria to define requirements Criteria to define excess Population intake Criteria to define requirements Criteria to define excess Population intake 1.0 0.9 0.8 0.7 0.6 0.5 0.4 0.3 0.2 0.1 0 Total intake Risk of
deficit Risk ofexcess
Cumulative risk 1.0 0.9 0.8 0.7 0.6 0.5 0.4 0.3 0.2 0.1 0 Total intake Risk of deficit Risk of excess Cumulative risk
Acceptable range of intake
EAR RNI UL
(a)
Acceptable range of intake
EAR RNI UL
(b)
a) Examines the risk of inadequacy for a given distribution of intakes as shown by the shaded bell-shaped area. In this example, the proportion of individuals that have intakes below the EAR are at risk of deficiency (see text for details).
b) Illustrates the need to examine whether there is more than one group within the population distribution of intakes. In this case, the overall mean intake is above the RNI, suggesting a low risk of deficit. However, while a large proportion of the population (represented by the right-hand bell-shaped area) is over the RNI, there is in fact a significant proportion of the population (represented by the left-hand bell-shaped area) below the EAR, and thus at risk of deficiency. The intervention here should be targeted to increase the intake for the group on the left but not for the one on the right; the right-hand group may exceed the UL and be at risk for excess if their FIGURE 1.2
1.3.1 The clinical approach
The traditional criteria to define essentiality of nutrients for human health require that a) a disease state, or functional or structural abnormality is present if the nutrient is absent or deficient in the diet and, b) that the abnormalities are related to, or a consequence of, specific biochemical or functional changes that can be reversed by the presence of the essential dietary component. End-points considered in recent investigations of essentiality of nutrients in exper-imental animals and humans include: reductions in ponderal or linear growth rates, altered body composition, compromised host defense systems, impair-ment of gastrointestinal or immune function, abnormal cognitive perform-ance, increased susceptibility to disease, increased morbidity and changes in biochemical measures of nutrient status. To establish such criteria for partic-ular vitamins and minerals requires a solid understanding of the biological effects of specific nutrients, as well as sensitive instrumentation to measure the effects, and a full and precise knowledge of the amount and chemical form of nutrients supplied by various foods and their interactions (2, 12).
1.3.2 Nutrient balance
Nutrient balance calculations typically involve assessing input and output and establishing requirement at the point of equilibrium (except in the case of childhood, pregnancy and lactation where the additional needs for growth, tissue deposition and milk secretion are considered). However, in most cases, balance based on input–output measurements is greatly influenced by prior level of intake, that is, subjects adjust to high intakes by increasing output and, conversely, they lower output when intake is low. Thus, if sufficient time is provided to accommodate to a given level of intake, balance can be achieved, and for this reason, the exclusive use of nutrient balance to define require-ments should be avoided whenever possible (1,5,13).
vitamin requirements (14,15). This is because the carbon dioxide formed on the oxidation of vitamins is lost in expired air or hard to quantify, since it becomes part of the body pool and cannot be traced to its origin unless the vitamin is provided in an isotopically labelled form (15).
1.3.3 Functional responses
Various biomarkers are presently being evaluated for their specificity and sen-sitivity to assess nutrient-related organ function and thus predict deficiency or toxicity.
In terms of defining nutrient needs for optimal function, recent efforts have focused on the assessment of:
• Neurodevelopment: monitoring electro-physiologic responses to defined
sensory stimuli; sleep–wake cycle organization; and neurobehavioural tests (16,17,18).
• Bone health: measuring bone mineral density by X-ray absorptiometry;
markers of collagen synthesis and turnover; and hormonal responses asso-ciated with bone anabolism and catabolism (19,20).
• Biochemical normalcy: measuring plasma and tissue concentrations of
sub-strates or nutrient responsive enzymes, hormones or other indices of ana-bolic and cataana-bolic activity; and plasma concentrations and tissue retention in response to a fixed nutrient load (21,22).
• Immune function: measuring humoral and cellular response to antigens and
mitogens in vitro or in vivo; antibody response to weak antigens such as immunizations; T-cell populations; cytokine responses; and mediators of inflammation related to tissue protection and damage (23,24).
• Body composition and tissue metabolic status: using stable isotope
ass-essment of body compartments (e.g. body water, lean and fat mass); radiation-determined body compartments measured by dual energy X-ray absorptiometry (DEXA) and computerized tomography; electrical impedance and conductivity to determine body compartments; and finally, magnetic resonance imaging and spectroscopy of body and organ com-partments (i.e. brain and muscle high energy phosphate content) (25,26).
• Bioavailability: evaluating stable and radioactive isotopes of mineral and
vitamin absorption and utilization (7,27).
• Gene expression: assessing the expression of multiple human mRNA with
tools provide a powerful means of assessing the amount of nutrient required to trigger a specific mRNA response in a given tissue. These are in fact the best criteria for defining selenium needs without having to measure the key selenium dependent enzymes (i.e. liver or red blood cell glutathione peroxidase [GSHPx]) (28). In this case the measurement of suf-ficiency is based on the GSHPx–mRNA response to selenium supply rather than measuring the enzymatic activity of the corresponding protein. Micro-array systems tailored to evaluate nutrient modulated expression of key genes may become the most effective way of assessing human nutri-tional requirements in the future (29).
1.3.4 Optimal intake
Optimal intake is a relatively new approach to deriving nutrient requirements. The question “Optimal intake for what?” is usually answered with the sug-gestion that a balanced diet or specific nutrients can improve physical and mental performance, enhance immunity, prevent cancer, or add healthy years to our life. This response is unfortunately often used too generally, and is usually unsupported by appropriate population-based controlled randomized studies (15). The preferred approach to define optimal intake is to clearly establish the function of interest and the level of desired function (30). The selected function should be related in a plausible manner to the specific nutri-ent or food and serve to promote health or prevnutri-ent disease.
Planners using RNIs are often faced with different, sometimes conflicting numbers, recommended by respectable national scientific bodies that have used varying approaches to define them (31,32). In order to select the most appropriate for a given population, national planners should consider the information base and the criteria that led to the numerical derivation before determining which correspond more closely with the setting for which the food-based dietary guidelines are intended. The quantified RNI estimates derived from these various approaches may differ for one or more specific nutrients, but the effect of these numeric differences in establishing food-based dietary guidelines for the general population is often of a lesser signif-icance (2,12, 33). Selected examples of how various criteria are used to define numerical estimates of nutritional requirements are given below. More detail is provided in the respective chapters on individual micronutrients that follow.
Calcium
Adequate calcium intake levels suggested for the United States of America are higher than those accepted internationally, and extend the increased needs of adolescents to young adults (i.e. those aged <24 years) on the basis of evidence
that peak bone mass continues to increase until that age is reached (see Chapter 4). Results of bone density measurements support the need for calcium intake beyond that required for calcium balance and retention for growth. However, the situation in most Asian countries suggests that their populations may have sufficient calcium retention and bone mass despite lower levels of intake. This report acknowledges these differences and suggests that calcium intake may need to be adjusted for dietary factors (e.g. observed animal protein, sodium intake, vitamin D intake) and for sun exposure (which is related to geographic location/latitude, air pollution and other environmental conditions), since both affect calcium retention.
Iron
bioavailability of iron in the diet. Recommended RNIs are provided for four bioavailability factors, 5%, 10%, 12% and 15%, depending on the composi-tion of the typical local diet (see Chapter 13).
Folate
Food fortification or supplementation strategies will commonly be needed to satisfy the 400mg/day folate recommended for adolescents and adults in this report (based on the intake required before conception and during early preg-nancy to prevent neural tube defects) (35). Consumption from traditional food sources is not sufficient to meet this goal; however, food fortification and the advent of novel foods developed by traditional breeding or by genetic modification may eventually make it possible to meet the RNI with food-based approaches.
1.4 Conclusions
The quantitative definition of nutrient needs and their expression as recom-mended nutrient intakes have been important components of food and nutri-tion policy and programme implementanutri-tion. RNIs provide the firm scientific basis necessary to satisfy the requirements of a group of healthy individuals and define adequacy of diets. Yet, by themselves, they are not sufficient as instruments of nutrition policy and programmes. In fact, single nutrient-based approaches have been of limited use in the establishment of nutritional and dietary priorities consistent with broad public health interests at the national and international levels (36).
concepts are exemplified in the lower part of the scheme. Nutrition educa-tion, health and nutrition promoeduca-tion, household food security and the pro-duction of micronutrient-rich foods all require nutritional requirements based on the best available scientific information. As the science base for nutrition evolves, so too will the estimates of nutritional requirements, which, when combined with FBDGs, will lead to greater accuracy with respect to applica-tions and policy-making and will enhance the health of final users.
We have gone beyond the era of requirements to prevent deficiency and excess to the present goal of preserving micronutrient-related functions. The next step in this evolution will surely be the incorporation of the knowledge and necessary tools to assess genetic diversity in the redefinition of nutritional requirements for optimal health throughout the life course. The goal in this case will be to meet the nutritional needs of population groups, while account-ing for genetic heterogeneity within populations (37). Though this may lead
Nutritional requirements
Nutrient-based vitamin and mineral recommendations
Micronutrient composition and bioavailability in foods
Food intake distribution of population groups
Relevant micronutrient deficiencies and excess
Food supply and excess
Nutrient intake goals
Food-based vitamin and mineral dietary guidelines
Production of micro-nutrient-rich foods Micronutrient
house-hold food security Health/nutrition promotion Nutrition education • Consumers • Professionals • Nutrition labels • Nutrition/health
claims • Advocacy:
policy-makers and politicians
• Design of nutrition programmes and healthy diets • Physical activity • Promotion of healthy
(nutrient-rich) diets • Prevention of death
and disability
• Home gardens • Community projects • Cooking and food
preservation methods • Food combinations • Food distribution and
trade
• Increase rich foods: vegetables,
fruits, legumes • Soil, seeds, plant and
animal breeding • Food fortification • Novel foods
The boxes at the bottom of the scheme exemplify the multiple final users of this knowledge and the implications for policy and programmes.
FIGURE 1.3
to the apparent contradiction of attempting to meet the requirements of pop-ulations based on the diverse and heterogeneous needs of individuals, it is in fact, a necessary step in providing optimal health—a long life, free of physi-cal and mental disability—to all individuals.
References
1. Young VR. W.O. Atwater Memorial Lecture and the 2001 ASNS President’s Lecture. Human nutrient requirements: the challenge of the post-genome era.
Journal of Nutrition, 2002, 132:621–629.
2. Uauy R, Hertrampf E. Food-based dietary recommendations: possibilities and limitations. In: Bowman B, Russell R, eds. Present knowledge in nutrition, 8th ed. Washington, DC, International Life Sciences Institute Press, 2001:636–649. 3. Aggett PJ et al. Recommended dietary allowances (RDAs), recommended dietary intakes (RDIs), recommended nutrient intakes (RNIs), and population reference intakes (PRIs) are not “recommended intakes”. Journal of Pediatric and Gastroenterology Nutrition, 1997, 25:236–241.
4. Food and Nutrition Board.Dietary reference intakes: applications in dietary assessment. Washington, DC, National Academy Press, 2001.
5. Trace elements in human nutrition and health. Geneva, World Health Organization, 1996.
6. Energy and protein requirements. Report of a Joint FAO/WHO/UNU Expert Consultation. Geneva, World Health Organization, 1985 (WHO Technical Report Series, No. 724; http://whqlibdoc.who.int/trs/WHO_TRS_724_ (chp1--chp6).pdf, accessed 26 June 2004; http://whqlibdoc.who.int/trs/ WHO_TRS_724_(chp7–chp13).pdf, accessed 26 June 2004).
7. Cook JD, Reddy MB. Effect of ascorbic acid intake on nonheme-iron absorp-tion from a complete diet. American Journal of Clinical Nutrition, 2001, 73:93–98.
8. Olivares M, Araya M, Uauy R. Copper homeostasis in infant nutrition: deficit and excess. Journal of Pediatric and Gastroenterology Nutrition, 2000, 31: 102–111.
9. Principles and methods for the assessment of risk from essential trace elements.
Geneva, World Health Organization, 2002 (Environmental Health Criteria, No. 228).
10. Food and Nutrition Board. Dietary reference intakes. A risk assessment model for establishing upper intake levels for nutrients. Washington, DC, National
Academy Press, 1999.
11.Assessing human health risks of chemicals: derivation of guidance values for health-based exposure limits. Geneva, World Health Organization, 1994 (Environmental Health Criteria, No. 170).
12.Preparation and use of food-based dietary guidelines. Report of a Joint FAO/WHO Consultation.Geneva, World Health Organization, 1996 (WHO Technical Report Series, No. 880).
13. Hegsted M, Linkswiler HM. Long-term effects of level of protein intake on calcium metabolism in young adult women. Journal of Nutrition, 1981, 111:244–251.
15. Food and Nutrition Board. Dietary reference intakes for vitamin C, vitamin E, selenium, and carotenoids. Washington, DC, National Academy Press, 2000. 16. Fenstrom J, Uauy R, Arroyo P, eds. Nutrition and brain. Basel, Karger AG,
2001.
17. Lozoff B. Perinatal iron deficiency and the developing brain. Pediatric Research, 2000, 48:137–139.
18. Carlson SE, Neuringer M. Polyunsaturated fatty acid status and neuro-development: a summary and critical analysis of the literature. Lipids, 1999,
34:171–178.
19. Flohr F et al. Bone mineral density and quantitative ultrasound in adults with cystic fibrosis. European Journal of Endocrinology, 2002, 146:531–536.
20. Black AJ et al. A detailed assessment of alterations in bone turnover, calcium homeostasis, and bone density in normal pregnancy. Journal of Bone and Mineral Research, 2000, 15:557–563.
21. Prohaska JR, Brokate B. Lower copper, zinc-superoxide dismutase protein but not mRNA in organs of copper-deficient rats. Archives of Biochemistry and Biophysics, 2001, 393:170–176.
22. Mize CE et al. Effect of phosphorus supply on mineral balance at high calcium intakes in very low birth weight infants. American Journal of Clinical Nutri-tion, 1995, 62:385–391.
23. Chandra RK. Nutrition and the immune system from birth to old age. Euro-pean Journal of Clinical Nutrition, 2002, 56(Suppl. 3):S73–S76.
24. Sandstrom B et al. Acrodermatitis enteropathica, zinc metabolism, copper status, and immune function. Archives of Pediatrics and Adolescent Medicine, 1994, 148:980–985.
25. Bertocci LA, Mize CE, Uauy R. Muscle phosphorus energy state in very-low-birth-weight infants: effect of exercise. American Journal of Physiology,
1992, 262:E289–E294.
26. Mayfield SR, Uauy R, Waidelich D. Body composition of low-birth-weight infants determined by using bioelectrical resistance and reactance. American Journal of Clinical Nutrition,1991, 54:296–303.
27. Lonnerdal B. Bioavailability of copper. American Journal of Clinical Nutri-tion,1996, 63(Suppl.):S821–S829.
28. Weiss Sachdev S, Sunde RA. Selenium regulation of transcript abundance and translational efficiency of glutathione peroxidase-1 and -4 in rat liver. Bio-chemical Journal, 2001, 357:851–858.
29. Endo Y et al. Dietary protein quantity and quality affect rat hepatic gene expression. Journal of Nutrition, 2002, 132:3632–3637.
30. Koletzko B et al. Growth, development and differentiation: a functional food science approach. British Journal of Nutrition, 1998, 80(Suppl. 1):S5– S45.
31. Howson CP, Kennedy ET, Horwitz A, eds. Prevention of micronutrient defi-ciencies. Tools for policymakers and public health workers. Washington, DC,
National Academy Press, 1998.
32.Preventing iron deficiency in women and children: technical consensus on key issues. Boston, The International Nutrition Foundation, and Ottawa, The Micronutrient Initiative, 1999 (http://www.micronutrient.org/resources/ publications/nvironbk.pdf, accessed 24 June 2004).
United States Department of Agriculture, 2000 (http://www.health.gov/ dietaryguidelines/dga2000/document/frontcover.htm, accessed 24 June 2004). 34. Albonico M et al. Epidemiological evidence for a differential effect of hook-worm species, Ancylostoma duodenaleor Necator americanus, on iron status
of children. International Journal of Epidemiology, 1998, 27:530–537.
35. Oakley GP, Adams MJ, Dickinson CM. More folic acid for everyone, now.
Journal of Nutrition, 1996, 126(Suppl.):S751–S755.
36.International Conference on Nutrition. World declaration and plan of action for nutrition, 1992. Rome, Food and Agriculture Organization of the United Nations, 1992.
2.1 Role of vitamin A in human metabolic processes
Vitamin A (retinol) is an essential nutrient needed in small amounts by humans for the normal functioning of the visual system; growth and devel-opment; and maintenance of epithelial cellular integrity, immune function, and reproduction. These dietary needs for vitamin A are normally provided for as preformed retinol (mainly as retinyl ester) and provitamin A carotenoids.
2.1.1 Overview of vitamin A metabolism
Preformed vitamin A in animal foods occurs as retinyl esters of fatty acids in association with membrane-bound cellular lipid and fat-containing storage cells. Provitamin A carotenoids in foods of vegetable origin are also associ-ated with cellular lipids but are embedded in complex cellular structures such as the cellulose-containing matrix of chloroplasts or the pigment-containing portion of chromoplasts. Normal digestive processes free vitamin A and carotenoids from food matrices, which is a more efficient process from animal than from vegetable tissues. Retinyl esters are hydrolysed and the retinol and freed carotenoids are incorporated into lipid-containing, water-miscible micellar solutions. Products of fat digestion (e.g. fatty acids, monoglycerides, cholesterol, and phospholipids) and secretions in bile (e.g. bile salts and hydrolytic enzymes) are essential for the efficient solubilization of retinol and especially for solubilization of the very lipophilic carotenoids (e.g. a- and b
enterocytes. Some carotenoids pass into the enterocyte and are solubilized into chylomicrons without further change whereas some of the provitamin A carotenoids are converted to retinol by a cleavage enzyme in the brush border (3). Retinol is trapped intracellularly by re-esterification or binding to specific intracellular binding proteins. Retinyl esters and unconverted carotenoids together with other lipids are incorporated into chylomicrons, excreted into intestinal lymphatic channels, and delivered to the blood through the thoracic duct (2).
Tissues extract most lipids and some carotenoids from circulating chy-lomicrons, but most retinyl esters are stripped from the chylomicron remnant, hydrolysed, and taken up primarily by parenchymal liver cells. If not imme-diately needed, retinol is re-esterified and retained in the fat-storing cells of the liver (variously called adipocytes, stellate cells, or Ito cells). The liver parenchymal cells also take in substantial amounts of carotenoids. Whereas most of the body’s vitamin A reserve remains in the liver, carotenoids are also deposited elsewhere in fatty tissues throughout the body (1). Usually, turnover of carotenoids in tissues is relatively slow, but in times of low dietary carotenoid intake, stored carotenoids are mobilized. A recent study in one subject using stable isotopes suggests that retinol can be derived not only from conversion of dietary provitamin carotenoids in enterocytes—the major site of bioconversion—but also from hepatic conversion of circulating provitamin carotenoids (5). The quantitative contribution to vitamin A requirements of carotenoid converted to retinoids beyond the enterocyte is unknown.
Following hydrolysis of stored retinyl esters, retinol combines with a plasma-specific transport protein, retinol-binding protein (RBP). This process, including synthesis of the unoccupied RBP (apo-RBP), occurs to the greatest extent within liver cells but it may also occur in some peripheral tissues. The RBP-retinol complex (holo-RBP) is secreted into the blood where it associates with another hepatically synthesized and excreted larger protein, transthyretin. The transthyretin-RBP-retinol complex circulates in the blood, delivering the lipophilic retinol to tissues; its large size prevents its loss through kidney filtration (1). Dietary restriction in energy, proteins, and some micronutrients can limit hepatic synthesis of proteins specific to mobilization and transport of vitamin A. Altered kidney functions or fever associated with infections (e.g. respiratory infections (6) or diarrhoea [7]) can increase urinary vitamin A loss.
that subsequently can provide functionally active retinol and its oxidation products (i.e. isomers of retinoic acid) as needed intracellularly. These bio-logically active forms of vitamin A are associated with specific cellular proteins which bind with retinoids within cells during metabolism and with nuclear receptors that mediate retinoid action on the genome (9). Retinoids modulate the transcription of several hundreds of genes (10–12). In addition to the latter role of retinoic acid, retinol is the form required for functions in the visual (13) and reproductive systems (14) and during embryonic develop-ment (15).
Holo-RBP is filtered into the glomerulus but recovered from the kidney tubule and recycled. Normally vitamin A leaves the body in urine only as inactive metabolites resulting from tissue utilization and in bile secretions as potentially recyclable active glucuronide conjugates of retinol (8). No single urinary metabolite has been identified which accurately reflects tissue levels of vitamin A or its rate of utilization. Hence, at this time urine is not a useful biological fluid for assessment of vitamin A nutriture.
2.1.2 Biochemical mechanisms for vitamin A functions
secre-tions and cells (11). Classical symptoms of xerosis (drying or non-wetability) and desquamation of dead surface cells as seen in ocular tissue (i.e. xeroph-thalmia) are the external evidence of the changes also occurring to various degrees in internal epithelial tissues.
Current understanding of the mechanism of vitamin A action within cells outside the visual cycle is that cellular functions are mediated through spe-cific nuclear receptors. Binding with spespe-cific isomers of retinoic acid (i.e.
all-trans- and 9-cis-retinoic acid) activates these receptors. Activated receptors
bind to DNA response elements located upstream of specific genes to regu-late the level of expression of those genes (12). These retinoid-activated genes regulate the synthesis of a large number of proteins vital to maintaining normal physiologic functions. There may, however, be other mechanisms of action that are as yet undiscovered (10).
2.2 Populations at risk for, and consequences of,
vitamin A deficiency
2.2.1 Definition of vitamin A deficiency
VAD is not easily defined. WHO defines it as tissue concentrations of vitamin A low enough to have adverse health consequences even if there is no evi-dence of clinical xerophthalmia (16). In addition to the specific signs and symptoms of xerophthalmia and the risk of irreversible blindness, non-specific symptoms include increased morbidity and mortality, poor repro-ductive health, increased risk of anaemia, and contributions to slowed growth and development. However, these nonspecific adverse effects may be caused by other nutrient deficits as well, making it difficult to attribute non-ocular symptoms specifically to VAD in the absence of biochemical measurements reflective of vitamin A status.
2.2.2 Geographic distribution and magnitude
of the confounding and poorly quantified role of infections (see section 2.2.5).
Epidemiological studies repeatedly report clustering of VAD, presumably resulting from concurrent occurrences of several risk factors. This clustering may occur among both neighbourhoods and households (18).
2.2.3 Age and sex
VAD can occur in individuals of any age. However, it is a disabling and poten-tially fatal public health problem for children under 6 years of age. VAD-related blindness is most prevalent in children under 3 years of age (19). This period of life is characterized by high requirements for vitamin A to support rapid growth, and the transition from breastfeeding to dependence on other dietary sources of the vitamin. In addition, adequate intake of vitamin A reduces the risk of catching respiratory and gastrointestinal infections. The increased mortality risk from concurrent infections extends at least to 6 years of age and is associated with both clinical and subclinical VAD (20). There is little information regarding the health consequences of VAD in school-age children. The prevalence of Bitot’s spots (i.e. white foamy patches on the con-junctiva) may be highest in this age group but their occurrence may reflect past more than current history of VAD (21). Women of reproductive age are also thought to be vulnerable to VAD during pregnancy and lactation because they often report night blindness (22, 23) and because their breast milk is
fre-TABLE 2.1
Estimates of clinical and subclinical vitamin A deficiency in preschool children, by WHO regiona
Subclinical (severe
Clinical and moderate) Prevalence Region (millions) (millions) (%)
Africa 1.04 52 49
The Americas 0.06 16 20
South-East Asia 1.45 125 69
Europe NA NA NA
Eastern
Mediterranean 0.12 16 22
Western Pacific 0.13 42 27
Subtotal 2.80 251
Total 254
NA, not applicable.
a Based on a projection for 1994 from those countries in each region where data were available.
quently low in vitamin A (24, 25). Not all night blindness in pregnant women, however, responds to vitamin A treatment (23).
There is no consistent, clear indication in humans of a sex differential in vitamin A requirements during childhood. Growth rates, and presumably the need for vitamin A, from birth to 10 years for boys are consistently higher than those for girls (26). In the context of varied cultural and community settings, however, variations in gender-specific child-feeding and care prac-tices are likely to subsume a small sex differential in requirements to account for reported sex differences in the prevalence of xerophthalmia. Pregnant and lactating women require additional vitamin A to support maternal and fetal tissue growth and lactation losses, additional vitamin A which is not needed by other post-adolescent adults (27).
2.2.4 Risk factors
VAD is most common in populations consuming most of their vitamin A needs from provitamin carotenoid sources and where minimal dietary fat is