VOL. 2, NO. 2, pp. 44 – 48, May, 2012
Qualitative Analysis of Subsurface Water Quality in Challakere Taluk,
Karnataka, India
H. Manjunatha1, S. Thirumala1*, H.B. Aravinda2 and E.T. Puttaiah3
1
Department of PG Studies and Research in Environmental Science, Kuvempu University, Shankaraghatta, Karnataka, India
2
Department of Environmental Science, Govt. first Grade College & P G Centre Davangere, Karnataka, India
3
Department of Civil Engineering, Bapuji institute of Engineering technology Davangere, Karnataka, India.
ABSTRACT
Rural India relies mainly on groundwater for drinking and agriculture. Unsustainable withdrawal of groundwater has led to the spectra of depleting the problem of water scarcity. The available groundwater quality is not only contaminated by hazardous pathogenic germs and anthropogenic substances but also geogenic substances is adversely affect the water supply of many regions. The groundwater of Challakere taluk had many threats such as anthropogenic activities, quality deterioration by agricultural activities and over exploitation and also persistence of continuous drought condition. This paper mainly addresses the physico-chemical concentration of 30 groundwater samples during August 2009 in Challakere taluk, Karnataka (India). The results of all the findings are discussed in details which reflect the present status of the groundwater quality of the study area. Groundwater is extremely important to the future economy and growth of rural India. If the resource is to remain available as high quality water for future generation it is important to protect from possible contamination. Hence it is recommended that suitable water quality management is essential to avoid any further contamination.
Keywords: Groundwater quality analysis, Challakere, Subsurface Water Quality, Karnataka
INTRODUCTION
Rural India relies mainly on groundwater for drinking and agriculture. Villages once relied on sources like wells, lakes, ponds and streams for their water needs. Contamination of most surface water sources has rendered them unfit for consumption. And also increase in water demand by an increasing population has necessitated resource to tapping groundwater. Unsustainable withdrawal of groundwater has led to the spectra of depleting the problem of water scarcity. Every human society, be it rural or urban, industrially or technologically advanced, disposal of waste exceeds the limit of natural scavenging or removal process, they are bound to effect the normal functioning of the ecosystems and consequently they bear an adverse effect on the biota (Miller, 1984).
Supplying inhabitants with safe and clean drinking water is one of the most common *Corresponding address:
S. Thirumala
Department of PG Studies and Research in Environmental Science, Kuvempu University, Shankaraghatta – 577451, Shimoga Dist., Karnataka, India
Email: [email protected]
problems in developing countries like India, especially in arid and semi-arid regions. The available groundwater quality is not only contaminated by hazardous pathogenic germs and anthropogenic substances but also geogenic substances are adversely affects the water supply of many regions. The groundwater of Challakere taluk had many threats such as anthropogenic activities, quality deterioration by agricultural activities and over exploitation and also persistence of continuous drought condition .With this background an effort has been made to know the quality of groundwater in this region.
MATERIALS AND METHODS
Study area
average elevation of about 500.M msl (Gazetteer of India, 1981).
Meteorology
The climate of Challakere taluk comes under drought prone area. The precipitation and distribution of rainfall in study area is highly erratic. The annual average rainfall is 650mm received over 40 rainy days. It varies from as low as 620 mm in the east and as high as 750 mm in west. About 2/3rd of the geological area of
Challakere taluk receives less than 700 mm of annual rainfall. The study area had been receiving rainfall mainly from southwest monsoon and slightly from northeast monsoon. Most of the rainfall over this area is contributed by a very poor intensity of rainfall events. The monthly mean temperature ranges from 8.0 to 48°C.
Analysis of the samples
The groundwater samples from the 30 sampling sites were collected and analyzed during August 2009. Groundwater samples from the sampling sites were collected from the bore wells. Initially the water was allowed to run for 15 minutes in order to flush out stationary water. Further, the sample bottles were also flushed with water before the samples were collected. The parameters of water such as, total dissolved solids, electrical conductivity and pH were analyzed on the spot with the help of water analysis kit (Elico). The remaining parameters were analyzed in the laboratory. Hence, the water was carried to the laboratory in suitable inert bottles. The samples were analyzed using analytical method of APHA (1995) and all analysis was done in triplicate.
RESULT AND DISCUSSION
Water analysis was carried out, by taking 10 parameters, which are very essential to know the water qualities for drinking purpose. The findings of the present investigation are summarized in Table 1, and it has been compared with BIS 1998 drinking water standards, Table 2 which provides the comprehensive picture of the physico-chemical characteristics of groundwater in the study area.
Turbidity (TUR)
In the present study the turbidity values ranged between 0.10 and 60 NTU. The BIS (1998) acceptable limit for turbidity is 25 NTU. It is proved from the present study, 12% of total number of samples cross their permissible limit
with reference to the BIS (1998) standards. It is observed from the results that these parameters which crossed their permissible limit were unfit for drinking purposes. It causes health problems like gastro-intestinal disorders, headache and also associated with respiratory diseases (Maiti, 1982).
pH
In the present investigation, pH values found to be 6.7 to 8.7. The recommended value of pH for drinking purposes is between 6.5 and 8.5 (BIS, 1998). In the present study all the water samples analyzed are all well within the safer limits except in few sampling stations. However, higher values of pH hasten the scale formation in water heaters and reduce the germicidal potential of chlorine (Mohapathra and Purohit, 2000).
Electrical conductivity (EC)
The values of electrical conductivity ranged
between 90 μmhos/cm to 2100 μmhos/cm. Nevertheless, Higher the concentration of acid, base and salts in water, higher will be the EC. The variability of EC could be explained to the natural concentration of ionised substances present in water (Kataria and Jain, 1995). However the higher values of electrical
conductivity (>2000 μmhos/cm), may be due to
long residence time and well lithology.
Total dissolved solids (TDS)
It is justified from the analytical report for TDS values ranges from 92 mg/L to 1990 mg/L and values shows that were well with in the permissible limit. However, groundwater chemistry changes as the water flows through the subsurface and the increase in geological environment and dissolved solids and major ions. Chebotarev (1985), Ramababu and Somashekara Rao (1986) and Joseph (2001) expressed the dissolution of soil particles containing minerals under slightly alkaline condition, favour the TDS concentration in groundwater. However TDS concentration above the permissible limit (1500 ppm) causes gastrointestinal irritation (Shankar and Muttukrishnan, 1994).
Total hardness (TH)
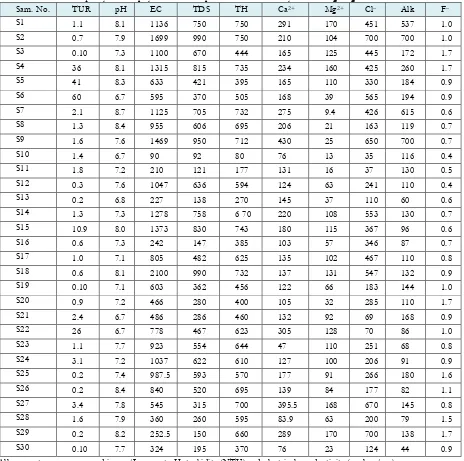
Table 1. Groundwater quality data of physico-chemical parameters of the study sites during August 2009
Sam. No. TUR pH EC TDS TH Ca2+ Mg2+ Cl– Alk F–
S1 1.1 8.1 1136 750 750 291 170 451 537 1.0
S2 0.7 7.9 1699 990 750 210 104 700 700 1.0
S3 0.10 7.3 1100 670 444 165 125 445 172 1.7
S4 36 8.1 1315 815 735 234 160 425 260 1.7
S5 41 8.3 633 421 395 165 110 330 184 0.9
S6 60 6.7 595 370 505 168 39 565 194 0.9
S7 2.1 8.7 1125 705 732 275 9.4 426 615 0.6
S8 1.3 8.4 955 606 695 206 21 163 119 0.7
S9 1.6 7.6 1469 950 712 430 25 650 700 0.7
S10 1.4 6.7 90 92 80 76 13 35 116 0.4
S11 1.8 7.2 210 121 177 131 16 37 130 0.5
S12 0.3 7.6 1047 636 594 124 63 241 110 0.4
S13 0.2 6.8 227 138 270 145 37 110 60 0.6
S14 1.3 7.3 1278 758 6 70 220 108 553 130 0.7
S15 10.9 8.0 1373 830 743 180 115 367 96 0.6
S16 0.6 7.3 242 147 385 103 57 346 87 0.7
S17 1.0 7.1 805 482 625 135 102 467 110 0.8
S18 0.6 8.1 2100 990 732 137 131 547 132 0.9
S19 0.10 7.1 603 362 456 122 66 183 144 1.0
S20 0.9 7.2 466 280 400 105 32 285 110 1.7
S21 2.4 6.7 486 286 460 132 92 69 168 0.9
S22 26 6.7 778 467 623 305 128 70 86 1.0
S23 1.1 7.7 923 554 644 47 110 251 68 0.8
S24 3.1 7.2 1037 622 610 127 100 206 91 0.9
S25 0.2 7.4 987.5 593 570 177 91 266 180 1.6
S26 0.2 8.4 840 520 695 139 84 177 82 1.1
S27 3.4 7.8 545 315 700 395.5 168 670 145 0.8
S28 1.6 7.9 360 260 595 83.9 63 200 79 1.5
S29 0.2 8.2 252.5 150 660 289 170 700 138 1.7
S30 0.10 7.7 324 195 370 76 23 124 44 0.9
All parameters are expressed in mg/L, except pH, turbidity (NTU)and electrical conductivity (mhos/cm)
Table 2. Comparison of Groundwater quality data with Drinking water Standard (BIS, 1998)
Sl. No. Parameters BIS (1998) Observed values
P E Minimum Maximum
1 Turbidity 5 25 0.10 60
2 pH 6.5 8.5 6.7 8.7
3 EC - - 90 2100
4 TDS 500 1000 92 990
5 Total hardness 300 600 80 750
6 Calcium 75 200 76 430
7 Magnesium 30 100 13 170
8 Chloride 250 1000 35 700
9 Alkalinity 200 600 60 700
10 Fluoride 0.3-1.2 1.5 0.4 1.7
Note : P = Permissible limit, E = Excessive limit
(1998) drinking water standards. Owing to fact that higher amount of hardness in the study area comes mainly from the leaching of igneous rock and carbonate rocks (dolomite, calcite and limestone). Water containing the soluble salts of calcium and magnesium such as chlorides, sulphates and bicarbonates are also governs the quality of water (Ramaswamy and Rajaguru, 1991). The adverse effects of total hardness are formation of kidney stone and the heart diseases (Sastry and Rathee, 1998). Nevertheless, groundwater chemistry is controlled by the composition of its recharge components as well as by geological and hydrological variations (Narayana and Suresh, 1989).
Calcium (Ca2 +)
Present investigation reports stated for
calcium values ranged from 76 mg/L to 430 mg/L, with a mean value of 184.99 mg/L.
The BIS (1998) acceptable limit for calcium is 200 mg/L. However, in the present study 30% of water samples cross the permissible limit. Presence of higher amount of calcium in the study area may be due to groundwater receives the calcium minerals leached from the rocks and other deposits like limestone, dolomites, calcite, gypsum, amphiboles, feldspar, and clay minerals leaching or weathering of igneous rocks. Sewage and domestic waste are also important sources of calcium (Mishra and Saxena, 1989).
Magnesium (Mg2 +)
Investigation report reveals for the magnesium values ranged from 3.5 mg/L to a 170 mg/L .however, BIS (1998) acceptable limit for magnesium is 100 mg/L and in the present study 65% of the groundwater samples crossed the permissible range. Magnesium arises principally from the weathering of rocks contain ferro-magnesium minerals and some carbonate rocks. High concentration of magnesium proves to be diuretic and laxative (Schroeder 1960).
Chloride (Cl-)
Chloride is also one of the important parameter to know the quality of water. Anthropogenic sources of chlorides include fertilizer, road salt, human and animal waste. Concentration of chlorides is considered to be an indicator of organic pollution of animal origin (Kumara, 2002).
Here, Chloride values ranged from 35 mg/L to 700 mg/L. In the present investigation, the values of chloride for all the sampling sites are
with in the permissible range as prescribed by BIS (1998) drinking water standards. However, dissolving of the soil constituents had contributed the chloride into the groundwater and also the soil characteristics play an important role in contributing the chloride content in the groundwater (Shivasankaran, 1997).
Total alkalinity
In the present study t
o
tal alkalinity values ranged from a 60 mg/L to 700 mg/L. The BIS (1998) acceptable limit for total alkalinity is 600mg/L. In the present study, the data revealed that 10% of water samples in the study area crossed the permissible limit. When alkalinity of water exceeds the permissible limits, it is likely to produce incrustation sediment deposits, difficulties in chlorination, certain physiological effects on human systems etc. (Raviprakash and Rao, 1989). The constituents of alkalinity result from dissolution of mineral substances in the soil and atmosphere contributes to alkalinity in groundwater (Mittal and Verma, 1997).Fluoride (F-)
In the present investigation, fluoride values varied from 0.4 mg/L to 1.7 mg/L the BIS (1998) acceptable limit for fluoride is 1.5 mg/L. In the present study, 15% of total number of water samples in present investigations has crossed the permissible range as prescribed by BIS (1998) drinking water standards. Degree of weathering and leachable fluoride in terrain is of great significance for the fluoride present in groundwater than the mere presence of fluoride bearing minerals in rocks (Kumar et al., 2000).
Intake of excess fluoride causes dental, skeletal and skeletal fluorosis. The non-skeletal fluorosis can be observed such as gastrointestinal complaints, intermittent diarrhoea and flatulence in expectant and lactating mothers hardworking young adults and children. Therefore, fluorosis has been considered as one of the incurable diseases. Hence, prevention is the only solution for the disease (Hem, 1985).
CONCLUSION
physico-chemical characteristics in groundwater. The factors like slow circulation, longer period of contact between aquifer and water, dissolving of minerals at the time of weathering, residential time, drainage pattern and surface water link. Porosity of the soil and rock also alters the characteristics of the groundwater. The high level contents of the parameters observed may be minimized if the groundwater is recharged with the available water in the rainy season. This not only dilutes the constituents of the groundwater but also raises the groundwater level that depletes due to large-scale exploitation.
REFERENCES
1. APHA (1995) Standard methods for the examination of water and wastewater; 18th edition, AWWA, WPCF, New York. 1120. 2. BIS (1998) Specifications for drinking water,
New Delhi. 171-178.
3. Chebotarev (1985) Metamorphism of natural waters in the crust of weathering Geochem, Cosmochim. Acta. 8:22-28.
4. Gazetteer of India, Karnataka State, Chikmagalure district (1981). 8-15 and 630-633. 5. Hem JD (1985) Study and interpretation of the
chemical characteristics of natural water. 3rd ed. U.S. Geological Survey. Water Supply Paper. 225:263.
6. Joseph W (2001) Groundwater chemistry in the valley De Yabucoa alluvial aquifer, Southeastern Pnerto Rico. AWRA 3rd International Symposium on Tropical Hydrology San Juan U.S.A.
7. Kataria HC, OP Jain (1995) Physico-chemical analysis of river Ajhar. Indian Journal of Environmental Protection. 5: 569-571.
8. Kumar P Kumari, LKR Singh (2000)
Environmental Biology P.G. Dept. of Zoology, SK University. Dumka. Jharkand. 180-182. 9. Kumar (2002) Ecology of polluted waters.
1:144-180.
10. Maiti TC (1982) Science reporter. 19:360-361. 11. Miller DR (1984) Chemicals in the environment.
In: Effects of pollutant at the ecosystem level. John Wiley and Sons. Chinchester. 7.
12. Mishra SR, Saxena (1989) Industrial effluent pollution at Birla Nagar, Gwalior. Pollution, Research. 8(2):77-86.
13. Mittal SK, N Verma (1997) Critical analysis of groundwater quality parameters. Indian Journal of Environmental Protection. 17:426-429. 14. Mohapatra TK, KM Purohit (2000) Qualitative
aspects of surface and groundwater for drinking purpose in Paradeep area. Ecology of Polluted Waters. 1:144.
15. Narayana AC, GC Suresh (1989) Chemical quality of groundwater of Mangalore city,
Karnataka. Indian Journal of Environmental Health. 31:228-236.
16. Ramaswamy V, P Rajaguru (1991) Indian Journal of Environmental Health. 33(2): 187-191. 17. Rambabu C, K Somashekara Rao (1986) Studies
on the quality of bore well water by Nuzuid. Indian Journal of Environmental Protection. 16(7).
18. Raviprakash S, KG Rao (1989) The chemistry of groundwater, Parvada area with regard to their suitability for domestic and irrigation purposes. Indian Journal of Geochem. 4:39-54.
19. Sastry KV, P Rathee (1988) Physico-chemical and microbiological characteristics of water of village Kanneli, (Dist. Rohtak) Haryana. Proc. Academic. Environmental Biology. 7(1):103-108. 20. Schroeder HA (1960) Relation between hardness of water and death rates from certain chronic and degeneration diseases in the US. J Chron Dis. 12:568-573.
21. Shankar, Muttukrishan (1994) In situ bioremediation of contaminated groundwater. Proceedings of National Seminar on EPCR-04, UBDT Engineering college. Davangere. 32. 22. Shivashankaran MA (1997) Hydrogeochemical