123
S P R I N G E R B R I E F S I N C O M P U T E R S C I E N C E
Sherif Sakr
Big Data 2.0
Processing
Systems
Sherif Sakr
Big Data 2.0
Processing Systems
A Survey
Sherif Sakr
University of New South Wales Sydney, NSW
Australia
ISSN 2191-5768 ISSN 2191-5776 (electronic)
SpringerBriefs in Computer Science
ISBN 978-3-319-38775-8 ISBN 978-3-319-38776-5 (eBook) DOI 10.1007/978-3-319-38776-5
Library of Congress Control Number: 2016941097
©The Author(s) 2016
This work is subject to copyright. All rights are reserved by the Publisher, whether the whole or part of the material is concerned, specifically the rights of translation, reprinting, reuse of illustrations, recitation, broadcasting, reproduction on microfilms or in any other physical way, and transmission or information storage and retrieval, electronic adaptation, computer software, or by similar or dissimilar methodology now known or hereafter developed.
The use of general descriptive names, registered names, trademarks, service marks, etc. in this publication does not imply, even in the absence of a specific statement, that such names are exempt from the relevant protective laws and regulations and therefore free for general use.
The publisher, the authors and the editors are safe to assume that the advice and information in this book are believed to be true and accurate at the date of publication. Neither the publisher nor the authors or the editors give a warranty, express or implied, with respect to the material contained herein or for any errors or omissions that may have been made.
Printed on acid-free paper
This Springer imprint is published by Springer Nature
To my wife, Radwa,
my daughter, Jana,
and my son, Shehab
for their love, encouragement,
and support.
Foreword
Big Data has become a core topic in different industries and research disciplines as well as for society as a whole. This is because the ability to generate, collect, dis-tribute, process, and analyze unprecedented amounts of diverse data has almost universal utility and helps to change fundamentally the way industries operate, how research can be done, and how people live and use modern technology. Different industries such as automotive,finance, healthcare, or manufacturing can dramatically benefit from improved and faster data analysis, for example, as illustrated by current industry trends such as“Industry 4.0”and“Internet-of-Things.”Data-driven research approaches utilizing Big Data technology and analysis have become increasingly commonplace, for example, in the life sciences, geosciences, or in astronomy. Users utilizing smartphones, social media, and Web resources spend increasing amounts of time online, generate and consume enormous amounts of data, and are the target for personalized services, recommendations, and advertisements.
Most of the possible developments related to Big Data are still in an early stage but there is great promise if the diverse technological and application-specific challenges in managing and using Big Data are successfully addressed. Some of the technical challenges have been associated with different “V” characteristics, in particular Volume, Velocity, Variety, and Veracity that are also discussed in this book. Other challenges relate to the protection of personal and sensitive data to ensure a high degree of privacy and the ability to turn the huge amount of data into useful insights or improved operation.
A key enabler for the Big Data movement is the increasingly powerful and relatively inexpensive computing platforms allowing fault-tolerant storage and processing of petabytes of data within large computing clusters typically equipped with thousands of processors and terabytes of main memory. The utilization of such infrastructures was pioneered by Internet giants such as Google and Amazon but has become generally possible by open-source system software such as the Hadoop ecosystem. Initially there have been only a few core Hadoop components, in par-ticular its distributed file system HDFS and the MapReduce framework for the
relatively easy development and execution of highly parallel applications to process massive amounts of data on cluster infrastructures.
The initial Hadoop has been highly successful but also reached its limits in different areas, for example, to support the processing of fast changing data such as datastreams or to process highly iterative algorithms, for example, for machine learning or graph processing. Furthermore, the Hadoop world has been largely decoupled from the widespread data management and analysis approaches based on relational databases and SQL. These aspects have led to a large number of addi-tional components within the Hadoop ecosystem, both general-purpose processing frameworks such as Apache Spark and Flink as well as specific components, such as for data streams, graph data, or machine learning. Furthermore, there are now numerous approaches to combine Hadoop-like data processing with relational database processing (“SQL on Hadoop”).
The net effect of all these developments is that the current technological land-scape for Big Data is not yet consolidated but there are many possible approaches within the Hadoop ecosystem and also within the product portfolio of different database vendors and other IT companies (Google, IBM, Microsoft, Oracle, etc.). The book Big Data 2.0 Processing Systems by Sherif Sakr is a valuable and up-to-date guide through this technological“jungle”and provides the reader with a comprehensible and concise overview of the main developments after the initial MapReduce-focused version of Hadoop. I am confident that this information is useful for many practitioners, scientists, and students interested in Big Data technology.
University of Leipzig, Germany Erhard Rahm
Preface
We live in an age of so-called Big Data. The radical expansion and integration of computation, networking, digital devices, and data storage have provided a robust platform for the explosion in Big Data as well as being the means by which Big Data are generated, processed, shared, and analyzed. In thefield of computer sci-ence, data are considered as the main raw material which is produced by abstracting the world into categories, measures, and other representational forms (e.g., char-acters, numbers, relations, sounds, images, electronic waves) that constitute the building blocks from which information and knowledge are created. Big Data has commonly been characterized by the defining 3V properties which refer to huge in volume, consisting of terabytes or petabytes of data; high in velocity, being created in or near realtime; and diversity in variety of type, being both structured and unstructured in nature . According to IBM, we are currently creating 2.5 quintillion bytes of data every day. IDC predicts that the worldwide volume of data will reach 40 zettabytes by 2020 where 85 % of all of these data will be of new datatypes and formats including server logs and other machine-generated data, data from sensors, social media data, and many other data sources. This new scale of Big Data has been attracting a lot of interest from both the research and industrial communities with the aim of creating the best means to process and analyze these data in order to make the best use of them. For about a decade, the Hadoop framework has dom-inated the world of Big Data processing, however, in recent years, academia and industry have started to recognize the limitations of the Hadoop framework in several application domains and Big Data processing scenarios such as large-scale processing of structured data, graph data, and streaming data. Thus, the Hadoop framework has been slowly replaced by a collection of engines dedicated to specific verticals (e.g., structured data, graph data, streaming data). In this book, we cover this new wave of systems referring to them as Big Data 2.0 processing systems.
This book provides the big picture and a comprehensive survey for the domain of Big Data processing systems. The book is not focused only on one research area or one type of data. However, it discusses various aspects of research and devel-opment of Big Data systems. It also has a balanced descriptive and analytical content. It has information on advanced Big Data research and also which parts
of the research can benefit from further investigation. The book starts by intro-ducing the general background of the Big Data phenomenon. We then provide an overview of various general-purpose Big Data processing systems that empower the user to develop various Big Data processing jobs for different application domains. We next examine the several vertical domains of Big Data processing systems: structured data, graph data, and stream data. The book concludes with a discussion of some of the open problems and future research directions.
We hope this monograph will be a useful reference for students, researchers, and professionals in the domain of Big Data processing systems. We also wish that the comprehensive reading materials of the book may influence readers to think further and investigate the areas that are novel to them.
To Students: We hope that the book provides you with an enjoyable introduction to thefield of Big Data processing systems. We have attempted to classify properly the state of the art and describe technical problems and techniques/methods in depth. The book provides you with a comprehensive list of potential research topics. You can use this book as a fundamental starting point for your literature survey.
To Researchers: The material of this book provides you with thorough coverage for the emerging and ongoing advancements of Big Data processing systems that are being designed to deal with specific verticals in addition to the general-purpose ones. You can use the chapters that are related to certain research interests as a solid literature survey. You also can use this book as a starting point for other research topics.
To Professionals and Practitioners: You willfind this book useful as it provides a review of the state of the art for Big Data processing systems. The wide range of systems and techniques covered in this book makes it an excellent handbook on Big Data analytics systems. Most of the problems and systems that we discuss in each chapter have great practical utility in various application domains. The reader can immediately put the gained knowledge from this book into practice due to the open-source availability of the majority of the Big Data processing systems.
Sydney, Australia Sherif Sakr
Acknowledgements
I am grateful to many of my collaborators for their contribution to this book. In particular, I would like to mention Fuad Bajaber, Ahmed Barnawi, Omar Batarfi, Seyed-Reza Beheshti, Radwa Elshawi, Ayman Fayoumi, Anna Liu, and Reza Nouri. Thank you all!
Thanks to Springer-Verlag for publishing this book. Ralf Gerstner encouraged and supported me to write this book. Thanks, Ralf!
My acknowledgments end with thanking the people most precious to me. Thanks for my parents for their encouragement and support. Many thanks for my daughter, Jana, and my son, Shehab, for the happiness and enjoyable moments they are always bringing to my life. My most special appreciation goes to my wife, Radwa Elshawi, for her everlasting support and deep love.
Sherif Sakr
Contents
1 Introduction. . . 1
1.1 The Big Data Phenomenon. . . 1
1.2 Big Data and Cloud Computing. . . 3
1.3 Big Data Storage Systems . . . 5
1.4 Big Data Processing and Analytics Systems. . . 8
1.5 Book Roadmap. . . 11
2 General-Purpose Big Data Processing Systems. . . 15
2.1 The Big Data Star: The Hadoop Framework . . . 15
2.1.1 The Original Architecture . . . 15
2.1.2 Enhancements of the MapReduce Framework. . . 19
2.1.3 Hadoop’s Ecosystem. . . 27
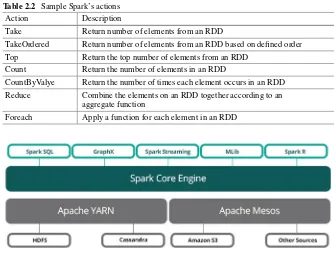
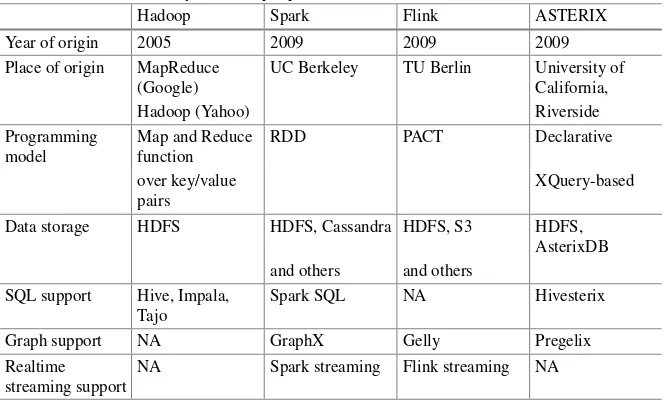
2.2 Spark . . . 28
2.3 Flink. . . 33
2.4 Hyracks/ASTERIX. . . 36
3 Large-Scale Processing Systems of Structured Data. . . 41
3.1 Why SQL-On-Hadoop? . . . 41
3.2 Hive. . . 42
3.3 Impala . . . 44
3.4 IBM Big SQL. . . 45
3.5 SPARK SQL . . . 46
3.6 HadoopDB. . . 47
3.7 Presto. . . 48
3.8 Tajo . . . 50
3.9 Google Big Query . . . 50
3.10 Phoenix . . . 51
3.11 Polybase. . . 51
4 Large-Scale Graph Processing Systems. . . 53
4.1 The Challenges of Big Graphs. . . 53
4.2 Does Hadoop Work Well for Big Graphs?. . . 54
4.3 Pregel Family of Systems. . . 58
4.3.1 The Original Architecture . . . 58
4.3.2 Giraph: BSP + Hadoop for Graph Processing. . . 61
4.3.3 Pregel Extensions . . . 63
4.4 GraphLab Family of Systems. . . 66
4.4.1 GraphLab . . . 66
4.4.2 PowerGraph. . . 66
4.4.3 GraphChi. . . 68
4.5 Other Systems . . . 68
4.6 Large-Scale RDF Processing Systems. . . 71
5 Large-Scale Stream Processing Systems . . . 75
5.1 The Big Data Streaming Problem. . . 75
5.2 Hadoop for Big Streams?! . . . 76
5.3 Storm. . . 79
5.4 Infosphere Streams. . . 81
5.5 Other Big Stream Processing Systems . . . 82
5.6 Big Data Pipelining Frameworks . . . 84
5.6.1 Pig Latin. . . 84
5.6.2 Tez . . . 86
5.6.3 Other Pipelining Systems . . . 88
6 Conclusions and Outlook . . . 91
References. . . 97
About the Author
Sherif Sakr is a professor of computer and information science in the Health Informatics department at King Saud bin Abdulaziz University for Health Sciences. He is also affiliated with the University of New South Wales and DATA61/CSIRO (formerly NICTA). He received his Ph.D. degree in Computer and Information Science from Konstanz University, Germany in 2007. He received his BSc and M. Sc. degrees in Computer Science from the Information Systems department at the Faculty of Computers and Information in Cairo University, Egypt, in 2000 and 2003, respectively. In 2008 and 2009, Sherif held an Adjunct Lecturer position at the Department of Computing of Macquarie University. In 2011, he held a Visiting Researcher position at the eXtreme Computing Group, Microsoft Research Laboratories, Redmond, WA, USA. In 2012, he held a Research MTS position in Alcatel-Lucent Bell Labs. In 2013, Sherif was awarded the Stanford Innovation and Entrepreneurship Certificate. Sherif has published more than 90 refereed research publications in international journals and conferences, (co-) authored three books and co-edited three other books. He is an IEEE Senior Member.
Chapter 1
Introduction
1.1
The Big Data Phenomenon
There is no doubt that we are living in the era of Big Data where we are witnessing the radical expansion and integration of digital devices, networking, data storage, and computation systems. In practice, data generation and consumption are becoming a main part of people’s daily life especially with the pervasive availability and usage of Internet technology and applications [1]. The number of Internet users reached 2.27 billion in 2012. As result, we are witnessing an explosion in the volume of creation of digital data from various sources and at ever-increasing rates. Social networks, mobile applications, cloud computing, sensor networks, video surveillance, global position-ing systems (GPS), radio frequency identification (RFID), Internet-of-Thposition-ings (IoT), imaging technologies, and gene sequencing are just some examples of technologies that facilitate and accelerate the continuous creation of massive datasets that must be stored and processed. For example, in one minute on the Internet, Facebook records more than 3.2 million likes, stores more than 3.4 million posts, and generates around 4 GB of data. In one minute, Google answers about 300,000 searches, 126 h uploaded in YouTube of which it will also serve more than 140,000 video views, about 700 users created in Twitter and more than 350,000 generated tweets, and more than 11,000 searches performed on LinkedIn. Walmart handles more than 1 million cus-tomer transactions per hour and produces 2.5 petabytes of data on a daily basis. eBay stores a single table of Web clicks recording more than 1 trillion rows. In March 2014, Alibaba announced that the company stored more than 100 petabytes of processed data. These numbers, which are continuously increasing, provide a perception of the massive data generation, consumption, and traffic happening in the Internet world. In another context, powerful telescopes in astronomy, particle accelerators in physics, and genome sequencers in biology are producing vast volumes of data for scientists. The cost of sequencing one human genome has fallen from $100 million in 2001 to $10,000 in 2011. Every day, Survey Telescope [2] generates on the order of 30 terabytes of data on a daily basis, the New York Stock Exchange captures around
© The Author(s) 2016
S. Sakr,Big Data 2.0 Processing Systems, SpringerBriefs in Computer Science, DOI 10.1007/978-3-319-38776-5_1
2 1 Introduction
1 TB of trade information, and about 30 billion RFID tags are created. Add to this mix the data generated by the hundreds of millions of GPS devices sold every year, and the more than 30 million networked sensors currently in use (and growing at a rate faster than 30 % per year). These data volumes are expected to double every two years over the next decade. IBM reported that we are currently producing 2.5 quintillion bytes of data every day.1IDC predicts that the worldwide volume of data will reach 40 zettabytes by 20202where 85 % of all these data will be of new data types and formats including server logs and other machine-generated data, data from sensors, social media data, and many other data sources. All of these data will enable us to do things we were not able to before and thereby create value for the world economy. However, clearly, many application domains are facing major challenges on processing such massive amounts of generated data from different sources and in various formats. Therefore, almost all scientific funding and government agencies introduced major strategies and plans to support Big Data research and applications. In the enterprise world, many companies continuously gather massive datasets that store customer interactions, product sales, and results from advertising campaigns on the Web in addition to various types of other information [3]. In practice, a company can generate up to petabytes of information over the course of a year: Web pages, clickstreams, blogs, social media forums, search indices, email, documents, instant messages, text messages, consumer demographics, sensor data from active and passive systems, and more. By many estimates, as much as 80 % of these data are semi-structured or unstructured. In practice, it is typical that companies are always seeking to become more nimble in their operations and more innovative with their data analysis and decision-making processes. They are realizing that time lost in these processes can lead to missed business opportunities. The core of the data management challenge is for companies to gain the ability to analyze and understand Internet-scale information just as easily as they can now analyze and understand smaller volumes of structured information.
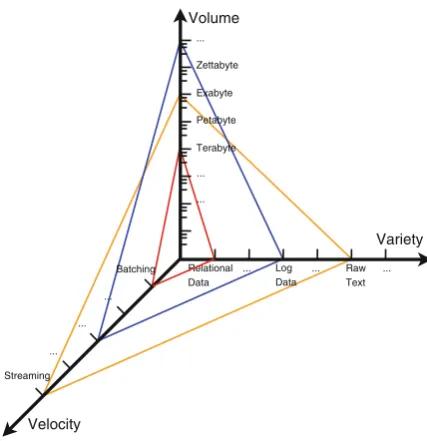
TheBig Dataterm has been coined under the tremendous and explosive growth of the world’s digital data which are generated from various sources and in differ-ent formats. In principle, the Big Data term is commonly described by 3 V main attributes (Fig.1.1): theVolumeattribute describes the massive amount of data that
can be billions of rows and millions of columns, theVarietyattribute represents the
variety of formats, data sources, and structures, and theVelocityattribute reflects
the very high speed of data generation, ingestion, and near realtime analysis. In Jan-uary 2007, Jim Gray, a database scholar, described the Big Data phenomenon as the Fourth Paradigm[4] and called for aparadigm shiftin the computing architecture and large-scale data processing mechanisms. The first three paradigms were experi-mental,theoretical, and, more recently,computational science. Gray argued that the only way to cope with this paradigm is to develop a new generation of computing tools to manage, visualize, and analyze the data flood. According to Gray, computer architectures have become increasingly imbalanced where the latency gap between
1.1 The Big Data Phenomenon 3
multicore CPUs and mechanical hard disks is growing every year which makes the challenges of data-intensive computing much harder to overcome [5]. Hence, there is a crucial need for a systematic and generic approach to tackle these problems with an architecture that can also scale into the foreseeable future. In response, Gray argued that the new trend should instead focus on supporting cheaper clusters of computers to manage and process all these data instead of focusing on having the biggest and fastest single computer. In addition, the 2011 McKinsey global report described Big Data as the next frontier for innovation and competition [6]. The report defined Big Data as “Data whose scale, distribution, diversity, and/or timeliness require the use of new technical architectures and analytics to enable insights that unlock the new sources of business value.” This definition highlighted the crucial need for a new data architecture solution that can manage the increasing challenges of Big Data prob-lems. In response, the new scale ofBig Datahas been attracting a lot of interest from both the research and industrial worlds aiming to create the best means to process and analyze these data and make the best use of them [7].
1.2
Big Data and Cloud Computing
4 1 Introduction
with the management of hardware and software resources. In fact, the discussion in industry and academia has taken a while for them to be able to define the roadmap for defining what cloud computing actually means [9, 10, 11]. The US National Insti-tute of Standards and Technology (NIST) has published a definition that reflects the most commonly agreed features of cloud computing. This definition describes the cloud computing technology as: “A model for enabling convenient, on-demand net-work access to a shared pool of configurable computing resources (e.g., netnet-works, servers, storage, applications, and services) that can be rapidly provisioned and released with minimal management effort or service provider interaction.” In prin-ciple, one of the important features provided by cloud computing technology is that computing hardware and software capabilities are made accessible via the network and accessed through standard mechanisms that can be supported by heterogeneous thin or fat client platforms (e.g., laptops, mobile phones, and PDAs). In particular, cloud computing provides a number of advantages for hosting the deployments of data-intensive applications such as:
• Reduced time-to-market by removing or simplifying the time-consuming hardware
provisioning, purchasing, and deployment processes
• Reduced monetary cost by following apay-as-you-gobusiness model
• Unlimited (virtually) computing resources and scalability by adding resources as
the workload increases
Therefore, cloud computing has been considered as a significant step towards achieving the long-held dream of envisioning computing as a utility [12] where the economies of scale principles effectively help to drive the cost of computing infrastructure down. In practice, big players of the technology companies (e.g., Amazon, Microsoft, Google, IBM) have been quite active in establishing their own data centers across the world to ensure reliability by providing redundancy for their provided infrastructure, platforms, and applications to the end users. In principle, cloud-based services offer several advantages such as: flexibility and scalability of storage, computing and application resources, optimal utilization of infrastructure, and reduced costs. Hence, cloud computing provides a great chance to supply stor-age, processing, and analytics resources for Big Data applications. A recent analysis3 reported that 53 % of enterprises have deployed (28 %) or plan to deploy (25 %) their Big Data Analytics (BDA) applications in the cloud.
In cloud computing, the provider’s computing resources are pooled to serve multi-ple consumers using a multitenant model with various virtual and physical resources dynamically assigned and reassigned based on the demand of the application work-load. Therefore, it achieves the sense of location independence. Examples of such
3
1.2 Big Data and Cloud Computing 5
shared computing resources include storage, memory, network bandwidth, process-ing, virtual networks, and virtual machines. In practice, one of the main principles for the data center technology is to exploit the virtualization technology to increase the utilization of computing resources. Hence, it supplies the main ingredients of computing resources such as CPUs, storage, and network bandwidth as a commod-ity at low unit cost. Therefore, users of cloud services do not need to be concerned about the problem of resource scalability because the provided resources can be vir-tually considered as being infinite. In particular, the business model of public cloud providers relies on the mass acquisition of IT resources that are made available to cloud consumers via various attractive pricing models and leasing packages. This provides applications or enterprises with the opportunity to gain access to powerful infrastructure without the need to purchase it.
1.3
Big Data Storage Systems
In general, relational database management systems (e.g., MySQL, PostgreSQL, SQL Server, Oracle) have been considered as theone-size-fits-allsolution for data persistence and retrieval for decades. They have matured after extensive research and development efforts and very successfully created a large market and many solutions in different business domains. However, the ever-increasing need for scal-ability and new application requirements have created new challenges for traditional RDBMS [13]. In particular, we are currently witnessing a continuous increase of user-driven and user-generated data that results in a tremendous growth in the type and volume of data that is produced, stored, and analyzed. For example, various newer sets of source data generation technologies such as sensor technologies, automated trackers, global positioning systems, and monitoring devices are producing massive datasets. In addition to the speedy data growth, data have also become increasingly sparse and semi-structured in nature. In particular, data structures can be classified into four main types as follows:
• Structured data: Data with a defined format and structure such as CSV files,
spreadsheets, traditional relational databases, and OLAP data cubes.
• Semi-structured data: Textual data files with a flexible structure that can be
parsed. The popular example of such type of data is the Extensible Markup Lan-guage (XML) data files with its self-describing information.
• Quasi-structured data: Textual data with erratic data formats such as Web
click-stream data that may contain inconsistencies in data values and formats.
• Unstructured data: Data that have no inherent structure such as text documents,
6 1 Introduction
Fig. 1.2 Types of NoSQL data stores
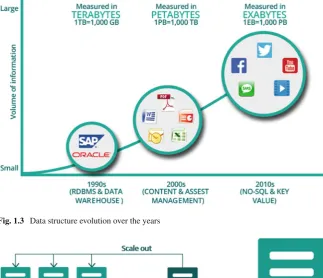
Figure1.3illustrates the data structure evolution over the years. In practice, the continuous growth in the sizes of such types of data led to the challenge that tradi-tional data management techniques which required upfront schema definition and relational-based data organization are inadequate in many scenarios. Therefore, in order to tackle this challenge, we have witnessed the emergence of a new generation of scalable data storage systems calledNoSQL(NotOnlySQL) database systems. This new class of database system can be classified into four main types (Fig.1.2):
• Key-value stores: These systems use the simplest data model which is a collection
of objects where each object has a unique key and a set of attribute/value pairs.
• Extensible record stores: They provide variable-width tables (Column Families)
that can be partitioned vertically and horizontally across multiple servers.
• Document stores: The data model of these systems consists of objects with a
variable number of attributes with a possibility of having nested objects.
• Graph stores: The data model of these systems uses graph structures with edges,
nodes, and properties to model and store data.
1.3 Big Data Storage Systems 7
Fig. 1.3 Data structure evolution over the years
Fig. 1.4 Horizontal scalability versus vertical scalability
8 1 Introduction
In practice, many systems4that are identified to fall under the umbrella of NoSQL systems are quite varied, and each of these systems comes with its unique set of features and value propositions [15]. For example, the key-value (KV) data stores represent the simplest model of NoSQL systems which pairs keys to values in a very similar fashion to how a map (or hashtable) works in any standard program-ming language. Various open-source projects have been implemented to provide key-value NoSQL database systems such asMemcached,5 Voldemort,6 Redis,7and Riak.8 Columnar, or column-oriented, is another type of NoSQL database. In such systems, data from a given column are stored together in contrast to a row-oriented database (e.g., relational database systems) which keeps information about each row together. In column-oriented databases, adding new columns is quite flexible and is performed on the fly on a row-by-row basis. In particular, every row may have a different set of columns that allow tables to be sparse without introducing any additional storage cost for null values. In principle, columnar NoSQL systems repre-sent a midway between relational and key-value stores.Apache HBase9is currently the most popular open-source system of this category. Another category of NoSQL systems is document-oriented database stores. In this category, a document is like a hash, with a unique ID field and values that may be any of a variety of types, includ-ing more hashes. In particular, documents can contain nested structures, and so they provide a high degree of flexibility, allowing for variable domains.MongoDB10and CouchDB11 are currently the two most popular systems in this category. Finally, NoSQL Graph databases are another category that excels in handling highly inter-connected data. In principle, a graph database consists of nodes and relationships between nodes where both relationships and nodes can be described using descrip-tive information and properties (key-value pairs). In principle, the main advantage of graph databases is that they provide easy functionalities for traversing the nodes of the graph structure by following relationships. TheNeo4J12 database system is currently the most popular in this category.
1.4
Big Data Processing and Analytics Systems
There is no doubt that our societies have become increasingly more instrumented in how we are producing and storing vast amounts of data. As a result, in our modern
1.4 Big Data Processing and Analytics Systems 9
world, data are the key resource. However, in practice, data are not useful in and of themselves. They only have utility if meaning and value can be extracted from them. Therefore, given their utility and value, there are always continuous increasing efforts devoted to producing and analyzing them. In principle, Big Data discovery enables data scientists and other analysts to uncover patterns and correlations through analysis of large volumes of data of diverse types. In particular, the power of Big Data is revolutionizing the way we live. From the modern business enterprise to the lifestyle choices of today’s digital citizen, the insights of Big Data analytics are driving changes and improvements in every arena [16]. For instance, insights gleaned from Big Data discovery can provide businesses with significant competi-tive advantages, such as more successful marketing campaigns, decreased customer churn, and reduced loss from fraud. In particular, they can provide the opportunity to make businesses more agile and to answer queries that were previously considered beyond their reach. Therefore, it is crucial that all the emerging varieties of data types with huge sizes need to be harnessed to provide a more complete picture of what is happening in various application domains. In particular, in the current era, data represent the new gold whereas analytics systems represent the machinery that analyses, mines, models, and mints them.
In practice, the increasing demand for large-scale data analysis and data mining applications has stimulated designing and building novel solutions from both indus-try (e.g., clickstream analysis, Web data analysis, network-monitoring log analysis) and the sciences (e.g., analysis of data produced by massive-scale simulations, sen-sor deployments, high-throughput lab equipment) [17]. Although parallel database systems [18] serve some of these data analysis applications (e.g., Teradata,13 SQL Server PDW,14Vertica,15Greenplum,16ParAccel,17Netezza18), they are expensive, difficult to administer, and lack fault tolerance for long-running queries [19].
In 2004, Google introduced the MapReduce framework as a simple and powerful programming model that enables the easy development of scalable parallel appli-cations to process vast amounts of data on large clusters of commodity machines by scanning and processing large files in parallel across multiple machines [20]. In particular, the framework is mainly designed to achieve high performance on large clusters of commodity PCs. The fundamental principle of the MapReduce frame-work is to move analysis to the data, rather than moving the data to a system that can analyze them. One of the main advantages of this approach is that it isolates the application from the details of running a distributed program, such as issues on data distribution, scheduling, and fault tolerance. Thus, it allows programmers to think in adata-centricfashion where they can focus on applying transformations to
10 1 Introduction
sets of data records and the details of distributed execution and fault tolerance are transparently managed by the MapReduce framework.
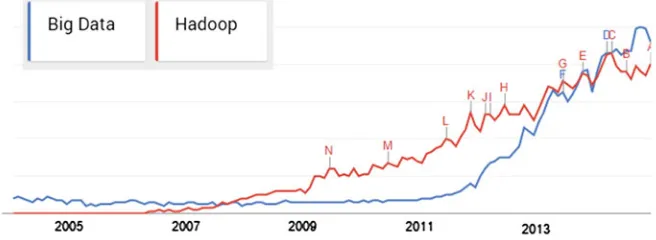
In practice, the Hadoop project,19the open-source realization of the MapReduce framework, has been a big success and created increasing momentum in the research and business domains. In addition, cost-effective processing of large datasets is a nontrivial undertaking. Fortunately, MapReduce frameworks and cloud computing have made it easier than ever for everyone to step into the world of Big Data. This technology combination has enabled even small companies to collect and analyze terabytes of data in order to gain a competitive edge [21]. For example, the Amazon Elastic Compute Cloud (EC2)20is offered as a commodity that can be purchased and utilized. In addition, Amazon has also provided the Amazon Elastic MapReduce21as an online service to process vast amounts of data easily and cost-effectively without the need to worry about time-consuming setup, management, or tuning of computing clusters or the compute capacity upon which they sit. Hence, such services enable third parties to perform their analytical queries on massive datasets with minimum effort and cost by abstracting the complexity entailed in building and maintaining computer clusters. Therefore, due to its success, it has been supported by many big players in their Big Data commercial platforms such as Microsoft,22 IBM,23 andOracle.24 In addition, several successful startups such asMapR,25 Cloudera,26 Altiscale,27Splice Machine,28DataStax,29Platfora,30andTrifacta31have built their solutions and services based on the Hadoop project. Figure1.5illustrates Google’s Web search trends for the two search items: Big DataandHadoop, according to the Google trend analysis tool.32 In principle, Fig.1.5shows that the search item Hadoophas overtaken the search itemBig Dataand has since dominated Web users’ search requests during the period between 2008 and 2012 whereas since 2013, the two search items have started to go side by side.
Recently, both the research and industrial domains have identified various limita-tions in the Hadoop framework [22] and thus there is now common consensus that the Hadoop framework cannot be theone-size-fits-allsolution for the various Big Data analytics challenges. Therefore, in this book, we argue that the Hadoop framework
1.4 Big Data Processing and Analytics Systems 11
Fig. 1.5 Google’s Web search trends for the two search items: Big Data and Hadoop (created by Google trends)
Fig. 1.6 Timeline representation of Big Data 2.0 processing platforms. Flags denote the general-purpose Big Data processing systems; rectangles denote the big SQL processing platforms; stars denote large-scale graph processing platforms; and diamonds denote large-scale stream processing platforms
with its extensions [22] represented the Big Data 1.0 processing platforms. We coin the term of Big Data 2.0 processing platforms which represent a new generation of engines that are domain-specific, dedicated to specific verticals, and slowly replacing the Hadoop framework in various usage scenarios. Figure1.6illustrates a timeline view for the development of the Big Data 2.0 processing platforms. Notably, there has been growing activity around the Big Data hotspot in the academic and indus-trial worlds, mainly from 2009 and onwards, focused on building a new generation of optimized and domain-specific Big Data analytics platforms. The main focus of this book is to highlight and provide an overview of this new generation of systems.
1.5
Book Roadmap
12 1 Introduction
Fig. 1.7 Classification of Big Data 2.0 processing systems
data from conventional transactional sources, in conjunction with the analysis of multistructured data from other sources such as clickstreams, call detail records, application logs, or text from call center records. Chapter2provides an overview of various general-purpose Big Data processing systems that empower the user to develop various Big Data processing jobs for different application domains.
Several studies reported that Hadoop is not an adequate choice for supporting interactive queries that aim to achieve a response time of milliseconds or a few seconds [19]. In addition, many programmers may be unfamiliar with the Hadoop framework and they would prefer to use SQL as a high-level declarative language to implement their jobs while delegating all of the optimization details in the execution process to the underlying engine [22]. Chapter3provides an overview of various systems that have been introduced to support the SQL flavor on top of the Hadoop infrastructure and provide competing and scalable performance on processing large-scale structured data.
Nowadays, graphs with millions and billions of nodes and edges have become very common. The enormous growth in graph sizes requires huge amounts of com-putational power to analyze. In general, graph processing algorithms are iterative and need to traverse the graph in a certain way. Chapter 4focuses on discussing several systems that have been designed to tackle the problem of large-scale graph processing.
1.5 Book Roadmap 13
Chapter 2
General-Purpose Big Data Processing
Systems
2.1
The Big Data Star: The Hadoop Framework
2.1.1
The Original Architecture
In 2004, Google introduced the MapReduce framework as a simple and powerful programming model that enables the easy development of scalable parallel applica-tions to process vast amounts of data on large clusters of commodity machines [20]. In particular, the implementation described in the original paper is mainly designed to achieve high performance on large clusters of commodity PCs. One of the main advantages of this approach is that it isolates the application from the details of run-ning a distributed program, such as issues of data distribution, scheduling, and fault tolerance. In this model, the computation takes a set of key-value pairs as input and produces a set of key-value pairs as output. The user of the MapReduce framework expresses the computation using two functions:MapandReduce. The Map function takes an input pair and produces a set of intermediate key-value pairs. The MapRe-duce framework groups together all intermediate values associated with the same intermediate key I and passes them to the Reduce function. The Reduce function receives an intermediate keyIwith its set of values and merges them together. Typ-ically just zero or one output value is produced per Reduce invocation. The main advantage of this model is that it allows large computations to be easily parallelized and re-executed to be used as the primary mechanism for fault tolerance.
Figure2.1illustrates an example MapReduce program expressed in pseudo-code for counting the number of occurrences of each word in a collection of documents. In this example, the Map function emits each word plus an associated count of occurrences and the Reduce function sums together all counts emitted for a particular word. In principle, the design of the MapReduce framework is based on the following main principles [23]:
• Low-Cost Unreliable Commodity Hardware: Instead of using expensive, high-performance, reliable symmetric multiprocessing (SMP) or massively parallel
© The Author(s) 2016
S. Sakr,Big Data 2.0 Processing Systems, SpringerBriefs in Computer Science, DOI 10.1007/978-3-319-38776-5_2
16 2 General-Purpose Big Data Processing Systems
Fig. 2.1 An example MapReduce program
processing (MPP) machines equipped with high-end network and storage subsys-tems, the MapReduce framework is designed to run on large clusters of commodity hardware. This hardware is managed and powered by open-source operating sys-tems and utilities so that the cost is low.
• Extremely Scalable RAIN Cluster: Instead of using centralized RAID-based SAN or NAS storage systems, every MapReduce node has its own local off-the-shelf hard drives. These nodes are loosely coupled where they are placed in racks that can be connected with standard networking hardware connections. These nodes can be taken out of service with almost no impact to still-running MapReduce jobs. These clusters are called Redundant Array of Independent (and Inexpensive) Nodes (RAIN).
• Fault-Tolerant yet Easy to Administer: MapReduce jobs can run on clusters with thousands of nodes or even more. These nodes are not very reliable as at any point in time, a certain percentage of these commodity nodes or hard drives will be out of order. Hence, the MapReduce framework applies straightforward mechanisms to replicate data and launch backup tasks so as to keep still-running processes going. To handle crashed nodes, system administrators simply take crashed hardware offline. New nodes can be plugged in at any time without much administrative hassle. There are no complicated backup, restore, and recovery configurations like the ones that can be seen in many DBMSs.
2.1 The Big Data Star: The Hadoop Framework 17
Fig. 2.2 Overview of the flow of execution of a MapReduce operation
Hadoop1is an open-source Java library [25] that supports data-intensive
distrib-uted applications by realizing the implementation of the MapReduce framework.2It
has been widely used by a large number of business companies for production pur-poses.3On the implementation level, the Map invocations of a MapReduce job are distributed across multiple machines by automatically partitioning the input data into a set ofMsplits. The input splits can be processed in parallel by different machines. Reduce invocations are distributed by partitioning the intermediate key space intoR
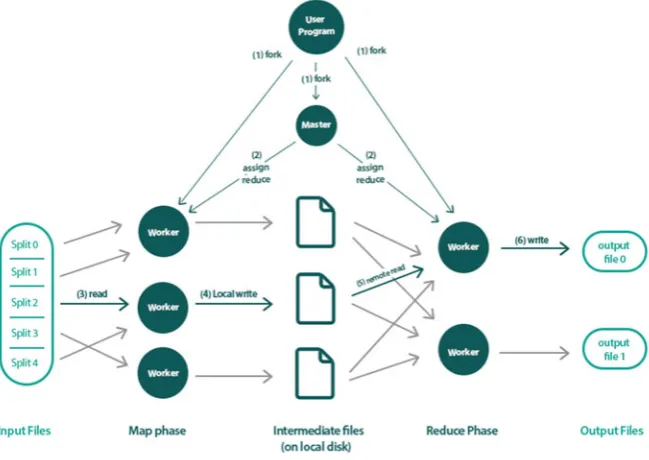
pieces using a partitioning function (e.g., hash(key) mod R). The number of parti-tions (R) and the partitioning function are specified by the user. Figure2.2illustrates an example of the overall flow of a MapReduce operation that goes through the following sequence of actions:
1. The input data of the MapReduce program is split into M pieces and starts up many instances of the program on a cluster of machines.
2. One of the instances of the program is elected to be themastercopy and the rest are considered asworkersthat are assigned their work by the master copy. In particular, there areMMap tasks andRReduce tasks to assign. The master picks idle workers and assigns each one or more Map tasks and/or Reduce tasks.
1http://hadoop.apache.org/.
18 2 General-Purpose Big Data Processing Systems
3. A worker who is assigned a Map task processes the contents of the corresponding input split and generates key-value pairs from the input data and passes each pair to the user-defined Map function. The intermediate key-value pairs produced by the Map function are buffered in memory.
4. Periodically, the buffered pairs are written to local disk and partitioned into R
regions by the partitioning function. The locations of these buffered pairs on the local disk are passed back to the master, who is responsible for forwarding these locations to the Reduce workers.
5. When a Reduce worker is notified by the master about these locations, it reads the buffered data from the local disks of the Map workers which are then sorted by the intermediate keys so that all occurrences of the same key are grouped together. The sorting operation is needed because typically many different keys Map to the same Reduce task.
6. The Reduce worker passes the key and the corresponding set of intermediate val-ues to the user’s Reduce function. The output of the Reduce function is appended to a final output file for this Reduce partition.
7. When all Map tasks and Reduce tasks have been completed, the master program wakes up the user program. At this point, the MapReduce invocation in the user program returns the program control back to the user code.
Figure2.3illustrates a sample execution for the example program (WordCount) depicted in Fig.2.1using the steps of the MapReduce framework that are illustrated in Fig.2.2. During the execution process, the master pings every worker periodically. If no response is received from a worker within a certain amount of time, the master marks the worker asfailed. Any Map tasks marked completed or in progress by the worker are reset back to their initial idle state and therefore become eligible for scheduling by other workers. Completed Map tasks are re-executed on a task
2.1 The Big Data Star: The Hadoop Framework 19
failure because their output is stored on the local disk(s) of the failed machine and is therefore inaccessible. Completed Reduce tasks do not need to be re-executed because their output is stored in a global file system.
The Hadoop project has been introduced as an open-source Java library that supports data-intensive distributed applications and clones the implementation of Google’s MapReduce framework [20]. In principle, the Hadoop framework con-sists of two main components: the Hadoop Distributed File System (HDFS) and the MapReduce programming model. In particular, HDFS provides the basis for dis-tributed Big Data storage which distributes the data files into data blocks and stores such data in different nodes of the underlying computing cluster in order to enable effective parallel data processing.
2.1.2
Enhancements of the MapReduce Framework
In practice, the basic implementation of MapReduce is very useful for handling data processing and data loading in a heterogeneous system with many different storage systems. Moreover, it provides a flexible framework for the execution of more complicated functions than can be directly supported in SQL. However, this basic architecture suffers from some limitations. In the following subsections we discuss some research efforts that have been conducted in order to deal with these limitations by providing various enhancements on the basic implementation of the MapReduce framework.
2.1.2.1 Processing Join Operations
One main limitation of the MapReduce framework is that it does not support the joining of multiple datasets in one task. However, this can still be achieved with additional MapReduce steps. For example, users can Map and Reduce one dataset and read data from other datasets on the fly.
To tackle the limitation of the extra processing requirements for performing join operations in the MapReduce framework, theMap-Reduce-Mergemodel [23] has been introduced to enable the processing of multiple datasets. Figure2.4illustrates the framework of this model where the Map phase transforms an input key-value pair
(k1, v1)into a list of intermediate key-value pairs[(k2, v2)]. The Reduce function aggregates the list of values[v2]associated withk2 and produces a list of values
[v3]that is also associated withk2. Note that inputs and outputs of both functions belong to the same lineage (α). Another pair of Map and Reduce functions produce the intermediate output(k3,[v4])from another lineage (β). Based on keysk2 and
20 2 General-Purpose Big Data Processing Systems
Fig. 2.4 Overview of the Map-Reduce-Merge framework [23]
framework and the original MapReduce is the production of a key-value list from the Reduce function instead of just that of values. This change is introduced because the Merge function requires input datasets to be organized (partitioned, then either sorted or hashed) by keys and these keys have to be passed into the function to be merged. In the original framework, the reduced output is final. Hence, users pack whatever is needed in[v3]and passingk2 for the next stage is not required.
TheMap-Join-Reduce[26] represents another approach that has been introduced with a filtering-join-aggregation programming model as an extension of the standard MapReduce’s filtering-aggregation programming model. In particular, in addition to the standard mapper and reducer operation of the standard MapReduce framework, they introduce a third operation, Join (called joiner), to the framework. Hence, to join multiple datasets for aggregation, users specify a set ofJoin() functions and the Join order between them. Then, the runtime system automatically joins the multiple input datasets according to the Join order and invokesJoin() functions to process the joined records. They have also introduced a one-to-many shuffling strategy that shuffles each intermediate key-value pair to many joiners at one time. Using a tailored partition strategy, they can utilize the one-to-many shuffling scheme to join multiple datasets in one phase instead of a sequence of MapReduce jobs. The runtime system for executing a Map-Join-Reduce job launches two kinds of processes:MapTaskand
2.1 The Big Data Star: The Hadoop Framework 21
2.1.2.2 Supporting Iterative Processing
The basic MapReduce framework does not directly support these iterative data analy-sis applications. Instead, programmers must implement iterative programs by man-ually issuing multiple MapReduce jobs and orchestrating their execution using a driver program. In practice, there are two key problems with manually orchestrating an iterative program in MapReduce:
• Even though many of the data may be unchanged from iteration to iteration, the data must be reloaded and reprocessed at each iteration, wasting I/O, network bandwidth, and CPU resources.
• The termination condition may involve the detection of when a fixpoint has been reached. This condition may itself require an extra MapReduce job on each iter-ation, again incurring overhead in terms of scheduling extra tasks, reading extra data from disk, and moving data across the network.
TheHaLoopsystem [27] is designed to support iterative processing on the MapRe-duce framework by extending the basic MapReMapRe-duce framework with two main func-tionalities:
1. Caching the invariant data in the first iteration and then reusing them in later iterations
2. Caching the reducer outputs, which makes checking for a fixpoint more efficient, without an extra MapReduce job
Figure2.5 illustrates the architecture of HaLoop as a modified version of the basic MapReduce framework. In principle, HaLoop relies on the same file system and has the same task queue structure as Hadoop but the task scheduler and task tracker modules are modified, and the loop control, caching, and indexing modules are newly introduced to the architecture. The task tracker not only manages task execution but also manages caches and indexes on the slave node, and redirects each task’s cache and index accesses to the local file system.
In the MapReduce framework, each Map or Reduce task contains its portion of the input data and the task runs by performing the Map/Reduce function on its input data records where the lifecycle of the task ends when finishing the processing of all the input data records has been completed. The iMapReduce framework [28] supports the feature of iterative processing by keeping alive each Map and Reduce task during the whole iterative process. In particular, when all of the input data of a persistent task are parsed and processed, the task becomes dormant, waiting for the new updated input data. For a Map task, it waits for the results from the Reduce tasks and is activated to work on the new input records when the required data from the Reduce tasks arrive. For the Reduce tasks, they wait for the Map tasks’ output and are activated synchronously as in MapReduce. Jobs can terminate their iterative process in one of two ways:
1. Defining fixed number of iterations: Iterative algorithm stops after it iteratesn
22 2 General-Purpose Big Data Processing Systems
Fig. 2.5 Overview of HaLoop architecture [27]
2. Bounding the distance between two consecutive iterations: Iterative algorithm stops when the distance is less than a threshold.
The iMapReduce runtime system does the termination check after each iteration. To terminate the iterations by a fixed number of iterations, the persistent Map/Reduce task records its iteration number and terminates itself when the number exceeds a threshold. To bound the distance between the output from two consecutive iterations, the Reduce tasks can save the output from two consecutive iterations and compute the distance. If the termination condition is satisfied, the master will notify all the Map and Reduce tasks to terminate their execution.
Other projects have been implemented for supporting iterative processing on the MapReduce framework. For example, Twister4 is a MapReduce runtime with an
extended programming model that supports iterative MapReduce computations effi-ciently [29]. It uses a publish/subscribe messaging infrastructure for communication and data transfers, and supports long-running Map/Reduce tasks. In particular, it pro-vides programming extensions to MapReduce with broadcast and scatter type data transfers. Microsoft has also developed a project that provides an iterative MapRe-duce runtime for Windows Azure calledDaytona.5
4http://www.iterativemapreduce.org/.
2.1 The Big Data Star: The Hadoop Framework 23
2.1.2.3 Data and Process Sharing
With the emergence of cloud computing, the use of an analytical query processing infrastructure (e.g., Amazon EC2) can be directly mapped tomonetaryvalue. Taking into account that different MapReduce jobs can perform similar work, there could be many opportunities for sharing the execution of their work. Thus, this sharing can reduce the overall amount of work that consequently leads to the reduction of the monetary charges incurred while utilizing the resources of the processing infrastructure. TheMRSharesystem [30] has been presented as a sharing framework tailored to transform a batch of queries into a new batch that will be executed more efficiently by merging jobs into groups and evaluating each group as a single query. Based on a defined cost model, they describe an optimization problem that aims to derive the optimal grouping of queries in order to avoid performing redundant work and thus resulting in significant savings in both processing time and money. Whereas theMRSharesystem focuses on sharing the processing between queries that are executed concurrently, the ReStore system [31, 32] has been introduced so that it can enable the queries that are submitted at different times to share the intermediate results of previously executed jobs and reuse them for future submitted jobs to the system. In particular, each MapReduce job produces output that is stored in the distributed file system used by the MapReduce system (e.g., HDFS). These intermediate results are kept (for a defined period) and managed so that they can be used as input by subsequent jobs. ReStore can make use of whole jobs’ or subjobs’ reuse opportunities.
2.1.2.4 Support of Data Indexes and Column Storage
One of the main limitations of the original implementation of the MapReduce frame-work is that it is designed in a way that the jobs can only scan the input data in a sequential-oriented fashion. Hence, the query processing performance of the MapRe-duce framework is unable to match the performance of a well-configured parallel DBMS [19]. In order to tackle this challenge, theHadoop++system [33] introduced the following main changes.
• Trojan Index: The original Hadoop implementation does not provide index access due to the lack of a priori knowledge of the schema and the MapReduce jobs being executed. Hence, the Hadoop++ system is based on the assumption that if we know the schema and the anticipated MapReduce jobs, then we can create appropriate indexes for the Hadoop tasks. In particular, the Trojan index is an approach to integrate indexing capability into Hadoop in a noninvasive way. These indexes are created during the data loading time and thus have no penalty at query time. Each Trojan index provides an optional index access path that can be used for selective MapReduce jobs.
24 2 General-Purpose Big Data Processing Systems
the input data during the loading time. In particular, given any two input relations, they apply the same partitioning function on the join attributes of both relations at data loading time and place the co-group pairs, having the same join key from the two relations, on the same split and hence on the same node. As a result, join operations can then be processed locally within each node at query time. Implementing the Trojan joins does not require any changes to be made to the existing implementation of the Hadoop framework. The only changes are made on the internal management of the data splitting process. In addition, Trojan indexes can be freely combined with Trojan joins.
The design and implementation of a column-oriented and binary backend storage format for Hadoop has been presented in [34]. In general, a straightforward way to implement a column-oriented storage format for Hadoop is to store each column of the input dataset in a separate file. However, this raises two main challenges:
• It requires generating roughly equal-sized splits so that a job can be effectively parallelized over the cluster.
• It needs to ensure that the corresponding values from different columns in the dataset are co-located on the same node running the Map task.
The first challenge can be tackled by horizontally partitioning the dataset and storing each partition in a separate subdirectory. The second challenge is harder to tackle because of the default three-way block-level replication strategy of HDFS that provides fault tolerance on commodity servers but does not provide any co-location guarantees. Floratou et al. [34] tackle this challenge by implementing a modified HDFS block placement policy which guarantees that the files corresponding to the different columns of a split are always co-located across replicas. Hence, when reading a dataset, the column input format can actually assign one or more split-directories to a single split and the column files of a split-directory are scanned sequentially where the records are reassembled using values from corresponding positions in the files. A lazy record construction technique is used to mitigate the deserialization overhead in Hadoop, as well as eliminate unnecessary disk I/O. The basic idea behind lazy record construction is to deserialize only those columns of a record that are actually accessed in a Map function. One advantage of this approach is that adding a column to a dataset is not an expensive operation. This can be done by simply placing an additional file for the new column in each of the split-directories. On the other hand, a potential disadvantage of this approach is that the available parallelism may be limited for smaller datasets. Maximum parallelism is achieved for a MapReduce job when the number of splits is at least equal to the number of Map tasks.
TheLlamasystem [35] has introduced another approach to providing column stor-age support for the MapReduce framework. In this approach, each imported table is transformed into column groups where each group contains a set of files representing one or more columns. Llama introduced a columnwise format for Hadoop, called
2.1 The Big Data Star: The Hadoop Framework 25
vary because records can be variable-sized. Each file includes a block index, which is stored after all data blocks, stores the offset of each block, and is used to locate a specific block. In order to achieve storage efficiency, Llama utilizes block-level com-pression by using any of the well-known comcom-pression schemes. In order to improve the query processing and performance of join operations, Llama columns are formed into correlation groups to provide the basis for the vertical partitioning of tables. In particular, Llama creates multiple vertical groups where each group is defined by a collection of columns where one of them is specified as the sorting column. Initially, when a new table is imported into the system, a basic vertical group is created that contains all the columns of the table and is sorted by the table’s primary key by default. In addition, based on statistics of query patterns, some auxiliary groups are dynamically created or discarded to improve the query performance. TheClydesdale
system [36, 37], a system that has been implemented for targeting workloads where the data fit a star schema, usesCFilefor storing its fact tables. It also relies on tailored join plans and a block iteration mechanism [38] for optimizing the execution of its target workloads.
RCFile [39] (Record Columnar File) is another data placement structure that provides columnwise storage for the Hadoop file system. In RCFile, each table is first stored by horizontally partitioning it into multiple row groups where each row group is then vertically partitioned so that each column is stored independently. In particular, each table can have multiple HDFS blocks where each block organizes records with the basic unit of a row group. Depending on the row group size and the HDFS block size, an HDFS block can have only one or multiple row groups. In particular, a row group contains these three sections:
1. Thesync markerwhich is placed in the beginning of the row group and mainly used to separate two continuous row groups in an HDFS block
2. A metadata header which stores the information items on how many records are in this row group, how many bytes are in each column, and how many bytes are in each field in a column
3. The table data section which is actually a column-store where all the fields in the same column are stored continuously together
RCFile utilizes a columnwise data compression within each row group and provides a lazy decompression technique to avoid unnecessary column decompression during query execution. In particular, the metadata header section is compressed using the
RLE (Run Length Encoding) algorithm. The table data section is not compressed as a whole unit. However, each column is independently compressed with theGzip
26 2 General-Purpose Big Data Processing Systems
in memory until RCFile has determined that the data in the column will be really useful for query execution.
The notion ofTrojan Data Layout was coined in [40] and exploits the existing data block replication in HDFS to create different Trojan Layouts on a per-replica basis. This means that rather than keeping all data block replicas in the same layout, it usesdifferentTrojan Layouts for each replica which are optimized for a different subclass of queries. As a result, every incoming query can be scheduled to the most suitable data block replica. In particular, Trojan Layouts change the internal organi-zation of a data block and not among data blocks. They co-locate attributes together according to query workloads by applying a column grouping algorithm that uses an interestingness measure that denotes how well a set of attributes speeds up most or all queries in a workload. The column groups are then packed in order to maximize the total interestingness of data blocks. At query time, an incoming MapReduce job is transparently adapted to query the data block replica that minimizes the data access time. The Map tasks are then routed from the MapReduce job to the data nodes storing such data block replicas.
2.1.2.5 Effective Data Placement
In the basic implementation of the Hadoop project, the objective of the data place-ment policy is to achieve good load balancing by distributing the data evenly across the data servers, independently of the intended use of the data. This simple data placement policy works well with most Hadoop applications that access just a sin-glefile. However, there are some other applications that process data frommultiple
files that can get a significant boost in performance with customized strategies. In these applications, the absence of data co-location increases the data shuffling costs, increases the network overhead, and reduces the effectiveness of data partitioning.
CoHadoop[41] is a lightweight extension to Hadoop designed to enable co-locating related files at the file system level while at the same time retaining the good load balancing and fault tolerance properties. It introduces a new file property to identify related data files and modify the data placement policy of Hadoop to co-locate copies of those related files in the same server. These changes are designed in a way to retain the benefits of Hadoop, including load balancing and fault tolerance. In principle, CoHadoop provides a generic mechanism that allows applications to control data placement at the file-system level. In particular, a new file-level property called a
2.1 The Big Data Star: The Hadoop Framework 27
Fig. 2.6 Hadoop’s ecosystem
2.1.3
Hadoop’s Ecosystem
Over the years, the Hadoop Ecosystem has been extended with various components. For example, the over-simplicity of the MapReduce programming model and its reliance on a rigid one-input and two-stage dataflow lead to situations in which inel-egant workarounds are required when performing tasks that have a different workflow (e.g., joins ornstages). TheHiveproject [42] has been introduced to support SQL-on-Hadoop with familiar relational database concepts such as tables, columns, and partitions. It supports queries that are expressed in an SQL-like declarative language, Hive Query Language (HiveQL6), which represents a subset of SQL92, and there-fore can be easily understood by anyone who is familiar with SQL. These queries automatically compile into Hadoop jobs.Impala7 is another open-source project, built by Cloudera, to provide a massively parallel processing SQL query engine that runs natively in Apache Hadoop. It utilizes the standard components of Hadoop’s infrastructure (e.g., HDFS, HBase, YARN) and is able to read the majority of the widely used file formats (e.g., Parquet, Avro). Therefore, by using Impala, the user can query data stored in the Hadoop Distributed File System. The IBM Big Data processing platform, InfoSphere BigInsights, which is built on the Apache Hadoop framework, has provided the Big SQL engine as its SQL interface. In particular, it provides SQL access to data that are stored in InfoSphere BigInsights and uses the Hadoop framework for complex datasets and direct access for smaller queries.
Apache Tajo8is another distributed data warehouse system for Apache Hadoop that is designed for low-latency and scalable ad hoc queries for ETL processes. Tajo can analyze data that are stored on HDFS, Amazon S3, Openstack Swift,9and local file systems. It provides an extensible query rewrite system that lets users and external programs query data through SQL (Fig.2.6).
Apache Giraph is another component which has been introduced as an open-source project that supports large-scale graph processing and clones the implemen-tation of the GooglePregelsystem [43]. Giraph runs graph processing jobs as
Map-6https://cwiki.apache.org/confluence/display/Hive/LanguageManual. 7http://impala.io/.
8http://tajo.apache.org/.
![Fig. 2.5 Overview of HaLoop architecture [27]](https://thumb-ap.123doks.com/thumbv2/123dok/3939525.1882945/35.439.93.344.57.283/fig-overview-of-haloop-architecture.webp)
![Fig. 2.12 The ASTERIX system architecture [58]](https://thumb-ap.123doks.com/thumbv2/123dok/3939525.1882945/51.439.56.382.57.260/fig-the-asterix-system-architecture.webp)
![Fig. 3.2 Hive’s architecture [42]](https://thumb-ap.123doks.com/thumbv2/123dok/3939525.1882945/55.439.55.385.214.523/fig-hive-s-architecture.webp)

