Big Data, Open Data and Data Development
Smart Innovation
Set
coordinated by
Dimitri Uzunidis
Volume 3
Big Data, Open Data
and Data Development
First published 2016 in Great Britain and the United States by ISTE Ltd and John Wiley & Sons, Inc.
Apart from any fair dealing for the purposes of research or private study, or criticism or review, as permitted under the Copyright, Designs and Patents Act 1988, this publication may only be reproduced, stored or transmitted, in any form or by any means, with the prior permission in writing of the publishers, or in the case of reprographic reproduction in accordance with the terms and licenses issued by the CLA. Enquiries concerning reproduction outside these terms should be sent to the publishers at the undermentioned address:
ISTE Ltd John Wiley & Sons, Inc.
27-37 St George’s Road 111 River Street
London SW19 4EU Hoboken, NJ 07030
UK USA
www.iste.co.uk www.wiley.com
© ISTE Ltd 2016
The rights of Jean-Louis Monino and Soraya Sedkaoui to be identified as the authors of this work have been asserted by them in accordance with the Copyright, Designs and Patents Act 1988.
Library of Congress Control Number: 2016931678
British Library Cataloguing-in-Publication Data
Contents
Acknowledgements . . . vii
Foreword . . . ix
Key Concepts . . . xi
Introduction . . . xix
Chapter 1. The Big Data Revolution . . . 1
1.1. Understanding the Big Data universe . . . 2
1.2. What changes have occurred in data analysis? . . . 8
1.3. From Big Data to Smart Data: making data warehouses intelligent . . . 12
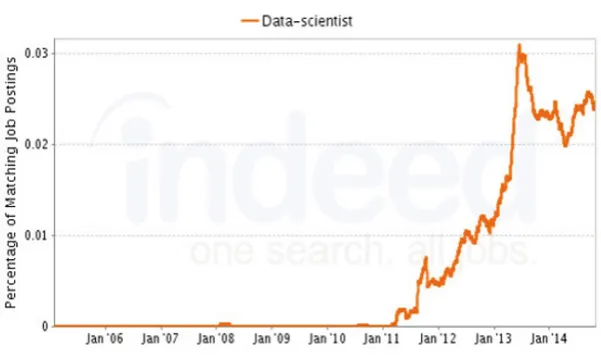
1.4. High-quality information extraction and the emergence of a new profession: data scientists . . . 16
1.5. Conclusion . . . 21
Chapter 2. Open Data: A New Challenge . . . 23
2.1. Why Open Data? . . . 23
2.2. A universe of open and reusable data . . . 28
2.3. Open Data and the Big Data universe . . . 33
2.4. Data development and reuse . . . 38
Chapter 3. Data Development Mechanisms . . . 43
3.1. How do we develop data? . . . 44
3.2. Data governance: a key factor for data valorization . . . 54
3.3. CI: protection and valuation of digital assets . . . 60
3.4. Techniques of data analysis: data mining/text mining . . . 65
3.5. Conclusion . . . 72
Chapter 4. Creating Value from Data Processing . . . 73
4.1. Transforming the mass of data into innovation opportunities . . . 74
4.2. Creation of value and analysis of open databases . . . 82
4.3. Value creation of business assets in web data . . . 87
4.4. Transformation of data into information or “DataViz” . . . 94
4.5. Conclusion . . . 100
Conclusion . . . 101
Bibliography . . . 109
Acknowledgements
This book is the product of several years of research devoted to
data processing, statistics and econometrics in the TRIS (traitement et
recherche de l’information et de la statistique) laboratory. It is the
fruit of several projects carried out within the framework of research and development for several startups within the Languedoc-Roussillon region and large private and public groups.
I would like to thank all of the members of the RRI (réseau de
recherche sur l’innovation), and more particularly, Dimitri Uzunidis,
its president, for his attentive and careful reading of the first version, and who encouraged us to publish this book.
Thanks also to M. Bernard Marques, who had the difficult task of proofreading the manuscript and who had many important notes to help with the understanding of the book.
I would also like to thank my teacher and friend Jean Matouk, who was the cause of this publication, thank you for his encouragement and unfailing support over the years.
Many thanks to all the researchers at the laboratory for their help and support and most especially to Soraya Sedkaoui; without her this book would never have seen the light of day.
collective one, in particular Alain Iozzino, director of the startup E-prospects, with whom we have carried out many research and development projects over the years.
Finally, I must express my special gratitude to those dear to me, my family, and most of all to my wife, who has had to put up with my moods over the last few years.
Jean-Louis MONINO
This book was a work of adaptation, updating and rewriting in order to adapt all of the work of the TRIS laboratory. Its creation was fed by exchanges and discussions with my teacher Jean-Louis Monino, without whom this book would never have seen the light of day. I am infinitely grateful to him for having included me in this adventure.
It would not have been possible to produce this book without my family who have always encouraged and supported me throughout all my ideas and projects, no matter how far away they have sometimes been. Special mention must go to my mother, there are no words to express how important she is and how much she has done in making me what I am today.
Finally, I would like to thank Hans-Werner Gottinger, Mohamed Kasmi and Mustapha Ghachem for their unfailing support and for the interest that they have always shown in what I am doing.
Foreword
ordering system of knowledge must be created and put into place. For most companies, it is difficult to manage this massive amount of data. The greatest challenge is interpreting it. This is especially a challenge for those companies that have to use and implement this massive volume of data, since it requires a specific kind of infrastructure for the creation, storage, treatment, analysis and recovery of the same. The greatest challenge resides in “developing” the available data in terms of quality, diversity and access speed.
Alain IOZZINIO
Key Concepts
Before launching into the main text of this book, we have found it pertinent to recall the definitions of some key concepts. Needless to say, the following list is not exhaustive:
– Big Data: The term Big Data is used when the amount of data
that an organization has to manage reaches a critical volume that requires new technological approaches in terms of storage, processing, and usage. Volume, speed, and variety are usually the three criteria used to qualify a database as “Big Data”.
– Cloud computing: This term designates a set of processes that use
computational and/or storage capacities from remote servers connected through a network, usually the Internet. This model allows access to the network on demand. Resources are shared and computational power is configured according to requirements.
– Competitive intelligence: It is the set of coordinated information
company-defined objectives and improving its position in the competitive environment in which it operates. These kind of actions take place in an uninterrupted cycle that generates a shared vision of company objectives.
– Data: This term comprises facts, observations and raw
information. Data itself has little meaning if it is not processed.
– Data analysis:This is a class of statistical methods that makes it
possible to process a very large volume of data and identify the most interesting aspects of its structure. Some methods help to extract relations between different sets of data and thus draw statistical information that makes it possible describe the most important information contained in the data in the most succinct manner possible. Other techniques make it possible to group data in order to identify its common denominators clearly, and thereby understand them better.
– Data governance: It constitutes a framework of quality control
for management and key information resource protection within a company. Its mission is to ensure that the data is managed in accordance with the company’s values and convictions, to oversee its quality and to put mechanisms into place that monitor and maintain that quality. Data governance includes data management, oversight, quality evaluation, coherence, integrity and IT resource security within a company.
– Data journalism: The term designates a new form of journalism
based on data analysis and (often) on its visual representation. The journalist uses databases as his or her sources and deduces knowledge, meaningful relationships or intuitions from them that would not be accessible through traditional research methods. Even when the article itself stands as the main component of the work, illustrating ideas through graphs, diagrams, maps, etc., is becoming more important day by day.
– Data mining: Also referred to as knowledge discovery from data,
Key Concepts xiii
data; that is, in order to find interesting structures or recurrent themes according to criteria determined beforehand and to extract the largest possible amount of knowledge useful to companies. It groups together all technologies capable of analyzing database information in order to find useful information and possible significant and useful relationships within the data.
– Data reuse: This practice consists of taking a dataset in order to
visualize it, merge it to other datasets, use it in an application, modify it, correct it, comment it, etc.
– Data science: It is a new discipline that combines elements of
mathematics, statistics, computer science and data visualization. The objective is to extract information from data sources. In this sense, data science is devoted to database exploration and analysis. This discipline has recently received much attention due to the growing interest in Big Data.
– Data visualization: Also known as “data viz”, it deals with data
visualization technology, methods and tools. It can take the form of graphs, pie-charts, diagrams, mappers, timelines or even original graphic representations. Presenting data through illustrations makes it easier to read and understand.
– data.gouv.fr: The French government’s official website for
public data, which was launched on December 5th 2011 by Mission Etalab. In December 2013, data.gouv.fr was transformed deeply through a change in both the site’s structure and its philosophy. It has, without doubt, become a collaborative platform oriented towards the community, which has resulted in better reuse of public data.
– Dataset: Structured and documented collection of data on which
reusers rely.
– Etalab: This is a project proposed in the November 2010 Riester
Report and put into place in 2011 which is responsible for implementing the French government’s open data policy, as well as for establishing an almanac of French public data: data.gouv.fr.
– Hadoop: Big Data software infrastructure that includes a storage
– Information: It consists of interpreted data and has discernible meaning. It describes and answers questions like “who?”, “what?”, “when?” and “how many?”.
– Innovation: It is recognized as a source of growth and
competitiveness. The Oslo Manual distinguishes between four types of innovation:
- Product innovation: Introduction of a new product. This
definition includes significant improvements to technical conditions, components or materials, embedded software, user friendliness or other functional characteristics.
- Process innovation: Establishing a new production or
distribution method, or significantly improving an existing one. This notion involves significant changes in techniques, material and/or software.
- Marketing innovations: Establishing a new marketing method
involving significant changes in a product’s design, conditioning, placement, promotion or pricing.
- Organizational innovation: Establishing a new organizational
method in practices, workplace organization or company public relations.
– Interoperability: This term designates the capacity of a product
or system with well-known interfaces to function in sync with other existing or future products or systems, without access or execution restrictions.
– Knowledge: It is a type of know-how that makes it possible to
transform information into instructions. Knowledge can either be obtained through transmission from those who possess it, or by extraction from experience.
– Linked Open Data (LOD): This term designates a web-approach
Key Concepts xv
such that its items have a unique identifier and datasets are linked together by those identifiers.
– Open innovation: It is defined as increased use of information
and knowledge sources external to the company, as well as the multiplication of marketing channels for intangible assets with the purpose of accelerating innovation.
– Open knowledge foundation network: A British non-profit
association that advocates for open data. It has most famously developed CKAN (open source data portal software), a powerful data management system that makes data accessible.
– Open data: This term refers to the principle according to which
public data (gathered, maintained and used by government bodies) should be made available to be accessed and reused by citizens and companies.
– Semantic Web: This term designates a set of technologies seeking
to make all web resources available, understandable and usable by software programs and agents by using a metadata system. Machines will be able to process, link and combine a certain amount of data automatically. The semantic web is a set of standards developed and promoted by W3C in order to allow the representation and manipulation of knowledge by web tools (browsers, search engines, or dedicated agents). Among the most important, we can cite:
- RDF: a conceptual model that makes it possible to describe any
dataset in the form of a graph in order to create knowledge bases;
- RDF Schema: language that makes it possible to create
vocabularies, a set of terms used to describe things;
- OWL: A language that makes it possible to create ontologies
and more complex vocabularies that serve as support for logical processing (interfaces, automatic classification, etc.);
- SPARQL: A query language for obtaining information from
RDF graphs.
– Semi-structured information: It is worth noting that the boundary
one category or the other. In such a case, one is no doubt dealing with semi-structured information.
– Smart Data: The flood of data encountered by ordinary users and
economic actors will bring about changes in behavior, as well as the development of new services and value creation. This data must be processed and developed in order to become “Smart Data”. Smart Data is the result of analysis and interpretation of raw data, which makes it possible to effectively draw value from it. It is, therefore, important to know how to work with the existing data in order to create value.
– Structured information: It can be found, for example, in
databases or in programming languages. It can thus be recognized by the fact that it is arranged in a way such that it can be processed automatically and efficiently by a computer, but not necessarily by a human. According to Alain Garnier, the author of the book
Unstructured Information in Companies, “information is structured
when it is presentable, systematic, and calculable”. Some examples include forms, bills, pay slips, text documents, etc.
– Text mining: This is a technique that makes it possible to
automate processing of large volumes of text content to extract the main tendencies and statistically assess the different subjects they deal with.
– Tim Berners-Lee: He is the co-inventor of the Semantic Web. He
is very active and engaged in data.gov.uk. In particular, he has defined a five star ranking system to measure the Semantic Web openness level for putting a dataset online.
– Unstructured information: Unlike structured information,
unstructured information constitutes the set of information for which it is impossible to find a predefined structure. It is always intended for humans, and is therefore composed mainly of text and multimedia documents, like letters, books, reports, video and image collections, patents, satellite images, service offers, resumes, calls for tenders, etc. The list is long.
– Web 1.0: This term refers to the part of the Internet that makes it
Key Concepts xvii
hyperlinks. This Web was created at the beginning of the 1990s. It creates a relationship between an edited site that publishes content or services and Internet users who visit it and who surf from site to site.
– Web 2.0: This term designates the set of techniques, functions
and uses of the World Wide Web that have followed the original format of the Web. It concerns, in particular, interfaces that allow users with little technical training to appropriate new Web functions. Internet users can contribute to information exchanges and interact (share, exchange, etc.) in a simple manner.
– Web 3.0: (also known as the Semantic Web). This is a network
Introduction
Today data comes from everywhere: GPS tracking, smartphones, social networks where we can share files, videos and photos, as well as online client transactions made possible through the intermediary of credit cards. Of the 65 million people in France, 83% are Internet users and 42% (or 28 million) are on Facebook. More than 72 million telephones are active, and the French people spend a daily average of 4 hours online. Mobile phone users spend over 58 minutes online, and 86% of the population is on a social network. The French people spend over 1.5 hours per day on social networks.
Developing this massive amount of data and making access to it possible is known as “Big Data”. This intangible data comes in a constant stream and its processing is especially challenging in terms of knowledge extraction. This is why new automatic information extraction methods are put into place such as, for example, “data mining” and “text mining”. These are the sorts of processes behind radical transformations in the economy, marketing and even politics. The amount of available data will increase greatly with the appearance of new connected objects on the market that are going to be used more and more.
to their users through a computer, a tablet or a smartphone. More importantly, these objects will also be able to communicate with one another! We will be able to control equipment in our homes and in our car by simply logging onto our smartphone or some other device. This phenomenon is known as the “Internet of Things”.
The American economist, Jeremy Rifkin, predicted the development of a new society of wealth and abundance brought about by technology, especially by the Internet of Things and 3D printing. New technologies would modify socio-economic relationships to the point of significantly reducing profits for capitalist enterprises. In the world of the Internet, the advent of the zero marginal cost society has already taken place. As information has become dematerialized and as it has become possible to reproduce and distribute it with near-zero marginal costs, radical changes have come about in these industries’ business models.
Box I.1. Zero marginal cost society
This phenomenon has attracted the interest of operational decision-makers (marketing managers, finance chiefs, etc.) seeking to benefit from the immense potential involved in analyzing data hosted by companies in real-time. In order to meet the Big Data challenge, measures must be taken, including incorporating tools that make more restrictive data processing possible and actors capable of analyzing that data. This will only be possible if people become more aware of the benefits of “data development”. When databases are organized, reorganized and processed by statistical methods or econometric modeling, they become knowledge.
Introduction xxi
Data access makes it possible to enrich quantitative and qualitative analyses. Client contacts can be analyzed through data collected by a call center. This kind of product can also be offered in a limited quantity, as does e-prospects. It is necessary to develop that data by exploring the content of emails and voice calls, and to match that information with browsing activities on the company website. Beyond that, it is also possible to study messages exchanged on social networks (Facebook, Twitter, LinkedIn, etc.) in order to identify new trends or to identify the products that are being most talked about.
Box I.2. A data access example makes it possible to buy and sell the University of Montpellier’s TRIS laboratory2. The program is supported by the Languedoc-Roussillon region and by the “Transferts L-R” program3.
Example I.1. The startup E-PROSPECTS
1 http://www.e-prospects.biz.
2 TRIS stands for “Information and Statistics Development and Research” in French. 3 Transfert LR stands for “Regional Languedoc-Roussillon Innovation Agency” in French.
Contact and appointment providers • Professionals
• Request contacts and appointments in their sectors
• Demand
• Purchase
Choice between various providers Possibility of buying individually Different selling/purchasing models
Neutral and legitimate information on the provider
• Demand
• Supply
• Production
• Call centers
• W eb agencies
• Telemarketing companies
• Leads professionals
In order to get the full potential out of data, it must be available to all interested parties with no additional obstacles and at reasonably accessible costs. If data is open to users [MAT 14], other specialized data processing companies can be created. This activity will meet the needs of users without them having to develop models and equations themselves.
Open Data, beyond its economic and innovative potential, involves
a philosophical or ethical choice4. Data describes collective human
behavior, and therefore, belongs to those whose behaviors it measures. The cultivation of these phenomena depends on the availability of data that can be communicated easily.
The Internet Age has detonated a boom in information research. Companies are flooded by the wealth of data that results from simple Internet browsing. In other words, they are forced to purchase pertinent information to develop high added value strategies that allows them to succeed in the face of incessant changes in their business environment. Industrial strategies now rely strongly on the capacity of companies to access strategic information to better navigate their environment. This information can, thus, become the source of knew knowledge (knowledge pyramid).
The process of gathering, processing and interpreting information is not limited to defining ideas, but also consists of materializing them in order to ensure improved knowledge production that leads to innovation. Competitive intelligence allows each company to optimize its service offerings in qualitative and quantitative terms, as well as to optimize its production technology.
Introduction xxiii
In the last few years, several initiatives to verify the
authenticity of diplomas have been launched. In this regard, it is worth noting that University of Montpellier and, in particular, its research laboratory TRIS have been pioneers in the fight against diploma falsification since 2011.
Example I.2. Information processing C2i certificate security and massive processing5 by QRCode6
Beyond the advent of ICT and of increased data production, dissemination and processing speeds, another element has recently become critically important: time. The importance of time carries with it a notion of information circulation speed. This prompts companies to rethink their strategies beyond the challenges involved in processing large volumes of data. The value of a given piece of data increases in time and depends on the variety of uses it is given.
In this sense, companies must possess the capacity to absorb the entirety of data available, which allows them to assimilate and reproduce knowledge. This capacity requires specific skills that make
5 C2i: IT and Internet Certification Established in 2004 by the French National Ministry of Education and Research. One of the websites devoted to the certification: http://www.portices.fr
6 A QR code is a type of two dimensional barcode (or datamatrix code) composed of black squares aranged in a larger squeare with a white background. The distribution of these points defines the information contained in the code. QR (an abbreviation for quick response) means that the code’s content can be quickly decoded when read by a scanner.
EXAMPLE
it possible to use that knowledge. Training “data scientists” is, therefore, indispensable in order to be able to identify useful approaches for new opportunities, or for internal data exploitation, and in order to quantify their benefits in terms of innovation and competitiveness. However, Big Data is just a single element in the new set of technical tools known as “data science”.
Data scientists have the task of extracting knowledge from company data. They hold a strategic function within the firm, and to that end, must be in command of the necessary tools. They must also be able to learn on the go and increase their understanding of data mining regularly, as the volume of data requires increasing skills and techniques.
E-prospects’s research and development project, carried out in collaboration with TRIS, has been developed by using Statistica’s data mining.
Example I.3. Data mining and Statistica software
Introduction xxv
Big Data groups together both processing, collection, storage and even visualization of these large volumes of data. This data, thus, becomes the fuel of the digital economy. It is the indispensable raw material of one of the new century’s most important activities: data intelligence. This book shows that the main challenges for Big Data revolve around data integration and development within companies. It explores data development processes within a context of strong competition.
More specifically, this book’s research brings together several different fields (Big Data, Open Data, data processing, innovation, competitive intelligence, etc.). Its interdisciplinary nature allows it to contribute considerable value to research on the development of data pools in general.
I.1. The power of data
Companies are very conscious of the importance of knowledge and even more so of the way it is “managed”, enriched and capitalized. Beyond all (financial, technical and other) factors, the knowledge that a company has access to is an important survival tool, whether it is market knowledge, or legal, technological and regulatory information.
Knowledge is an extension of information to which value has been added because it is underpinned by an intention. It is a specifically-human phenomenon that concerns thought in rational, active and contextual frameworks. It represents an acquisition of information translated by a human element and which requires analysis and synthesis in order to assimilate, integrate, criticize and admit new knowledge.
data collected during research is transformed into information. Data processing provides information that can be accessed in decision-making moments.
Lesca [LES 08] explores the problems behind interpreting data to transform it into strategic information or knowledge. Interpretation systems, which are at the heart of competitive intelligence, are defined as “meaning attribution systems”, since they assign meaning to information that companies receive, manipulate and store [BAU 98].
According to Taylor [TAY 80], the value of information begins with data, which takes on value throughout its evolution until it achieves its objective and specifies an action to take during a decision. Information is a message with a higher level of meaning. It is raw data that a subject in turns transforms into knowledge through a cognitive or intellectual operation.
This implies that in the information cycle, collected data must be optimized in order to immediately identify needs and address them as soon as possible. This will, in turn enhance interactions between a diversity of actors (decision-makers, analysts, consultants, technicians, etc.) within a group dynamic favoring knowledge complementarity, one which would be aimed at improving the understanding, situational analyses and information production necessary for action. Indeed, “operational knowledge production quality depends on the human element’s interpretation and analysis skills when it is located in a collective problem solving environment” [BUI 06, BUI 07].
Everyone produces data, sometimes consciously, sometimes unconsciously: humans, machines, connected objects and companies. The data we produce, as well as other data we accumulate, constitutes a constant source of knowledge. Data is, therefore, a form of wealth, and exploiting it results in an essential competitive advantage for an ever-tougher market.
Introduction xxvii
knowledge”. This model is often cited in the literature concerning information and knowledge management. Several studies show that the first mention of the hierarchy of knowledge dates back to T.S. Elliot’s 1934 poem “The Rock”. The poem contains the following verses:
– where is the wisdom we have lost in knowledge;
– where is the knowledge we have lost in information.
In a more recent context, several authors have cited “From Data to Wisdom” [ACK 89] as being the source of the knowledge hierarchy. Indeed, the hierarchic model highlights three terms: “data”,
“information” and “knowledge”7. The relationship between the three
terms can be represented in the following figure, where knowledge is found at the top to highlight the fact that large amounts of data are necessary in order to achieve knowledge.
Figure I.1. Relationship between data, information and knowledge [MON 06]
7 This hierarchic model was taken up by Monino and Lucato [MON 06] in order to demonstrate the importance of information in the business intelligence process (see also [MON 13a]).
Data
Information
Knowledge
Data
Information
Wisdom accumulation (intelligence) is not truth. Wisdom emerges when the fundamental elements giving rise to a body of knowledge are understood. For Elliot, wisdom, is hence, the last phase of his poem. In our presentation of the concept of competitive intelligence, we have made decision-making the equivalent of wisdom (see Figure I.2).
Figure I.2. The hierarchic model: data, information, and knowledge [MON 06]8
The boom in the number of available data sources, mostly coming from the Internet, coupled with the amount of data managed within these sources, has made it indispensable to develop systems capable of extracting knowledge from the data that would otherwise be hidden by its complexity. This complexity is mostly due to the diversity, dispersion and great volume of data.
8 Jean Louis Monino, is a professor and director of the TRIS laboratory at the University of Montpellier. Gilles Lucato is the technological council in charge of “digital data acquisition, processing and visualization” at Transfert LR, the Languedoc-Roussillon Regional Innovation Agency.
OBSERVATION
Define search criteria
Search for the data
DATA
INFORMATION KNOWLEDGEAWARENESS
Collect and process
Validate and spread information
Analyze the information and integrate it into the
decision-making process
FINANCIAL INTELLIGENCE
DECISION-MAKING
Orientate
Share
Change
How r to extract th
Example I.4 ent and from th
llions of dol he city of Mont
Introduction xxxi
producing analyses compatible with the businesses’ requirements. This data can in turn be used as explaining variables in the “models” on which a variety of users rely to make predictions or, more precisely, to draw relations based on past events that may serve to make future projections.
If data is collected and stored it is because it holds great commercial value for those who possess it. It allows to target services and products to a more and more precise set of customers as determined by the data. It is indeed at the heart of “intelligence” in the most general sense of the word.
I.2. The rise of buzzwords related to “data” (Big, Open, Viz)
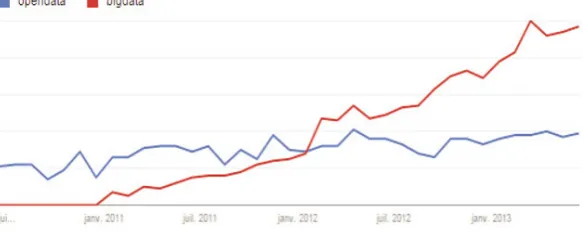
In recent years, economic articles that do not make some mention or other of terms related to “data” (such as “Big Data”, “Open Data”, or “data mining”) when talking about companies have become few and far between. This tendency has led some scholars to believe that these concepts are emerging as new challenges that companies can profit from. We will chart the emergence of the data boom, especially of Big Data and Open Data, by studying search tendencies on Google (Google Trends).
Figure I.3. Web searches on “Big Data” and “Open Data” 2010–13 according to Google Trends. For a color version of the
But what exactly is “data”? Data is a collection of facts, observations or even raw elements that are not organized or processed in any particular manner, and that contain no discernible meaning. Data is the basic unit recording a thing, an event, an activity or a transaction. A single piece of data is insignificant on its own. Data does not become significant until it is interpreted and thus comes to bear meaning.
The way in which we “see” and analyze data has progressively changed since the dawn of the digital age. This change is due to the latest technology (Smart, 4G, Clouds, etc.), the advent of the Internet, and a variety of data processing and exploration software, since the potential to exploit and analyze this large amount of data has never been as promising and lucrative as it is today.
In order to process more and more data, and to advance in the direction of real-time analysis, it is necessary to raise awareness about this new universe composed of data and whose processing is a genuine asset. In general terms, the technological evolution related to information processing capacities through its entire transformation chain drives us to explore the current interest in terms related to “data”9.
One of the most important terms related to the data family is of course “Big Data”, a phenomenon that interests companies as much as scholars. It establishes constraints to which companies must adapt: a continuous flow of data, a much faster circulation of data, even more complex methods. Big Data represents a challenge for companies that want to develop strategies and decision-making processes through analysis and transformation of that data into strategic information. In
Introduction xxxiii
these new orders of magnitude, data gathering, storage, research, sharing, analysis and visualization must be redefined.
The growing production of data, generated by the development of information and communication technologies (ICTs), requires increased data openness, as well as useful sharing that would transform it into a powerful force capable of changing the social and economic world. “Open Data”, another term assigned to the data craze, became popular despite the novelty of the practice, thanks to its capacity to generate both social and economic value. This phenomenon has attracted much attention in the last few years, and one of the Open Data initiative’s main objectives is to make public data accessible in order to promote innovation.
Moreover, a number of professional contexts require reading and understanding very diverse sets of data: market studies, dashboards, financial statistics, projections, statistical tests, indicators, etc. To this end, a variety of techniques aimed at solving a variety of problems is used in the professional world, from client service management to maintenance and prevention, including fraud detection and even website optimization. These techniques are known today as “data mining”.
The concept of data mining has gained traction as a marketing management tool since it is expected to bring to light information that can prove useful for decision-making in conditions of uncertainty. Data mining is often considered a “mix of statistics, artificial intelligence, and database exploration” [PRE 97]. Due to its growing use, this field is considered an ever more important domain (even in statistics), where important theoretical progress has taken place.
The term “data science” was invented by William Cleveland in a programmatic article [CLE 14]. Data science constitutes a new discipline that combines elements of mathematics, statistics, computer science and data visualization.
“Data visualization” refers to the art of representing data in a visual manner. This may take the form of graphs, diagrams, mappers, photos, etc. Presenting data visually makes it easier to understand. Beyond illustration, it is possible to go as far as presenting data in the form of animations or videos.
These terms surrounding the data craze are ultimately not just buzzwords, they are also terms that confer more value to data. This is why we can now combine enormous volumes of data, which leads to deeper and more creative insight.
“Big Data”, however, is not just big because of the volume of data it deals with. The word “big” also refers to the importance and impact involved in the processing of this data, since, with Open Data, the amount will progressively increase, which means that “Big Data” helps us “think big”. Therefore, the universe surrounding data is a movement in which France, with all its assets, must participate from now on. But, in order to meet the challenge, it is important for all actors to come together around this great movement and transform the risks associated with Big Data into opportunities.
I.3. Developing a culture of openness and data sharing
Introduction xxxv
behavior and remaining attentive to their needs, so as to create the products and services of tomorrow, which will allow companies to produce benefits to achieve their objectives.
This forces us to rethink the value of data in a world that is advancing towards constant digital interoperability, sharing and collaboration. Open Data has spread throughout the world due to its capacity to generate both social and economic values. In this regard, several countries are actively contributing to the evolution of data by allowing access and reuse of government data.
The term “Open Data”, which means that all data should be freely available, was first used at the end of the 2000s, originally in the US, and then in the UK, since the two countries were the first to commit themselves to the process. In 2007, the city of Washington DC was the first to make its data openly available on an online platform. In January 2009, President Obama signed a transparency initiative that led to the establishment of the Internet portal data.gov in 2009. It was, thus, at the beginning of 2010, that data marketplaces emerged in the US, such as Data-market, Factual, Infochimps, Kasabi, and Windows Azure Data Marketplace.
The President of the United States went far in advocating Open Data. It is not just a question of making data available openly in the interest of transparency. According to him, “entrepreneurs can rely on open data to create jobs by solving problems faced by Americans that the government cannot solve”.
Box I.4. Open Data and job creation
We can say that the principle of Open Data dates back to the
Declaration of the Rights of Man and of the Citizen, which states:
unfortunately always been imperfect, was formalized in French history through the Right of Access to Public Records Law, in 1794, through the creation of a large-scale statistics and information government body [INS 46] and through the establishment of a public body to diffuse the same right.
INSEE, France’s National Institute for Statistics and Economic Studies, undertook a classification and sectorization of the French population. Two grids are made available, either with 1 km or 200-meter sectors.
On the left, we see the map of France. It displays data corresponding to population estimates on a 1 km by 1 km grid.
Website:
http://www.insee.fr/
Example I.6. INSEE and sectorization
The French government’s Open Data initiative was materialized
in the launching of the data.gouv.fr website in 201110. Furthermore,
on 27 January 2011, the city of Paris launched the platform “Paris Data”.
10 The law of July 17 1978 proposed the idea of generalized open public data and granted access to public information, thus setting the foundation for the information society. The right to reuse public information was created by the 2003 PSI European directive, which was translated in French law in 2005, and whose revision was approved by the EU Council on April 2013.
Introduction xxxvii
In the same regard, and based on INSEE and Autour.com’s data, the TRIS laboratory developed an algorithm referencing the region of l’Hérault, which is called “Snail Algorithm”. It makes it possible to know the location or situation of the item queried in reference to an address, which is represented with a reference point that constitutes the search item. Work realized by J.L. Monino for the startup Autour.com and supported by Alter-Incub in Montpellier.
http://www.alterincub.coop/
Example I.7. A startup population tracking app
Open Data and data sharing are the best ways for both the government and companies to organize, communicate and bring about
the world of collective intelligence11. Open Data’s culture is founded
on the availability of data that can be communicated easily. This makes it possible to generate knowledge through transformation effects where data is supplied or made available for innovative applications.
11 Handbook on public open data and data sharing, September 2013.
The city of Rennes was the first to genuinely work on the idea of making Open Data a vector for public service improvement. France’s Open Data website: https://www.data.gouv.fr/fr/ The Paris Data website: http://opendata.paris.fr/page/ home/
Example I.8. Open Data in the city of Rennes
It is also a means for constructing working relationships with actors who care about the public good in order to prolong public action by designing new services that favor all parties involved. The objective is to favor or make it easier to reuse and reinterpret data in the most automated way possible. This has great potential, in terms of activities that create added value through data processing.
In France, INSEE supplies a massive amount of economic, demographic and sociological data (complimented by data from the OECD, Eurostat, the IMF and INED). This data is not quite raw, since it has been processed slightly. This data can, in turn, be used to explain variables in the “models” that a variety of users rely on to make predictions, draw relations or make comparisons.
Introduction xxxix
benefit from this data do not possess the statistical capacities to link some datasets with others and draw operative conclusions. Because of the costs involved, not all companies have access to the statistical means required to identify correlations or causal links within the data, or to “locate” a piece of data with respect to the rest through “data analysis”.
The collection of these econometric techniques constitutes a specific kind of knowledge that governments and large public entities may possess, but that is unviable for most of the companies. And yet, without econometrics, there is little competitive intelligence to be had. “Processed” means that the data should be freely accessible to all (which is not always the case) so that it can become “information”.
Today, in order to process data, companies must often hire specialized companies, consulting firms, to gather, process and draw operative conclusions from data. This call to subcontractors, inevitably, has a cost, and it does not always lead to satisfactory results. The subcontractor does not always treat the data with the same care that the company itself would apply if it were transforming the data into information on its own. Administrators sometimes resort to external companies, either because they lack the technical resources to process data internally, or because the specialized companies ultimately offer a lower price for processing than it would cost to do it internally.
Data processing algorithms that users can access and that process data according to their requirements are available. Currently, data processing chains forms a sort of “ecosystem” around “data”:
– producers and transmitters of data: entities that produce and, at most, make their data available openly by making it accessible to all;
– lastly, the end users who benefit from this information, and thus, develop intelligence about their economic, political, social or even cultural “environment”.
Big Data, in the present context, represents an all-new opportunity for creating “online” companies that do not sell data processing services, but which provide algorithms and rent them out for use by the final users, the third actor in the abovementioned ecosystem. There is an enormous potential for data-processing algorithm-development favoring all the users.
When an internal statistic research service in charge of processing data is created, a license is purchased for a fixed or undetermined duration, and it becomes necessary to assign someone to the job of processing. If companies hire a consulting service that goes out to gather, process and draw information and knowledge from the data, they are forced to always purchase their information, even if in a limited degree. Ultimately, the experts will always choose data to be processed (or not), select available data or data necessary to choose in order to ideally arrive at operative conclusions.
French startups like Qunb and Data Publica have adopted the same strategy as American startups like Infochimps and DataMarket, which rely on data drawn from Open Data for processing and sharing. For its
part, Data Publica12 offers the possibility of preparing datasets
according to clients’ requirements. Public data can be a genuine source of energy for startups in any domain.
With these algorithm startups, as with many other sectors, there is a transition from purchasing software to purchasing a usage license for the software. This is comparable to the move towards car or bike-sharing systems in transportation.
Introduction xli
In January 2014, Data Publica launched its product “C-Radar”, the first predictive selling service in France, catering to B2B companies. It allows organizations to find new prospects, partnerships and suppliers thanks to an up-to-date search engine of the most recent data, which uses unique machine learning algorithms to map and segment a company’s market and ecosystem to identify new business opportunities in targeted sectors.
Data Publica’s website: http://www.data-publica.com/ C-RADAR’s website: http://www.c-radar.com/
Example I.9. Data Publica and C-RADAR
To give a more precise example in the field of economics, a startup could offer a sales forecast model. Imagine a company that sells a given product or a category of products, and that seeks to predict its future sales. The startup develops a series of explaining variables to define its stock (growth rate, revenue growth, price index, etc.) and it performs one or several linear regressions to relate the quantity of product sold by the company to those explaining variables.
startup and made available to users willing to pay. There can be as many startups as there are models or groups of models.
It is also possible to imagine, based on the coloration model [MON 10] that a client seeks to know how to “color” its PR communications. The startup can have a search engine of all texts that of interest to the firm, and establish a global coloration analysis system on all those texts, possibly based on words provided by the client itself.
The coloration model makes it possible to relate exogenous data on an underlying asset’s color variation, and thus, inquire if the information’s color variation coincides with stock market fluctuations. The results show that this model predicts market developments in a statistically significant manner. This model examines if the coloration of exogenous information involves a variation in the direction of an identical action. The model relating stock market data and informative coloration is based on Markov chains. The model has been applied to the financial market field, although it is clear that it can be extended to other fields as well. Coloration of an exogenous event can also be interesting for politics, in order to examine the impact of a speech on a politician’s popularity.
Box I.5. Monino-Boya’s coloration model
1
The Big Data Revolution
The amount of data generated by people, Internet-connected devices and companies is growing at an exponential rate. Financial institutions, companies and health service providers generate large quantities of data through their interactions with suppliers, patients, customers and employees. Beyond those interactions, large volumes of data are created through Internet searches, social networks, GPS systems and stock market transactions. This widespread production of data has resulted in the “data revolution” or the Age of Big Data.
The term “Big Data” is used to describe a universe of very large sets of data composed of a variety of elements. This gives way to a new generation of information technology designed to make available the increased processing speeds necessary to analyze and extract value from large sets of data, employing – of course – specialized materials and software. The phenomenon of Big Data not only refers to the explosion in the volume of data produced, which was made possible by the development of information storage and dissemination capacities on all sorts of platforms, but the term also refers to a second phenomenon, which involves newfound data processing capabilities.
In general terms, the concept of Big Data describes the current state of affairs in the world, in which there is a constant question of how to manage lumps of data in a better way, and how to make sense of the massive volume of data produced daily.
Big Data, Open Data and Data Development, First Edition. Jean-Louis Monino and Soraya Sedkaoui.
Data sources are multiplying: smartphones, tablets, social networks, web services and so on. Once these intelligent objects are connected to the Internet, they can feed data into enormous databases and communicate with other objects and humans [PRI 02]. This data must be processed and developed in order to become “intelligent” or “smart”. Intelligence, which can be brought out by using analysis techniques, can provide essential information that top management will require in order to determine strategies, boost operational performance and manage risks.
To this end, “data scientists” must pool their strengths in order to face the challenges of analyzing and processing large pools of data, gaining clarity and precision. Data scientists must make data “speak” by using statistical techniques and specialized software designed to organize, synthesize and translate the information that companies need to facilitate their individual decision-making processes.
1.1. Understanding the Big Data universe
The IT craze that has swept through our society has reached a new level of maturity. When we analyze this tendency, we cannot help being overwhelmed by the transformations that it has produced across all sectors. This massive wave developed very quickly and has resulted in new applications. Information and communication technologies (ICTs) and the advent of the Internet have triggered an explosion in the flow of information (Big Data). The world has become digital, and technological advances have multiplied points of access to data.
But, what exactly is Big Data? The concept really took off with the publication of three important reports from the McKinsey Institute:
– Clouds, Big Data, and Smart Assets: Ten Tech-Enabled Business Trends to Watch [BUG 10];
– Are You Ready for the Era of “Big Data”? [BRO 11];
The Big Data Revolution 3
“Big Data” describes: “a series of data, types of data, and tools to respond quickly to the growing amount of data that companies process
throughout the world1”. The amount of data gathered, stored and
processed by a wide range of companies has increased exponentially. This has partially benefited from an explosion in the amount of data resulting from web transactions, social media and bots.
The growth of available data in terms of quantity, diversity, access speed and value has been enormous, giving way to the “four Vs”:
“Volume”, “Variety”, “Velocity” and “Value”2, that are used to define
the term Big Data:
– Volume: the advent of the Internet, with the wave of
transformations in social media it has produced; data from device sensors; and an explosion of e-commerce all mean that industries are inundated with data that can be extremely valuable. All these new devices produce more and more data, and in turns, enrich the volume of existing data;
– Variety: with the rise of Internet and Wi-Fi networks,
smartphones, connected objects and social networks, more and more diverse data is produced. This data comes from different sources and varies in nature (SMSs, Tweets, social networks, messaging platforms, etc.);
– Velocity: the speed at which data is produced, made available, and interpreted in time. The possibility of processing data in real-time represents a field of particular interest, since it allows companies to obtain results like personalized advertisements on websites, considering our purchase history, etc.;
– Value: the objective of companies is to benefit from data, especially by making sense out of it.
The challenges of Big Data are related to the volume of data, its variety, the speed at which it is processed, and its value. Some
scholars add another three “Vs”, namely3: “Variability”, “Veracity”, and “Visualization”.
The first V refers to data whose meaning evolves constantly. The second qualifies the result of the data’s use, since even though there is a general consensus about the potential value of Big Data, data has almost no value at all if it is not accurate. This, particularly, is the case for programs that involve automatic decision-making, or for data feeding into unmonitored machine learning algorithms. The last V, which touches on one of the greatest challenges of Big Data, has to do with the way in which the results of data processing (information) are presented in order to ensure superior clarity.
The expression “Big Data” represents a market in and of itself.
Gilles Grapinet, deputy CEO of Atos notes that “with Big Data,
organizations’ data has become a strategic asset. A giant source of unexpected resources has been discovered.” This enormous quantity of data is a valuable asset in our information society.
Big Data, therefore, represents a large discipline that is not limited to the technological aspect of things. During recent years, the concept has sparked growing interest from actors in the information management systems sector. The concept of the “four Vs” or even that of the “seven Vs” opens up new avenues for consideration and research, but they do not provide a clear definition of the phenomenon. The sum of these “Vs” gives way to new perspectives for new product creation through improved risk management and enhanced client targeting. Actions aimed at anticipating and reducing subscription suspensions or at making customers more loyal can also be envisioned.
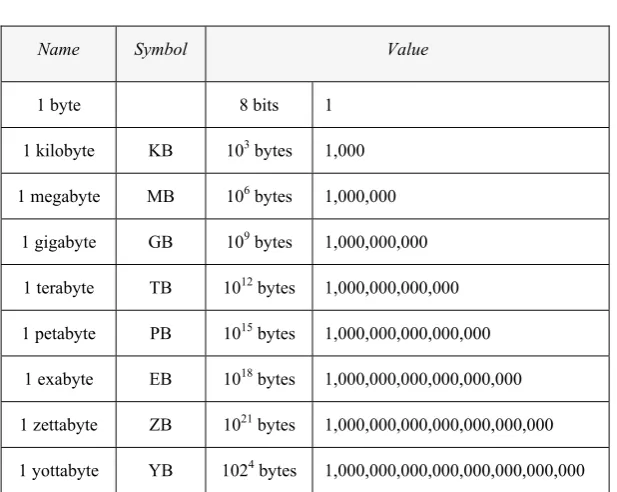
The increase in the volume of data, processing speed and data diversity all present new challenges to companies and affect their decision-making processes. And yet, companies that produce, manage and analyze vast sets of data on a daily basis now commonly use terms such as terabyte, petabyte, exabyte and zettabyte.
The Big Data Revolution 5
Name Symbol Value
1 byte 8 bits 1
1 kilobyte KB 103 bytes 1,000
1 megabyte MB 106 bytes 1,000,000
1 gigabyte GB 109 bytes 1,000,000,000
1 terabyte TB 1012 bytes 1,000,000,000,000
1 petabyte PB 1015 bytes 1,000,000,000,000,000
1 exabyte EB 1018 bytes 1,000,000,000,000,000,000
1 zettabyte ZB 1021 bytes 1,000,000,000,000,000,000,000
1 yottabyte YB 1024 bytes 1,000,000,000,000,000,000,000,000
Table 1.1. Data units of measurement
In 1999, Wal-Mart (one of the US’s most important retail chains) had a database of 1,000 terabytes (that is, 1,000,000 gigabytes of data). By 2012, this quantity had grown to over 2.5 petabytes (2.5 million gigabytes) of data.
Box 1.1. Wal-Mart’s database
The Big Data phenomenon has rendered classical data processing methods antiquated, and now stands as an opportunity in the business world, especially for companies that know how to use it.
Amazon.com, a leader in product suggestions processed through Big Data, analyzes purchase histories, product listings, and commentaries posted on its site.
fro to increase its acing diapers a ther on their she
Big with a complete
ll-being. The mate data on it n, in turns, use
ata Revolution
1.2. What changes have occurred in data analysis?
Companies have always needed to analyze data in order to have a precise understanding of their situation and to predict their future business moves.
Data analysis, when it is not preceded by the word “Big”, refers to the development and sharing of useful and effective models. For the most part, it uses a variety of methods from different research fields, like statistics, data mining, visual analysis, etc. It caters to a wide range of applications, including data summarization, classification, prediction, correlation, etc.
In the 1970s and 1980s, computers could process information, but they were too large and too costly. Only large firms could hope to analyze data with them. Edgar F. Codd and Hubert Tardieu were the first to work on data organization by designing database management systems (DBMSs), in particular relational databases. Data processing and analysis, in the present day, are brought together under the notion of “Business Intelligence”, due especially to computers’ increased processing capabilities.
A fundamental requirement for successful data analysis is to have access to semantically rich data that links together pertinent information elements for objective analysis. However, the situation has changed with Big Data because data now comes from several sources of very different kinds and in different forms (structured, unstructured). This leads us to say that new data processing tools are now necessary, as are methods capable of combining thousands of datasets.
In the Big Data universe, companies seek to unlock the potential of data in order to generate value. They are also impatient to find new ways to process that data and make more intelligent decisions, which will result in better client service, improved process efficiency and better strategic results.
The Big Data Revolution 9
which data is generated, as well as the multiplicity of sources that generate it in different formats (digital, text, images, etc.), are characteristic of this phenomenon:
“Big Data refers to volume, variety, and velocity of
data – structured or unstructured – that is transmitted across networks in transformation processes and across storage devices until it becomes knowledge that is useful
for companies”, (Gartner Research Firm).4
The following image shows one perspective on the massiveness of data and on its growing evolution through different interconnected technologies. This volume of data is available today due to storage capacities that have increased while their cost has correspondingly diminished.
Figure 1.1. Diversity of data sources
This large collection of data is often created in real-time and its quick processing provides knowledge to managers that was previously inaccessible. At the same time, it allows them to optimize their decision-making processes. Data is, therefore, transformed into a plan of action to be put into place, into decisions to be taken and into new markets to explore.
There are essentially three types of challenges surrounding Big Data:
– massive data storage management, in the order of hundreds of terabytes or of petabytes, which go beyond the current limits of classic relational databases in terms of data storage and management;
– unstructured data management (which often constitutes the largest portion of data in Big Data scenarios). In other words, how to organize text, videos, images, etc.;
– analysis of this massive data, both for reporting and for advanced predictive modeling, but also for its deployment.
In current usage, the term “Big Data” does not refer exclusively to vast sets of data. It also involves data analysis and value extraction operating on large volumes of data. The expression “Big Data” thus refers to the technologies, processes and techniques that enable organizations to create, manipulate and manage data on a large scale [HOP 11], as well as to extract new knowledge in order to create new economic value.
The large volume of data collected, stored and disseminated through different processing technologies is currently transforming priorities and developing new analysis tools, which are in line with changes in companies’ operations and which will transform the business landscape. At the same time, new analytic techniques make it possible to examine the datasets. Processing them will play a crucial role, and will allow companies to gain a competitive advantage.
The Big Data Revolution 11
The present day software tools make it possible to process and assimilate this massive volume of data quite quickly. Understanding the technological dimension of things is nevertheless fundamental because it makes it possible to understand its limits and potentialities, as well as to identify the most relevant actions to take. With exponential increase in the volume of data, companies attempt to use available analysis tools to find out how to extract value from their gathered data.
A study carried out by [MAC 12] showed that companies that adopted advanced data analysis tools attain more productivity and better profit margins than their competitors. In fact, technical competence in data processing is now a genuine strategic asset for companies’ competitive differentiation [BUG 11].
Thanks to new Big Data methods and tools, it has become possible to work on large volumes of data. The result is an advantage stemming from the possibility of bringing to light correlations in new data. Interpreting this large volume of data is the greatest challenge facing Big Data, since information resulting from it can be the basis for new knowledge that brings about development opportunities.
Technology now offers a perspective on data as structured and therefore, static. Technological limits, in terms of performance and storage, reduce the scope of possible analysis to sets of explicit data. Most solutions provide the couple: “storage and processing”. It is worth noting that growth in the volume of data has been accompanied by a reduction in the price of storage.
1.
nt of storage c
The Big Data Revolution 13
information, which will, in turn, be transformed into knowledge useful for cognitive or intellectual operations. However, attaining the complete potential of data depends on the way in which it is presented. It must be used and reused in different ways, without its value being diminished. This requires making data available in the right form and at the right time to any party interested in exploiting and adding value to it.
“Data Is the New Oil” [ROT 12]. It is the indispensable raw material of one of the new century’s most important activities: data intelligence. However, it is important to be prudent in our predictions because a lot of data is not yet “the right data”. There is, therefore, an underlying difficulty behind Big Data, since more data is not necessarily better data. It is possible to obtain better results by making better use of available data.
Twitter has become a popular source for Big Data exploitation, but working with Twitter data represents a huge methodological challenge that is seldom taken up.
Box 1.3. A methodological challenge: Twitter
When researchers encounter a set of data, they need to understand not only the limits of the available set of data, but also the limits of the questions that it can respond to, as well as the range of possible appropriate interpretations.
The McKinsey Global Institute’s July 2013 report estimates that Big Data applications could result in a $30 million increase in retail sales due to productivity gains, increased transparency, and more sophisticated targeted marketing, advertisements and sales.
Box 1.4. McKinsey Global Institute’s 2013 report
But how can we obtain or make progress with such benefits by using Big data? How can companies bring together and combine data from disparate sources to achieve projected gains? What role can the data analysis play in what amounts to an IT challenge? What changes are required in order for data analysis to become a more practical discipline? These questions refer to some of Big Data’s greatest challenges, and they represent the difficulties that make it a “Big Challenge”.
The greatest objective for Big Data involves intelligent database management aimed at identifying and extracting pertinent information allowing companies or users to establish strategies that actually address identified needs. Intelligent data makes it possible to go from raw (structured or unstructured) data coming from internal or external sources to strategic information.
The ultimate goal is not only to collect, combine or process all data, but also to increase its value and efficiency. This means that we must evolve from “Big” data to “Smart” data, since the effectiveness
of companies’ strategies now depends on the quality of data5.
Data quality refers to its adequacy for its envisioned use in operations, processes, decision-making and planning. Data quality, in this regard, also has an impact on product lifecycle analysis. Data quality is highly important because it represents a key source of value for companies.
The Big Data Revolution 15
Data quality is important for monitoring and evaluating progress towards objectives. It is all the more important when it relates to reliable and accurate information gathered through company data management systems. Having access to accurate information makes it possible to:
– demonstrate responsibility and good governance;
– provide decision-makers with the information necessary to plan, allocate resources and elaborate strategies;
– monitor progress towards the attainment of established goals and objectives.
Indeed, companies must not rely on the size of their data – it is not useful unless it is applied in an intelligent manner. Therefore, the volume of data is of little importance, since internal data must be combined with external data in order for a company to obtain the most out of its data. What is truly necessary are excellent analytic skills, a capacity to understand and manipulate large sets of data, and the capacity to interpret and apply the results.
The challenge is to consider the data’s use, rather than its quantity. This could become the most profitable way of extracting the value of data from the massive sources available. The evolution from “Big Data” to “Smart Data” represents a new awareness of the importance of data processing. It is at this level that the figure of the “data scientist” appears. They are well-trained in computer science, mathematics and statistics, which they combine with good knowledge of the business world. They must be able to analyze a phenomenon from all possible angles in order to draw profit from the company’s data assets.
![Figure I.1. Relationship between data, information and knowledge [MON 06]](https://thumb-ap.123doks.com/thumbv2/123dok/3935631.1879051/29.442.58.361.304.477/figure-i-relationship-data-information-knowledge-mon.webp)
![Figure I.2. The hierarchic model: data, information, and knowledge [MON 06] 8](https://thumb-ap.123doks.com/thumbv2/123dok/3935631.1879051/30.442.83.385.175.365/figure-i-hierarchic-model-data-information-knowledge-mon.webp)


![Figure 3.1. A model of economic intelligence [MON 12]](https://thumb-ap.123doks.com/thumbv2/123dok/3935631.1879051/106.442.82.385.118.304/figure-model-of-economic-intelligence-mon.webp)