Cell Balancing On Three- Cell Lithium Polymer Batteries
Connected In Series
Erika Loniza
1, Johanes Andriano Situmorang
*2, Adha Imam Cahyadi
31Department of Medical Electronics Technology, Universitas Muhammadiyah Yogyakarta
Jl. Lingkar Barat, Tamantirto, Kasihan, Bantul, (0274) 387656
2,3Department of Electrical Engineering and Information Technology, Universitas Gajah Mada
Jl Grafika no 2 Universitas Gajah Mada Yogyakarta 55581 indonesia *Corresponding author, e-mail: [email protected]
Abstract -Electric vehicle becomes popular recently, particularly in Indonesia. One of the most important and crucial components in an electrical vehicle is the battery. BMS (Battery Management System) is a system to monitor and regulate the performance of the battery resulting in effective-efficient-durable performance. Usually, BMS is needed to prevent battery from system failure. One of the problems that normally happens in a multi-cell battery and causing system failure is voltage unbalance. In this study, the system is designed so it can monitor the voltage condition of the three battery’s cells in series circuit and manage to balances it. The process of balancing the value of the voltage at the battery cells is known as cell balancing. The method used in this study is by using passive shunt resistor balancing method. In this method, an electronic circuit is designed in order to balance the value of the voltage at the battery cells using resistors to remove excess voltage. The result shows that the electrical circuit is capable to balance the voltage of each cell. Moreover, the designed circuit is monitored by software so it can perform in flexible manner. Copyright © 2017 Universitas Muhammadiyah Yogyakarta- All rights reserved. Keywords: cell balancing, three cell lithium, passive balancing
I.
Introduction
Batteries are devices that act as energy storages and discharge them in the form of electrical energy as a result of chemical energy conversion. Battery technology has entered the world of automotive and transportation, through the development of vehicles that utilize electrical energy as the main energy source. It was popular by electric motorized vehicle. By 2020 it is predicted that electric cars will be the main transportation model with 3.8 million new units used annually [1].
Battery plays an important role in the operation of electric cars. This demands a significant development in battery technology, especially on the energy distribution and battery life within a certain time range. One of the main factors is the balance of voltage values in the battery constituent cells. This study focuses on preventing problems from the effects of voltage imbalance on battery cells with instruments to perform voltage balancing.
The design of this instrument is adjusted to the battery module used.
The device made is a voltage balancer using the shunt resistor method on three battery cells connected in series. Each cell has a maximum voltage of 4.2 V. This tool is able to automatically control the balancing with the help of software and hardware. The battery voltage input is converted by Arduino, so the input voltage value is limited to a maximum of 3.3 V with the help of the sensor circuit. The voltage is discharged through the heat on the discharge resistor. The resistor used is a common resistor found in the market.
II.
Theorectical Review
In this research there are several theory work done to achieve the desired end result
II.1 Battery
converse electrical energy. A battery consists of one or more electrochemical cells. Although the terms battery and cell are often used interchangeably, cells are actually the components of a battery. A battery consists of one or more cells which are electronically arranged [6].
SOC: Battery energy utilization depends highly on the voltage value found on the battery. This voltage value describes the condition of the battery in the energy channel or better known as the state of charge (SOC). SOC describes the current state of the battery, whether it is empty (0%) or in full state (100%). The most common measurement method for SOC is coulomb counting [4] - [5].
Discharge Mode: The battery as an energy source has several modes to release energy according to its needs. Constant load is one of the discharge modes where the battery produces energy at a constant load, the current value out of the battery will decrease as the battery voltage decreases.
II.2 BMS
BMS is a tool used to monitor and control the battery system connected to the charger and the load (motor). BMS is equipped with sensors that can perform measurements such as currents, voltages, temperatures, etc. to know the condition of the battery to be controlled so that no errors in the operation and can lengthen the battery life [2]. One of the functions of BMS is to do cell balancing on the battery composing cells.
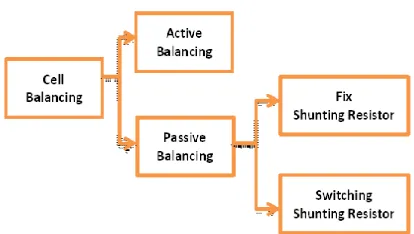
In general, cell balancing has 2 topologies, passive and active as shown in Figure 1 [6]. The passive cell balancing topology means that the voltage balancing on the battery cells accomplished by the energy dissipation of higher-voltage battery cells using resistors paired in parallel with the battery cell. While the active cell balancing balances the voltage by sending an excessive voltage to the cell with a lower voltage value using the inductor and capacitor.
Shunt Resistor: The shunt resistor method is the simplest method in balancing the voltage. Voltage balancing is done by removing the voltage from the battery cell which has a higher voltage through the resistor, until it reaches the same voltage value as the battery cell which previously had lower voltage values [6] - [7]. The energy dissipation itself is controlled using a switch as its controller. The voltage values are monitored using sensors. This value is used as a comparison of which switch to turn on to flow the current from a particular cell
Fig. 1 Cell Balancing Topology
III.
SYSTEM PLANNING
III.1 The system Block diagram
Figure 2 is the system block diagram of the tool being created. The sensor circuit reads the voltage from the battery, in this case is 3 battery outputs. The output of this sensor circuit is used as input for the Arduino.
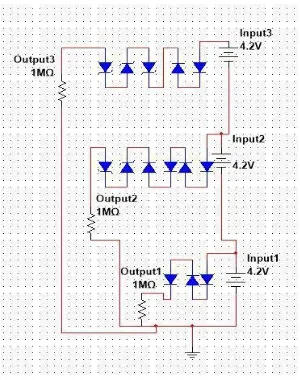
Figure 3. Sensor Circuit Schematic
1. Output 1
The network In order for the Arduino to function properly, it is necessary to set the input value, but with a small current value to prevent significant voltage loss from the battery. Therefore 1 MΩ resistor is used. The value of the flowing current is obtained by equation (1) that is 4.2 10−6. Then the
value of the lost voltage in the diode is obtained through equation (2) which is considered to be applied in the ideal state so that it becomes equation (3) that is 3.96515 10−1.
By using 3 diodes we get a readable voltage value on the Arduino of 3.01 so that the Arduino can function properly.
(1)
(2)
(3)
2. Output 2
Using the same calculation method with output 1, got the flowing current value that is 8.4 10−6. Then
by equation (3) got the value of voltage that is inhibited in diode when pairing in the circuit, that is equal to 4.14357 10−1. This value is too small and
will use too many diodes. Hence, zener diodes are used, where equation (4) the value of voltage is obstructed 2.64236. After using 4 diodes and 2 zener diodes, the voltage is 1,461.
(4)
3.Output 3
In accordance with the method of calculation
previously used, it obtains the flowing current
value of
1.26 10−5. Then by equation (3) it
obtained the value of the voltage that is
inhibited in the diode when pairing in the
circuit, that is equal to
4.25709 10−1. Similar to
output 2, the value of the lost voltage is too
small so that it uses too many diodes. The zener
diode is used, where equation (4) the voltage
value is obstructed 2.91245. In order for the
Arduino analog sensor to function, 3 diodes and
3 zener diodes are used, so the read voltage
value is 2.5855.
III.3 Shunt Circuit
To turn on the switch as needed, the voltage source setting at the MOSFET is required. In the application, the MOSFET requires a voltage input of 5 V so that the switch can live and flow current [8]. The arrangement is done by optocoupler, as the signal receiver from the software and drain the input voltage to the MOSFET as shown in Figure 4. The 5V MOSFET input voltage is sourced from the variable power supply. The optocoupler will adjust the input voltage so that it will only turn on the transistor after receiving the signal from the Arduino.
Figure 4. Shunt Circuit Schematic
III.4 Program
The program is used to convert analog values to digital values and manage the automation of the hardware. The input data are the voltage value of the 3 cells of the battery that is first reduced. Hence in this program required adjustment of voltage values so that in processing the data it can provide a factual picture of the original voltage of each battery cell. Algorithm 1 shows the data processing algorithm applied in Matlab 2013.
Algorithm 1 Algorithm of Voltage Dissipation
Require: Serial data of cells battery d(1), d(2), d(3)
1. time setting
2. while ending = 0
3. if time > clock then
4. determine voltage value of each battery cell
5. put battery cells in order
6. signaling shunt resistor to subtract 2 highest battery values representation of the value of each battery cell. The value is then compared and the result is a cell
The test was done by measuring the output of the sensor circuit to the input of each cell. The output of the sensor circuit was expected to be between 0 -
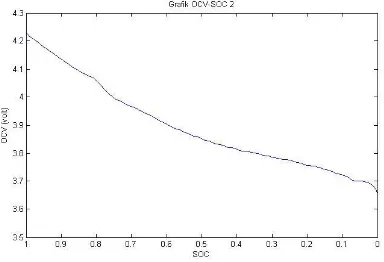
Figure 5. Graph of SOC to Voltage
The voltage values received by the resistors in the sensor circuit are converted to the digital form by the Arduino. This conversion is done from analog data to 10-bit digital data. The limit value of voltage acceptance from the Arduino, which is 3.3 volts, is divided by the number of bits used to see the accuracy of the image of the Arduino.
3.3⁄(210− 1) = 3.3⁄1023 = 0.003226
The battery used consists of three cells with the normal output cell rated at 2200 mAh each. It shows that by the output of 2.2 Ampere, SOC value of battery goes down from 100% to 0% in 1 hour. Therefore within 1 hour there is a decrease in the value of the cell voltage by 0.54 V. From here we can make a comparison with the current output as shown in Table 2
1.Output 1
Table 2 shows the current and power values that occur in the discharge resistors. By comparing it with the normal battery current output value, the value of the lost voltage with the value of the resistor used can be estimated.
At the resistor value of 18 Ω, with a current output of 0.2333 Ampere in accordance with the initial calculation, it can be calculated that the reduction of the voltage value from 100% SOC to 0% SOC with (5) obtained by the duration of 9.43 or 0.057
(5)
In the measurement for 6 hours, the voltage discharge measurement was done as shown in Figure 6
Figure 6. Voltage Value of Cell 1 for 18 Ω Resistance
The value of the lost voltage is 0.386 V or 0.0643 /. It shows that there is a difference with the initial calculation value, which is 0.0073 Volt / hour. With (5) it is known that the value of the flowing current is larger 0.0286 Ampere than the expected value. In the 36 Ω resistor, with the current output of 0.1167 Ampere of Table 2, it can be estimated that a reduction in the voltage value of 100% SOC to 0% SOC with (5) obtains a discharge time of 18.85 or 0.0286 /. The measurement result for 6 hours is shown in Figure 7.
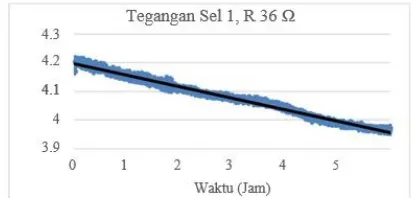
Figure 7. Voltage Value of Cell 1 for 36 Ω Resistance
The lost voltage value is 0.25 V from the battery for 6 hours or 0.04167 /, where there is a difference of 0.013 Volt / hour. By (5) it is known that the flowing current value in the circuit is 0.0531 Ampere larger than the expected value.
The use of resistor value 66 Ω shows the output current of 0.0636 Ampere. From that result, it can be estimated that the reduction of the voltage value from 100% SOC to 0% SOC with (5) obtained the time as long as 34.59 or 0.0156 /. In the measurements for 6 hours, the voltage discharge measurement was done as shown in Figure 8
Figure 8. Voltage Value of Cell 1 for 66 Ω Resistance
The value of the lost voltage in the experiment is 0.012 V or 0.02 /. From here there is a difference of 0.0036 Volt / hour from the initial calculation. From the equation, the value of the flowing current was larger 0.0179 Ampere than the expected value.
2.Output 2
In output 2, only 36 Ω and 66 Ω discharge resistors were used. This was due to the power that needs to be accommodated by the 18 Ω resistor, i.e. 3.92 watts too large for a common resistor on the market.
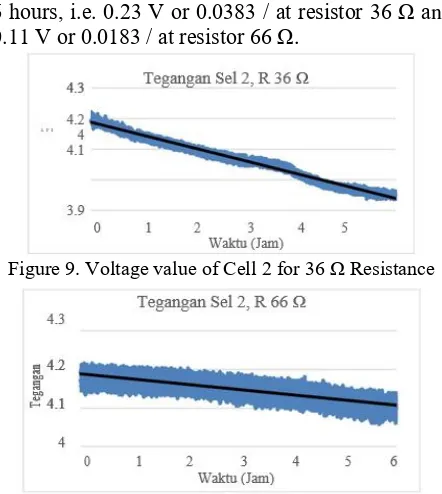
In the same way as output 1, at a resistance value of 36 Ω it can be estimated that a reduction in the voltage value from 100% SOC to 0% SOC for 18.85 or 0.057 / and at a resistance value of 66 Ω can be calculated to reduce the voltage value from 100% SOC to 0% SOC for 34.59 or 0.03122 /.
6 hours, i.e. 0.23 V or 0.0383 / at resistor 36 Ω and 0.11 V or 0.0183 / at resistor 66 Ω.
Figure 9. Voltage value of Cell 2 for 36 Ω Resistance
Figure 10. Voltage value of Cell 2 for 36 Ω Resistance
The results obtained are quite different from the calculation results. This is because when the current is removed from output 2, which should consist of two battery cells, the current only flows from one cell, at the top, so that the discarded voltage value is different. This is the effect of the series circuit used in the battery.
At the use of resistor 36 Ω, by (5), it obtains the flow current of 0.156, which should be 0.078. It shows the calculated value using a single battery cell as a voltage source indicating a value close to the ideal calculation value in Table 2 compared with the calculation using two battery cells as the voltage source. This result shows that the current flows only from one cell, although it is read as the output voltage value 2 is from the voltage value of two cells. Then it can be considered that output 2 will only discharge the voltage of cell 2.
The same phenomenon can also be found on the use of resistors 66 Ω, which the flowing current is 0.074, where in the initial calculation is 0.0372.
3. Output 3
Due to the capacity of the component power which was not too large, then at output 3 the discharge resistors of 66 Ω were only used. From that, it is estimated that the reduction of voltage values from full to empty occurs for 34.57 or at a rate of 0.047 /. The result of the reduction of the voltage values can be seen in Figure 11
Figure 11. Voltage value of Cell 3 for 66 Ω Resistance
The value of the lost voltage, i.e. of 0.11 V or 0.0183 The results obtained are quite different from the theoretical calculation, as occurs in output 2. This is because when the current is discharged from output 3, which should consist of three battery cells, the current only flows from one cell, at the top, so the discharged voltage values are different. This is the effect of the series circuit used in the battery.
The current flows by 0.0745, which should be 0.025. The above calculated current value shows the calculated value using a single battery cell as the voltage source indicates a value close to the ideal calculation value in Table 2 compared to the calculation using three battery cells as the voltage source. This shows the current flowing only from one cell, although when reading the output voltage value 3 is read as the voltage value of the three cells.
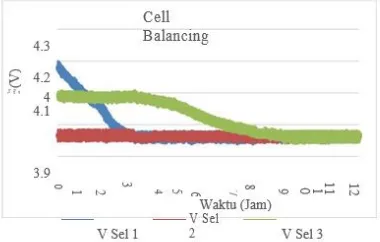
4.3 Cell Balancing
Cell balancing was done automatically. The value of the voltage received by the software became the reference in determining which switch to turn on, and how long the switch would turn on. Then the software sent a signal to turn on or off the switch.
Since the output voltage value 2 and output 3 are the sum of several cells, it is necessary to define the value of cell 2 and cell 3 of the battery. This definition is done on the programming in the software, due to the hardware itself, the discharge of voltage values has been done per cell.
Figure 12. Voltage Stabilization of 3 Cells
Cell balancing was done on cell 2 so the voltage value of cell 2 did not change significantly. Since the inner circuit of the battery did not allow for the passage of two cells at once, the discharge voltage had to be performed one by one by each cell. This sequence itself was done according to the program given in the software.
Figure 13. Changes of Voltage Value in Cell 1 When the Discharge Was Done
Figure 14. Changes in Cell Voltage Value 3 When Dumped
In cell 1, the discharge of the voltage was carried out at the beginning. The initial voltage value was 4,181 V. The discharge was carried out until the expected value was got, where the voltage of cell 1 decreased to 3,961 V at the discharge end. This is shown by Fig. 13. After reaching that value, cell 1
is stable and does not undergo significant voltage changes.
In cell 3, the discharge voltage was performed after cell 1 had finished performing the discharge. The initial voltage value of cell 3 was 4,095 V. The discharge was carried out until the expected value was got, where the voltage of cell 1 decreased to 3,973 V at the disposal end. This is shown by Fig 14. After reaching that value, the voltage value of cell 3 becomes constant.
V.
Conclusion
Based on the research that has been done, some conclusions can be drawn.
1. The shunt resistor topology that is implemented on the voltage balancer can be operated simply.
2. The application of shunt resistor topology causes an unused power discharge resulting in potential loss of power.
References
[1] B. C. Group, “Focus Batteries for Electric Cars.”
[2] J. Q. YevgenBarsukov, “Cell-Balancing
Techniques: Theory and Implementation 4.1,” in Battery Power Management for PortableDevices, 2013, pp. 111–138.
[3] “Baterai.” [Online]. Available:
https://id.wikipedia.org/wiki/Baterai. [Accessed: 15-Jun-2015].
[4] W.-Y. Chang, “The State of Charge Estimating Methods for Battery: A Review,” 2013.
[5] L. Lu, X. Han, J. Li, J. Hua dan M. Ouyang, “A
review on the key issues for lithium-ion battery
management in electric vehicles,” J.Power
Sources, vol. 226, pp. 272–288, 2013.
[6] M. Daowd, N. Omar, P. Van Den Bossche, and J. Van Mierlo, “Passive and active battery balancing comparison based on MATLAB simulation,” 2011 IEEE Veh. Power Propuls. Conf., pp.
1–7, Sep. 2011.
[7] M. Daowd, N. Omar, P. Van Den Bossche, and J. Van Mierlo, “A Review of Passive and Active
Battery Balancing based on
MATLAB/Simulink,” vol. xx, no. September, 2011.
[8] V. Siliconix, IRF540, SiHF540, no. V. 2012.
[9] B. A. Pramana, “ESTIMASI STATE OF
HEALTH (SOH) PADA BATERAI LITHIUM-POLYMER,” 2015.
Changes of Voltage in Cell 1
Time (Hour)
Changes of Voltage in Cell 3