Using Supply Chain Operation Reference Model and Failure
Mode and Effect Analysis to Measure Delivery Performance
of a Distribution System
(Case Study: Lotte Mart Indonesia)
*
Syarif Hidayat, Sita Ayu Astrellita
**Department of Industrial Engineering, Faculty of Science and Technology, University of Al Azhar Indonesia, Jl. Sisingamangaraja, Jakarta, 12110
**
penulis untuk korespondensi: [email protected]
Abstract This research was conducted to identify the supply chain model of PT. Lotte Mart Indonesia (LMI) and analyze the performance of its cross dock distribution system using the adjusted Supply Chain Operation Reference (SCOR) model. The products studied were the fastest moving drinks and dairy category. The first level of performance indicator for Reliability attribute is Perfect Order Fulfillment which has the second level of performance indicators are % of Orders Delivered in Full, and On Time Delivery. The supply chain performance for 3 months in 2012 was good at 74%. The second level mapping found errors in the deliver stock (D1) and deliver retail (D4) procedures. The third level mapping found 4 erroneous procedures in the stock-out goods, receiving inappropriate order, delayed and damaged goods, and a gap between ordered and received goods. Procedures were suggested to remedy these errors.
Keywords - supply chain performance, SCOR,
Fishbone diagram, FMEA
I. INTRODUCTION
he growth of retail business in Indonesia still show bright prospect in the future. Its growth ranging between 13-15% for 2011 [1]. In 2012, there were more than two million retail stores in Indonesia, from traditional shops to hypermarkets
* This paper has been presented and published in International Seminar on Science and Technology Innovations 2012, page 229-235
[2]. In a highly competitive business environment, companies are required to meet increasingly complex customer demands. To meet these demands, interrelated companies in a supply chain must work in synergy in a close supply chain management system (SCM). A company must have leading competitive advantage against similiar industry in order to seize the market share and profit.
The most important job in SCM is to control the physical flow. With high variation and the amount of customer demand, the company is required to be more responsive and to meet the needs efficiently. There are several strategies to response to the demand, from product planning level until the strategy that involves all the companies in the sypply chain. One of the strategies is cross docking. Cross docking is a good method to reduce inventory and increase customer satisfaction [3].
One of the companies that has implemented the SCM concept is PT. Lotte Mart Indonesia (LMI). LMI also has implemented cross docking strategy to meet with fluctuative customer demands and keep trying to increase the service. Currently LMI does not have a solid comprehensive performance measurement system. The performances are just measured functionally and the output without using the performance measurement system to control supply chain performance, so it is not known certainly whether the distribution system is effective or not.
Supply Chain Operation Reference Model (SCOR Model) is employed to measure the delivery performance of the company. Following the
background above, the research questions proposed
here is “how is the supply chain model at LMI
structured and what is the performance when
measured using SCOR approach?”
II. BASIC THEORY
2.1 Supply Chain Management
A supply chain is a network of companies that work together to create and deliver products to
end-user. The companies are supplier,
manufacturer, distributor, store or retail, and other company like logistic company [4].
Supply chain management is an approach in integrating various organizations that organize procurement or distribution, namely supplier, manufacturer, warehouse, and store so that the goods can be produced and distributed in the right quantity and location, on time, and minimize cost when satisfy the customer [5].
2.2 Cross Dock
A simple definition of cross-docking is as followings: receiving product from a supplier or manufacturer for several end destination and consolidating this product for common final delivery destinations [6]. The key to the process is trans-shipping. Equally important is the process of turning expensive delivery consignments into economic loads through consolidation and resource sharing. For many businesses it is essential to keep track of product consignments as they progress along the supply chain. The key
benefits of cross-docking techniques are
improvements in service levels, inventory levels, stocking returns and unit costs.
2.3 Supply Chain Operations Reference Model
(SCOR Model)
SCOR Model was developed by the Supply Chain Council (SCC). SCOR is a reference process model that incorporates the concepts in business process reengineering, benchmarking and process measurement [4]. There are five major supply chain processes, namely plans, make, source, deliver and return. SCOR model provides guidance on the types of metrics used to measure the performance of a company. Mapping stages in SCOR are divided into four levels, those are [7].
1. Level 1, defines the scope and content of the
SCOR Model. At this stage the performance targets for the company to compete are set.
2. Level 2, which i47s a continuation of the
analysis of level 1, the configuration stage of the supply chain processes that exist.
3. Level 3 continues the analysis of level 2, the
decomposition stage of the processes that exist in the supply chain into elements that define the company's ability to compete.
4. Level 4, the implementation phase of the
mapping programs as well as defining specific application behaviors to achieve competitive advantage and to adapt to changing business conditions.
2.4 Analytical Hierarchy Processing (AHP)
AHP is a multi-criteria decision-making approach [8].
The AHP is a decision support tool which can be used to solve complex decision problems [9]. It is a structured method to elicit preference opinion from decision makers. It uses a multi-level hierarchical structure of objectives, criteria, subcriteria, and alternatives. The pertinent data are derived by using a set of pairwise comparisons. These comparisons are used to obtain the weights of importance of the decision criteria, and the relative performance measures of the alternatives in terms of each individual decision criterion.
The AHP approach was developed in response to military contingency planning, scarce resources allocation, and the need for political participation in disarmament agreements [10]. All these problems rely heavily on measurement and tradeoff of intangibles in a multi-criteria process.
2.5 Fishbone diagram
The fishbone diagram analyse is a tool for
analyzing the business process and its
effectiveness. It is also commonly referred as
“Ishikawa Diagram” because it was invented and
incorporated by Kaoru Ishikawa, a Japanese quality control statistician [11]. It is defined as a fishbone because of its structural outlook and appearance. In normal stature it looks like a skeleton of a fish. The fishbone diagram and analysis typically evaluates the causes and sub-causes of one particular problem and therefore assists to uncover all the symptoms of
any business problem, hence the name “Cause
Figure 1 shows a typical Fishbone diagram. The effect is usually a problem needs to be resolved, and is placed at the "fish head". The causes of the effect are then laid out along the "bones", and classified into different types along the branches [12].
2.6 Failure Mode and Effect Analysis (FMEA)
FMEA is a widely used evaluation method for both the automobile industry and other organizations employing Six Sigma techniques and problem solving approaches [13]. Properly applied, an FMEA can be a useful tool in organizing and pinpointing areas of highest concern and then for focusing effort and documenting results. The basic steps are to identify the root process, list potential problems that could occur, rate the failure mode for severity, occurrence, and detectibility, and then derive a Risk Priority Number (RPN) which can direct design or improvement effort to the areas of greatest concern. Actions are then undertaken to reduce the risk presented by the failure mode.
III. RESEARCH METHODOLOGY
The study was conducted at PT. Lotte Mart Indonesia which was focused on the Distribution Center (DC), LMI Headquarter, and Lotte Mart Ratu Plaza branch that acted as a store. The study was conducted in March-April 2012. Figure 2 shows the research flowchart.
IV. RESULT AND DISCUSSION
The supply chain involving LMI is shown on Figure 3. It depicts the flow of goods from the suppliers to the Distribution Center (DC) as the response to the orders; and the continuing flow
from the DC to the requesting stores.
Figure 1. Typical Fishbone diagram
Figure 2. Research flowchart [14]
Figure 3. Flow of goods at LMI Solution
SCOR analysis Preliminary
Start
Preliminary study
Formulation of the problem
Mapping, calculating, and analyzing of first level of SCOR
Calculating, and analyzing of second level of SCOR
Calculating, and analyzing of third level of SCOR
Failure mode and effect analysis
Drafting a recommendation improvement
Conclusion
Finish
Information Flow
Head Office
Store 1
Store 2
Store n Supplier 1
Supplier 2
Supplier n
Distribution Center
Orders (n POs) Order (1 PO)
n Invoices n(internal) Invoices
4.1 Selection of Research Objects
The object of research in this study was the fastest moving products of PT. Nestle Indonesia. As the first step, the researchers accessed the Sales Database to review the total sales by category of products that used the cross dock facility. Figure 4 shows the result.
The chart shows that the greatest contribution of sales is given by category number 12, which is the dairy and drinks. For the second step, the researchers identified the vendors for this category. Figure 5 shows the result. There were 10 drinks and milk vendors who used the Cross Dock facility, and PT. Nestle Indonesia has the highest total sales.
4.2 SCOR Level 1 Performance Measurement
At LMI the main objectives of the business is defined as:
1. To provide the best level of services to the
customers
2. To increase corporate profits
The achievements of these objectives were measured using specific SCOR models, namely Reliability, Responsiveness, and Cost/Asset. The first objective could be measured by analyzing the value of two indicators, namely Reliability, and Responsiveness. The second objective could be measured by analyzing the value of two indicators, namely supply chain costs and asset management efficiency. Due to the limitations of data access only two indicators were measured, namely Reliability, and Responsiveness.
Supply chain management at LMI includes only 4 SCOR processes, i.e. plan, source, deliver, and return. As a retail company LMI does not have Make process. Figure 6 shows the first level map of SCOR concept.
The framework to measure the supply chain performance at LMI is shown in Figure 7.
Figure 4. The number of sales by product category [14]
Figure 5. Total sales in three month for top 10 vendors [14]
Figure 6. First level mapping [14]
Figure 7. framework of supply chain performance measurement SCOR-based system to LMI [14]
Merchandising Purchasing Warehouse Store Return
Plan Source Deliver Return
Supplier Customer
Supply Chain Performance Perfect Order
Fulfillment
Responsiveness Reliability
Order Fulfillment Cycle Time
Deliver Cycle Time Source Cycle
Table 1 shows the model to measure the LMI supply chain performance based on SCOR.
Table 1. Performance measurement model [14]
4.3 Determining the importance of the
performance using AHP approach.
Based on the description above, it is necessary to the existing weight values calculated by using pairwise comparison in AHP method and solved using Expert Choice software. 6 respondents (experts) involved are the Procurement Manager,
Senior Merchandise Manager, Business/Data
Analyst, Supply Chain & Logistics Manager, Store General Manager at Lotte Mart Ratu Plaza, and Section Head of Goods Receiving at Lotte Mart Ratu Plaza.
The inputs from the respondents are shown in Table 2 (comparing Reliability and Responsiveness) and Table 3 (% Order-in-full and On-time delivery).
Table 4 shows the result when running the inputs using Expert Choice software. It shows that
On-time delivery ranks the highest while
Responsiveness came second.
Tables 5 and 6 shows the supply chain performance of goods delivered by the supplier to the DC, and from the DC to the store. At 76%-77% the supplier performance looks better than the distribution center (DC) by the standard of [15]. However, LMI is still not satisfied with this performance. Therefore the study was continued with the analysis on the SCOR level 2 which are mapped in more detail at the ongoing process from supplier to store.
Table 2. Pairwise comparison matrix from 6 respondents on Reliability and Responsiveness
Table 3. Pairwise comparison matrix from 6 respondents on % Order in full and On-time delivery
Table 4. End result using Expert Choice
Table 5. Supplier-DC Performance
Table 6. DC-Stores Performance
No Adjustment need to be done
Indicator for
delivered in full PT LMI = SCOR Delivery
Delivery performance indicator to customer commit date is named On-time delivery
Document accuracy
For above 2 indicators, only accurate documents are counted. Perfect
condition
For above 2 indicators, only goods in good conditions are counted. Damaged and substandard goods Source
cycle-PT LMI is not a manufacturing coy, so it does not have "make" indicator
Responden 1 1 1
Responden 2 1 3
Responden 3 1 0,33
Responden 4 1 1
Responden 5 1 0,2
Responden 6 1 1
Responden 1 1 1
Responden 2 0,33 1
Responden 3 3 1
Responden 4 1 1
Responden 5 5 1
Responden 6 1 1
Responsiveness Reliability
Responden % Order in
Full
On Time Delivery
Responden 1 1 1
Responden 2 1 0,2 Responden 3 1 0,14 Responden 4 1 0,2
Responden 5 1 3
Responden 6 1 1
Responden 1 1 1
Responden 2 5 1
Responden 3 7 1
Responden 4 5 1
Responden 5 0,33 1
Responden 6 1 1
On Time
4.4 SCOR level 2
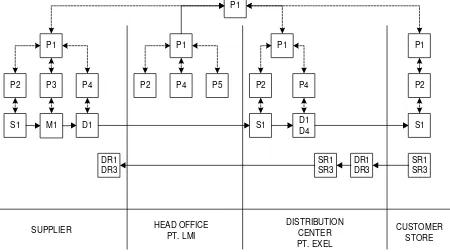
Figure 8 is the mapping diagram (thread diagram) to show the flow of material and information from suppliers to consumers.This mapping is also used to analyze the activities that are not well-connected (disconnect analysis), that makes the supply-chain performance bad.
From mapping above, it appears that the flow of information from DR1 and DR2 (Delivery Return) to the D1 and D4 (Delivery), and SR1 and SR2 (Source Return) to the S1 and S2 (Source) is connected so that it can happen that the delivery of goods should be returned but in the absence of information submitted, the goods are re-spins in the material flow so that goods can only move but do not generate revenue. Here is a proposed mapping of level 2. Figure 9 shows the suggested revision to the activity flow.
From the level 2 proposed mapping above, it is expected that the new information flow can decrease the cost of outdated items by proper treatment to goods which origin from the process of return by putting the plan of returns.
Figure 8. Second level mapping (as is)
Figure 9. Second level mapping (suggested)
4.5 SCOR Level 3 product (D1) and deliver retail product (D4). After level 3 mapping is done, then the authors conducted interviews with experts on the processes that are risky. 4 processes were identified as problematic:
a. problems that arise out of stock items from
inventory and ordering process of determining the date of delivery (D1.3)
b. issues of not delivered the goods in accordance
with existing orders in the document that emerged from the entry of goods into the delivery vehicle and expenditure documentation (D1.11)
c. delay in the arrival time of goods and the
damaged of goods packaging arising from the delivery of goods issues (D1.12)
d. problem of the gap between ordered goods,
delivered goods, and availability of stocks listed on the system arising from acceptance and verification of goods in stores (D4.2).
When the processes that are problematic have been
identified, the researchers then conducted
interviews with the store managers at LMI to elaborate on the details.
4.6 Fishbone Diagram Analysis
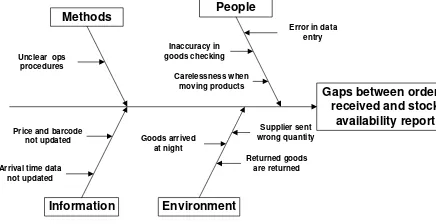
From the interviews with LMI people the authors drew 4 fishbone diagrams, shown in Figures 10, 11, 12 and 13. The diagrams are for the following processes: Reserve inventory and determine delivery date; Load products to vehicle & generate shipping documents; Product shipping, and Goods receiving and verification.
4.7 Failure Mode and Effect Analysis (FMEA)
The fishbone diagrams in chapter 4.6 were further analyzed using FMEA. With FMEA the authors obtained the largest Risk Priority Number (RPN) then formulated a solution to the LMI. The authors took the largest three of the causes of the problem potentials. This is shown in Table 7.
Figure 10. Fishbone diagram on reserve inventory & delivery date
Figure 11. Fishbone diagram on load product and generate shipping documents
Figure 12. Fishbone diagram on product shipping
Figure 13. Fishbone diagram on goods receiving and verification at the warehouse
Table 7. Priority of potential causes of failure
Obviously the highest risk of failure came from the process of goods receiving, as has been indicated beforehand.
V. CONCLUSION
Based on research that has been done, it can be concluded, among others:
1. From the results of performance measurement
for 3 months (January, February, March 2012), based on the developed SRP performance measurement models, the average performance of DC for 3 months was 72-74%, which by Volby (2000), which falls into the category of
good performance (between 70%-90%).
However, LMI is still not satisfied with this performance, therefore the research was continued to lower SCOR level.
2. In the second level of analysis, the problems
are the deliver stock product (D1) and deliver retail product (D4), then performed the analysis of SCOR level 3, and obtained 4 problematic delivery documentation (D1.11)
c. Delayed arrived goods and damaged arrived
goods appeared from the delivery process (D1.12) and
d. The gap between ordered and arrived goods
and availability stock which licted on the system appeared from the acceptance and goods verification at store (D4.2).
Appreciation
The authors would like to appreciate the Lembaga Penelitian dan Pengembangan Manajemen (LP2M) of the University Al Azhar Indonesia (UAI) for providing the funds to support this research.
Out-of-stock
Urgent order due to urgent demand
Goods sent not according to order
and documents People
Methods
Information Environment
Error when loading into trucks Error in product
consolidation
Dark when loading into trucks Insufficient
document Error in shipdocs
generation No procedure to
calculate shortest distance
Gaps between orders received and stock availability report Price and barcode
not updated Arrival time data
not updated
Receipt back the return goods 336 There is no clear operational procedures 320 The lack of clear information concerning the return goods 315
REFERENCES
[1] Setrawati, N. 2011. Persaingan Ritel Asing dan Lokal 'Memanas' di 2011, http://finance.detik.com (diakses pada 19/02/2012 pukul 13:00 WIB) [2] Joewono, H. 2010. Memenangkan Persaingan
Bisnis Ritel, http://adinfopluit.blogspot.com /2010/ 08/memenangkan-persaingan-di-bisnis-ritel.html (diakses pada 19/02/2012 pukul 12:50 WIB) [3] Chopra, S., and Miendl, P. 2001. Supply chain
management: strategy, planning and operations. London: Prantice hall
[4] Pujawan, I N. 2005. Supply Chain Management. Guna Widya.
[5] Simchi-Levi, David dan Kamisnky. 2004. Managing the Supply Chain: The Definitive Guide for the Biusiness Professional, McGraw-Hill. [6] Bin, J. 2006. Cross-Docking. Dissertation.
Department of Informatics and Mathematical Modeling. Denmark Technical University. Kopenhagen
[7] Hidayat, S., Astrellita, S.A. 2012. Performance Measurement of Distribution System at PT. Lotte Mart Indonesia Using Supply Chain Operation Reference Model (SCOR). ISSTIN Proceedings. International Seminar On Science And Technology Innovation 2012 (ISSTIN-2012).
[8] Saaty, T.L. 2008. Decision making with the analytic hierarchy process. Int. J. Services Sciences, Vol. 1, No. 1, pp 83-98.
[9] Triantaphyllou, E., and Mann, S.H.. 1995. Using the Analytic Hierarchy Process for Decision Making In Engineering Applications: Some Challenges. Inter’l Journal of Industrial Engineering: Applications and Practice, Vol. 2, No. 1, pp. 35-44.
[10] Yanga, J, and Shia, P. 2002. Applying Analytic Hierarchy Process in Firm's Overall Performance Evaluation: A Case Study in China. International Journal Of Business, 7(1), 2002
[11] Bose, T.K. 2012. Application of Fishbone Analysis for Evaluating Supply Chain and Business Process-A Case Study On The St James Hospital. International Journal of Managing Value and Supply Chains (IJMVSC) Vol. 3, No. 2 pp 17-24 [12] [MSI] Management Systems Incorporated. 2006.
Ishikawa (Fishbone/Cause-and-Effect) diagram. Management Systems Incorporated.
[13] Crites, J.W. and Kittinger, S.W. 2009. Use of Failure Modes and Effects Analysis (FMEA) Methodology in Evaluation of Process Transfer of Ohmic Liftoff from Low-Pressure-Solvent to High-Pressure-NMP Liftoff. CS MANTECH Conference.
[14] Astrellita, S.A. 2012. Pengukuran Kinerja Sistem Distribusi Pada PT. Lotte Mart Indonesia Menggunakan Supply Chain Operation Reference Model (SCOR Model). Tugas Akhir, Prodi Teknik Industri Universitas Al Azhar Indonesia. Jakarta. [15] Volby, H. 2000. Performance Measurement and
ATTACHMENT
Attachment 1. Third level mapping
D1.1
(Purchase order) Delivery date Inventory
Plan and build load information
- Item stocking requirements - Inventory in stock - Inventory availability
Load retail cart or pallet
- Loaded retail cart or pallet
- Full shelf locations - Store shelf inventory
counts
- Product data - Full shelf location
- Customer data - Promotional plan
Cart ready for check out
- Cart ready for checkout - Customer profile/data - Promotion event/product
calender
- Point of sale data - Satisfied customer - Loyalty customer profile
change - Customer loyalty/ Revisit INPUT
![Figure 2. Research flowchart [14]](https://thumb-ap.123doks.com/thumbv2/123dok/2725451.1676985/3.595.322.535.255.537/figure-research-flowchart.webp)
![Figure 4. The number of sales by product category [14]](https://thumb-ap.123doks.com/thumbv2/123dok/2725451.1676985/4.595.316.537.73.181/figure-number-sales-product-category.webp)