1 Balai Pengkajian Bioteknologi, BPPT, Gedung 630, Kawasan Puspiptek, Serpong, Tangerang 15314, Telepon : 021 – 75872033, Fax : 021 – 75872033,
E-mail : [email protected]
Analysis of Quantitative Trait Loci for Protein Content in Soybean Seeds using Recombinant Inbred Lines
Teuku Tajuddin1
Received 16 October 2004/Accepted 30 March 2005
ABSTRACT
Protein content in the seed is quantitatively inherited and controlled by polygene. The quality of seed protein content has been studied extensively, however, information on its quantity is still limited. In order to analyze the genetic basis of these traits, recombinant inbred lines (RILs) derived from a cross between Glycine max (L.) Merrill variety Misuzudaizu and variety Moshidou Gong 503 were planted in two environments and evaluated for seed protein content. The broad sense heritability of the traits ranged from 0.74 to 0.79 in our RIL population. Single-factor analysis of variance, interval mapping and composite interval mapping were used to detect significant associations between traits and genetic markers. A total of 10 QTLs, which were significant in at least one environment were identified. Each QTL explained the total phenotypic variation for protein content in the range from 3.4% to 29.7%. Among all the detected QTLs, three of them were detected in both environments. QTLs identified in this study were mapped in the soybean linkage map. The results obtained in our study may serve as a base for analyzing the genetic control of protein content and may eventually enable to change the seed constituents.
Key words: Glycine max (L.) Merrill, quantitative trait loci, protein, recombinant inbred lines.
INTRODUCTION
Most soybean traits of economic importance including seed yield, plant maturity, lodging resistance, seed size, seed protein and oil content are quantitatively inherited. These traits are controlled by few to many genes and may be strongly influenced by environment. Moreover, quantitatively inherited traits of soybean are controlled by genes with additive genetic effects. That is, the many individual gene that control the expression of these traits each have small effects that combinein an additive fashion to control the level of expression of a trait. Since soybean cultivars are true-breeding inbred lines, these additive effects can be fixed and maintained during the development of inbred lines.
Restriction fragment length polymorphisms
(RFLP) have been mapped to specific sites on all soybean chromosomes. These RFLPs are used as reference points to map identified genes on individual chromosomes. In addition, the RFLPs are used to locate multiple sites on chromosomes that are associated with the expression of quantitatively inherited traits. Knowing the number and locations of sites controlling the expression of specific traits of soybean increases the
efficiency of breeding for these traits.
The loci controlling quantitative traits are commonly referred to as quantitative trait loci (QTL). The QTL analysis has a potential to resolve quantitative traits into individual genetic components. Recombinant inbred lines (RIL) is a suitable population designed for studying QTL analysis, since it is genetically homozygous, stable and can be reproduced identically.
A RIL population is generated from F2 plants by self
pollination and advanced to the next generations using the single seed descent approach.
The genes encoding each of the major subunit types of soybean seed storage protein, glycinin and β-conglycinin, have been isolated and characterized (Nielsen, 1996). Moreover, mutant lines which can be used as breeding materials and research tools for studying the regulation of the subunit composition of glycinin and β-conglycinin, have been identified (Nielsen, 1996). Molecular markers have been used for mapping the genes controlling the seed protein
content in soybean. Diers et al. (1992) studied the
soybean seed protein content in a population of
F2-derived lines developed in crosses between G. max
groups. Based on these findings, some successful attempts have been made to improve the protein composition in soybean seeds. Nevertheless, the information about the genetic control of the protein content in soybean seeds is limited.
The improvement in seed composition means increasing the quantity and quality of protein percentages in the seed. Seed protein is composed of essential amino acids, such as lysine, tryptophan, methionine, cystine, etc. To improve the seed protein is largely a matter of changing the amino acid composition. Phosphoenolpyruvate carboxylase (PEPCase) catalyzes the carboxylation of phosphoenolpyruvate to oxalacetic acid which increases the number of carbon skeletons of amino acids. It was reported that the PEPCase activity of soybean seeds is positively correlated with the seed
protein content in seeds (Sugimoto et al., 1989). A
better understanding of the genetic and regulatory functions of PEPCase in the control of the relative amounts of proteins in seeds may enable to manipulate these constituents.
In the present study, QTL mapping analysis is conducted for the purpose of locating genes responsible for protein content in soybean, as a starting point for use
of marker-assisted selection in soybean plant
improvement.
MATERIAL AND METHODS Phenotypic Evaluation of Seed Composition
A population of recombinant inbred lines (RILs) was derived from a cross between two contrasting
phenotypes of Glycine max (L.) Merrill for protein
content in the seed. Misuzudaizu was a low-content variety, while Moshidou Gong 503 was a high-content
variety for the constituents. A total of 156 RILs F8
generation of selfing were planted in the field of Matsudo campus, Chiba University, Japan, during the summer of 1998 (Matsudo trial). In the following year (summer 1999), approximately 15 seeds from each line were collected and planted in the field of Kashiwa farm (about 10 km northeast of Matsudo campus, assigned as Kashiwa trial).
Ten seeds from each line were collected randomly for protein content measurements. The protein content in the seed was determined by Biuret method (Layne, 1957). The seed was crushed into fine powder, dried in
the 100oC oven for one hour, and followed by keeping in
the dessicator for one hour before weighing on the 0.1-mg scale balance as an initial seed weight.
The seed powder was then put in a 30-ml tube (Yasui Kikai) containing an iron bead. After adding 0.5 ml chloroform and 20 ml Biuret solution (in 1 l
Biuret solution contains 10 ml 10N KOH, 20 ml 25%
KNaC4H4O6.4H2O and 40 ml 4% CuSO4), the seed
powder was shaken in the Multi-Beads Shocker (Yasui Kikai) at 2,500 rpm for 30 seconds. Then the mixture was transferred into a 50-ml Falcon tube. After keeping for an hour at room temperature, the mixture was centrifuged at 6,000 rpm for 15 minutes, followed by transferring the upper phase into the fresh Falcon tube. Finally, the optical density of the solution was measured by the spectrophotometer (Beckman DU650) at 540 nm. The albumin bovine (Sigma) was used as a control standard. The protein content was expressed as the percentages of the 100 mg ground-seed weight.
PEPCase Clone Association on the Linkage Map
The cDNA of rice PEPCase clone, osppcr, was supplied by Dr. T. Sugimoto, Kobe University. The clones were hybridized to genomic DNA by the same
procedures as those described previously (Yamanaka et
al., 2000) to detect RFLP. The oligonucleotide primer
pairs for amplification of the PEPCase gene were obtained from the sequences information of a conserved
region published by Sugimoto et al. (1992). The
primers were
5’-GTCATCATTATTTGCGGGGCTGTG-3’ (forward)
and 5’-TCCACTAGGCTTTCTCTTTGCTGG-3’
(reverse). Cycle of denaturation at 95oC for 30 seconds,
primer annealing at 62oC for 2 min, and extension by
Ex-Taq (TaKaRa) at 72oC for 1 min were repeated for a
total of 25 cycles. The products of PCR were then
cleaved with the restriction enzymes AluI, AsuI, AvaII,
BamHI, BglII, BsmI, BsuRI, DdeI, DraI, EcoRI, EcoRV,
HaeIII, HhaI, Hin6I, HindIII, HinfI, HpaII, MboII, MspI,
MvaI, RsaI, ScrFI, TasI, TaqI, XbaI and XhoI to produce
cleaved amplified polymorphic sequences.
From the F2 linkage map (Yamanaka et al., 2001),
which was derived from the same cross combination as the RILs in this study, RFLP and SSR markers were selected to be evenly distributed to all the linkage groups. The genotypes of these markers were scored against 156
progenies of F8 generation to construct a RIL linkage
map (Tajuddin, 2004). The linkage map was
constructed by using the computer program
MAPMAKER/EXP 3.0 (Lincoln et al., 1993) at a
minimum given log of likelihood (LOD)-value of 3.0 as the threshold to assign RFLP (markers indicated by Axxx, GMxxx, Qxxx), SSR (indicated by Sattxxx) and AFLP (GmPepc7) loci to linkage groups.
Seed Protein Content’s QTL Analysis
(Lander and Botstein, 1989) and composite interval mapping (Zeng, 1993). Both interval mapping and composite interval mapping methods were applied using
QTL Cartographer version 1.15 (Basten et al., 2001).
A minimum LOD-value of 2.0 was chosen to confirm the presence of a QTL in a given genomic region. The LOD-value peak was used to estimate the most likely QTL position on the RFLP linkage map.
RESULTS AND DISCUSSION Seed Protein Content in RIL Population
Seed protein content in the Matsudo and Kashiwa trials were distributed continuously (Fig. 1), indicating that the trait were quantitative traits. The frequency distribution of the trait in the Matsudo and Kashiwa trials fitted to a normal distribution (p<0.05) when tested with
goodness of fit (Gomez and Gomez, 1984).
Transgressive segregants for the protein content were only observed for a higher value in either environment.
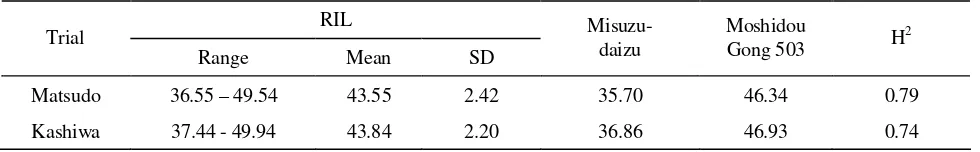
Range, mean, standard deviation and parental values for protein content determined in the Matsudo and Kashiwa trials are presented in Table 1. The two parental lines were significantly different (p<0.001) for the constituent in both environments. Protein content was higher in Moshidou Gong 503 than in Misuzudaizu. Protein content in the RIL population ranged from 36.55% to 49.54% in the Matsudo trial and from 37.44% to 49.94% in the Kashiwa trial. The mean protein contents for the Matsudo and Kashiwa trials were 43.55% and 43.84%, respectively. The content of protein was highly heritable, with broad-sense heritability for the protein content being 0.79 in the Matsudo trial, and 0.74 in the Kashiwa trial.
Figure 1. Frequency distribution of the percentage of seed protein content in a soybean RIL population derived from a cross between Misuzudaizu and Moshidou Gong 503 in the Matsudo (black bar) and Kashiwa (white bar) trials. Mean seed protein content of both parents (Mis: Misuzudaizu and Mos: Moshidou Gong 503) are indicated in the figure with arrows.
Table 1. Ranges and means of RIL population and parental values for the percentage of seed protein content and their heritability in the broad sense
RIL Trial
Range Mean SD
Misuzu- daizu
Moshidou
Gong 503 H
2
Matsudo 36.55 – 49.54 43.55 2.42 35.70 46.34 0.79
Kashiwa 37.44 - 49.94 43.84 2.20 36.86 46.93 0.74
Mos
Mis
Protein content (%)
Nu
mb
er
of
l
in
es
35 36 37 38 39 40 41 42 43 44 45 45 47 48 49 45
40
35
30
25
20
15
10
5
QTLs Identification
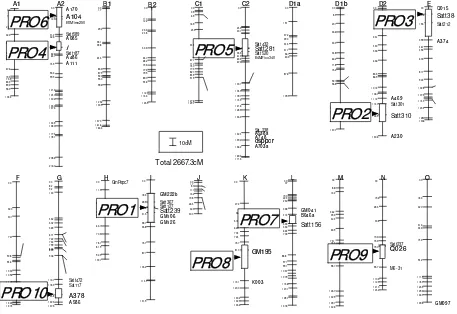
Detection and localization of QTLs for the protein content using single-factor ANOVA and interval mapping identified 5 QTLs that were significant in at least one environment. Detection using composite interval mapping confirmed the presence of these QTLs. They were located near the markers Satt239 on linkage
group I (designated as PRO1), Satt310 on linkage group
D2 (PRO2), Satt384 on linkage group E (PRO3), I on
linkage group A2 (PRO4), and Satt281 on linkage group
C2 (PRO5) (Fig. 2). The proportion of phenotypic
variation explained by individual QTLs for protein ranged from 3.4% to 29.7% (Table 2). Furthermore, the presence of five additional seed protein QTLs was detected, which were significant in one environment
only. They consisted of PRO6 and PRO7 which were
identified in the Matsudo trial and were located near the markers A104 on linkage group A2 and Satt156 on
linkage group L, respectively (Fig. 2). Likewise PRO8,
PRO9 and PRO10 found in the Kashiwa trial were
located near the markers GM195 on linkage group K, Q026 on linkage group N and A378 on linkage group G,
respectively (Fig. 2). Individual QTLs explained the significantly associated with the protein content based on
composite interval mapping. Many scientists used
composite interval mapping nowadays to detect the QTL, since this method more accurate and as a combination of interval mapping and multiple regression (Zeng, 1993).
Among the QTLs for the protein content, only three
QTLs, PRO1 on linkage group I, PRO2 on linkage group
D2 and PRO3 on linkage group E showed a strong
association in both Matsudo and Kashiwa trials (Table 2
and Fig. 2). The PRO1 accounted for the largest
phenotypic variation, i.e. more than 20% and the additive effect of Moshidou Gong 503 in contrast to the Misuzudaizu alleles was 1.11 and 1.22% in the Matsudo and Kashiwa trials, respectively (Table 2).
A1 A2 B1 B2 C1 C2 D1a D1b D2 E
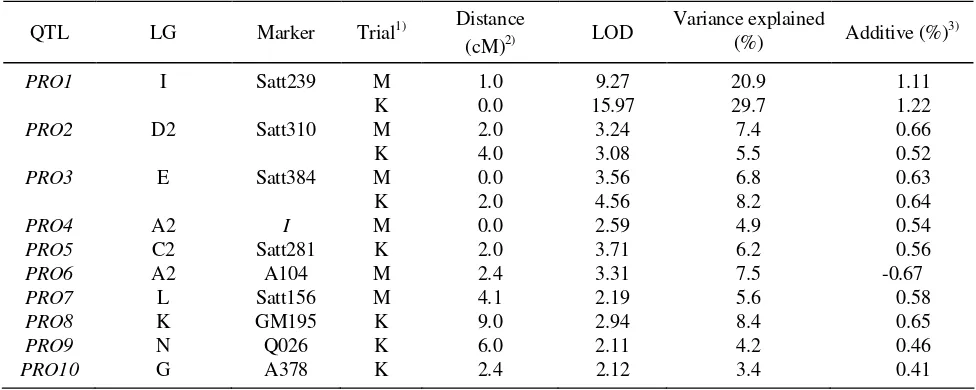
Table 2. QTLs for protein content identified based on composite interval mapping
QTL LG Marker Trial1) Distance
(cM)2) LOD
Variance explained
(%) Additive (%)
3)
PRO1 I Satt239 M 1.0 9.27 20.9 1.11
K 0.0 15.97 29.7 1.22
PRO2 D2 Satt310 M 2.0 3.24 7.4 0.66
K 4.0 3.08 5.5 0.52
PRO3 E Satt384 M 0.0 3.56 6.8 0.63
K 2.0 4.56 8.2 0.64
PRO4 A2 I M 0.0 2.59 4.9 0.54
PRO5 C2 Satt281 K 2.0 3.71 6.2 0.56
PRO6 A2 A104 M 2.4 3.31 7.5 -0.67
PRO7 L Satt156 M 4.1 2.19 5.6 0.58
PRO8 K GM195 K 9.0 2.94 8.4 0.65
PRO9 N Q026 K 6.0 2.11 4.2 0.46
PRO10 G A378 K 2.4 2.12 3.4 0.41
1)
The environments in which QTLs were detected are indicated (M: Matsudo trial in 1998; K: Kashiwa trial in 1999).
2)
Distance to the nearest marker.
3)
Moshidou Gong 503 effect in contrast to Misuzudaizu.
Loci of PEPCase Identification
The rice cDNA clone (osppcr) which was hybridized to the soybean genomic DNA blots and
polymorphic loci was mapped using EcoRV enzyme.
The osppcr locus was located at a distance of 7.1cM from A748 on C2.
Using the Southern hybridization method, a soybean PEPCase clone (GmPepc7) had been mapped
on linkage group H using the F2 population (Yamanaka
et al., 2001). Since the PEPCase genes in soybean display a high homology in their coding region to each
other (Hata et al., 1998), the PEPCase clone obtained
may occur at multiple loci in the genetic map. In this study, attempts were made to map the soybean PEPCase clone using the cleaved amplified polymorphic sequence method. Among all the tested restriction enzymes, the
use of AvaII, BsuRI and RsaI resulted in the production
of polymorphic bands. All of these three enzymes produced identical genotypes in RILs. The mapping results showed that the PEPCase clone in this study was located at a single locus that was the same as that
previously mapped on linkage group H by Yamanaka et
al. (2001). However, the PEPCase locus was not
associated with either trait in the present study. It appears that the primers used to obtain the PEPCase clone corresponded to GmPepc7.
Comparison of the mapping results for the protein content in this study with the results reported previously showed some agreement. Out of 10 QTLs detected in this study, two were located in similar regions to those in other studies.
The marker Satt239 on linkage group I was
strongly associated with the protein content (PRO1).
Brummer et al. (1997) who studied eight intraspecific
soybean populations over three years identified the marker A144 on the same linkage group that showed a high correlation with the protein content, with 27.5% of the variance explained for the 3-year average. Marker A144 was located at a distance of 2.7cM from Satt239 on the USDA/Iowa St. Univ. map and between Satt127
and Satt239 (Cregan et al., 1999). Moreover, Sebolt et
al. (2000) observed that the marker Satt239 was
significantly associated with the protein concentration, seed yield, maturity date, and plant height in backcross
populations with introgressed G. soja QTL alleles into
the G. max background. Still in the same region, Diers
et al. (1992) located QTLs for protein, oil and seed yield
and suggested that this region may be specific to G. soja.
Additionally, Diers et al. (1992) detected QTLs for
the protein and oil contents on linkage group E (previously A in the USDA/Iowa St. Univ. map) in the
same region as that of PRO3 in this study.
CONCLUSION
Acknowledgments. The author thanks Dr. N. Yamanaka, Japan International Research Center for Agricultural Sciences (JIRCAS), for supporting this work during my stay as visiting scientist in Japan, thanks are also due to Dr. T. Sugimoto, Kobe University, Japan, for providing the rice PEPCase cDNA, and Dr. S. Watanabe, Chiba University, for his valuable suggestion and collaboration.
REFERENCES
Basten, C.J., B.S. Weir, Z.-B. Zeng. 2001. QTL Cartographer, Version 1.15. Department of Statistics, North Carolina State University, Raleigh, USA.
Brummer, E.C., G.L. Graef, J. Orf, J.R. Wilcox, R.C. Shoemaker. 1997. Mapping QTL for seed protein and oil content in eight soybean populations. Crop Sci. 37: 370-378.
Cregan, P.B., T. Jarvik, A.L.Bush, R.C.Shoemaker, K.G. Lark, A.L. Kahler, N. Kaya, T.T. Vantoai, D.G. Lohnes, J. Chung, J.E. Specht. 1999. An integrated genetic linkage map of the soybean genome. Crop Sci. 39: 1464-1490.
Diers, B.W., P. Keim, W.R. Fehr, R.C. Shoemaker. 1992. RFLP analysis of soybean seed protein and oil content. Theor. Appl. Genet. 83: 608-612.
Gomez, K.A., A.A. Gomez. 1984. Statistical Procedures for Agricultural Research. John Wiley & Sons, Inc. New York. 680 p.
Hata, S., K. Izui, H. Kouchi. 1998. Expression of a soybean nodule-enhanced phosphoenolpyruvate carboxylase gene that shows striking similarity to another gene for a house-keeping isoform. Plant J. 13: 267-273.
Lander, E.S., D. Botstein. 1989. Mapping mendelian factors underlying quantitative traits using RFLP linkage maps. Genetics 121: 185-199.
Layne, E. 1957. Spectrophotometric, turbidimetric methods for measuring proteins. Methods in Enzymology 3: 447.
Lincoln, S.E., M.J. Daly, E.S. Lander. 1993.
MAPMAKER/EXP. Whitehead Institute of
Biomedical Research, Cambridge, Massachusetts.
Nielsen, N.C. 1996. Soybean seed composition. In:
Verma, D.P.S., R.C. Shoemaker (eds). Soybean: Genetics, Molecular Biology and Biotechnology, CAB International, Oxon, UK. p. 127-163.
Sebolt, A.M., R.C. Shoemaker, B.W. Diers. 2000. Analysis of quantitative trait locus allele from wild soybean that increases seed protein concentration in soybean. Crop Sci. 40: 1438-1444.
Sugimoto, T., K. Tanaka, M. Monma, Y. Kawamura, K. Saio. 1989. Phosphoenolpyruvate carboxylase level in soybean seed highly correlates to its contents of protein and lipid. Agric. Biol. Chem. 53: 885-887.
Sugimoto, T., T. Kawasaki, T. Kato, R.F. Whittier, D. Shibata, Y. Kawamura. 1992. cDNA sequence and expression of phosphoenolpyruvate carboxylase gene from soybean. Plant Mol. Biol. 20: 743-747.
Tajuddin, T. 2004. Mengkonstruksi peta genetika pada
tanaman kedelei (Glycine max (L.) Merrill) dengan
menggunakan populasi galur inbred rekombinan. J. Biosains dan Biotek. Indon. 3: 34-39.
Yamanaka, N., Y. Nagamura, Y. Tsubokura, K. Yamamoto, R. Takahashi, H. Kouchi, M. Yano, T. Sasaki, K. Harada. 2000. Quantitative trait locus analysis of flowering time in soybean using a RFLP linkage map. Breed. Sci. 50: 109-115.
Yamanaka, N., S. Ninomiya, M. Hoshi, Y. Tsubokura, M. Yano, Y. Nagamura, T. Sasaki, K. Harada. 2001. An informative linkage map of soybean reveals QTLs for flowering time, leaflet morphology and region of segregation distortion. DNA Res. 8: 61-72.
Zeng, Z.-B. 1993. Theoretical basis for separation of
multiple linked gene effects in mapping