Contents lists available atScienceDirect
The International Journal of Biochemistry
& Cell Biology
j o u r n a l h o m e p a g e :w w w . e l s e v i e r . c o m / l o c a t e / b i o c e l
Plasma membrane associated membranes (PAM) from Jurkat cells
contain STIM1 protein
Is PAM involved in the capacitative calcium entry?
Katarzyna Kozieł
a,b,1, Magdalena Lebiedzinska
a,1, Gyorgy Szabadkai
c,e, Marta Onopiuk
a,
Wojciech Brutkowski
a, Katarzyna Wierzbicka
a, Grzegorz Wilczy ´nski
a, Paolo Pinton
d,
Jerzy Duszy ´nski
a, Krzysztof Zabłocki
a, Mariusz R. Wieckowski
a,∗aDepartment of Biochemistry, Nencki Institute of Experimental Biology, Polish Academy of Sciences, Pasteur Street 3, 02-093 Warsaw, Poland bDepartment of Biophysics, Warsaw University of life Science SGGW, Warsaw, Poland
cINSERM U 807, Necker Faculty, Paris V University, 75015 Paris, France
dUniversity of Ferrara, Department of Experimental and Diagnostic Medicine, Ferrara, Italy
eDepartment of Cell and Developmental Biology, Mitochondrial Biology Group, University College London, London, United Kingdom
a r t i c l e
i n f o
Article history:
Received 17 May 2009
Received in revised form 9 July 2009 Accepted 11 July 2009
Available online 19 July 2009
Keywords:
Plasma membrane associated membranes Capacitative calcium entry
STIM1
Calcium homeostasis
a b s t r a c t
A proper cooperation between the plasma membrane, the endoplasmic reticulum and the mitochondria seems to be essential for numerous cellular processes involved in Ca2+signalling and maintenance of Ca2+
homeostasis. A presence of microsomal and mitochondrial proteins together with those characteristic for the plasma membrane in the fraction of the plasma membrane associated membranes (PAM) indicates a formation of stabile interactions between these three structures. We isolated the plasma membrane asso-ciated membranes from Jurkat cells and found its significant enrichment in the plasma membrane markers including plasma membrane Ca2+-ATPase, Na+, K+-ATPase and CD3 as well as sarco/endoplasmic reticulum
Ca2+ATPase as a marker of the endoplasmic reticulum membranes. In addition, two proteins involved in
the store-operated Ca2+entry, Orai1 located in the plasma membrane and an endoplasmic reticulum
pro-tein STIM1 were found in this fraction. Furthermore, we observed a rearrangement of STIM1-containing protein complexes isolated from Jurkat cells undergoing stimulation by thapsigargin. We suggest that the inter-membrane compartment composed of the plasma membrane and the endoplasmic reticulum, and isolated as a stabile plasma membrane associated membranes fraction, might be involved in the store-operated Ca2+entry, and their formation and rebuilding have an important regulatory role in cellular Ca2+
homeostasis.
© 2009 Elsevier Ltd. All rights reserved.
1. Introduction
Many cellular processes require a proper cooperation between the plasma membrane (PM) and subcellular vesicular networks such as the mitochondria and the endoplasmic reticulum (ER). It has been shown that along with their functional relations, rela-tively stabile contacts exist between the mitochondria and the ER as well as between both of these organelles and the PM. These struc-tures, composed of the pieces of plasma membrane connected with
Abbreviations: PAM, plasma membrane associated membranes; MAM, mito-chondria associated membranes; ER, endoplasmic reticulum; SOCE, store-operated calcium entry; CCE, capacitative calcium entry.
∗ Corresponding author. Tel.: +48 22 589 23 72; fax: +48 22 822 53 42.
E-mail address:[email protected](M.R. Wieckowski).
1The first two authors equally contributed to this work.
fragments of intracellular membranes (ER and/or the outer mito-chondrial membrane, and also recently reported mitomito-chondrial contact sites between outer and inner mitochondrial membranes (Wieckowski et al., 2006)) are known as the plasma membrane-associated membranes (PAM). They can be isolated and purified as a subcellular fraction reflecting structural and presumably functional associations between the ER, mitochondria and PM (Lebiedzinska et al., 2009).
Isolation of PAM using cell fractionation method was orig-inally described for yeast by Pichler et al. (2001). The same authors characterized protein composition of PAM. Moreover a possible function of these structures related to phospholipids (particularly phosphatidylserine and phosphatidylinositol) synthe-sis and transportation within a cell was also considered. More recently it was evidenced that store-operated Ca2+entry (SOCE) into non-electrically excitable cells needs functional and struc-tural interactions between the ER and the plasma membrane. It
seems that multimembranous structures (resembling PAM fraction described for yeast) are relevant to Ca2+homeostasis, especially to SOCE. This hypothesis was supported by Wu and co-workers, who showed that the distance between the ER and the PM varies between 10 and 25 nm. The distance smaller than 30 nm between the organelles could be regarded as not accidental association (Wu et al., 2006). So far, several models have been proposed to charac-terize the molecular basis of the interactions between the ER and the PM during SOCE (Parekh and Putney, 2005). Recently postu-lated model of conformational coupling is based on an assumption that structural associations of these membranes are maintained by direct interaction of specific protein located in the ER, known as stromal-interacting molecule 1 (STIM1) and the PM protein called ORAi (Wang et al., 2008). This model was supported by fluores-cence microscopy observation, that upon depletion of the ER of Ca2+, the discrete fraction of the ER moves to the cell periphery where it interacts with the PM. Ca2+release from ER increases the number of contact sites between the ER and PM by 62% (1/3 of junc-tions are newly formed whereas two thirds of them pre-existed in unstimulated cells) (Wu et al., 2006).
Previously it was found that certain regions of the ER inter-act with mitochondria, forming structures which may be isolated as so called mitochondria-associated membranes (MAM) frac-tion. Formation of such structures was previously characterized by biochemical means byGaigg et al. (1995). Data shown by Achleit-ner and colleagues indicated that interactions between ER and mitochondria occur more often than between other organelles (Achleitner et al., 1999). Formation of functional intermembrane structures between the ER and the mitochondria was demon-strated in yeast (Gaigg et al., 1995) and in mammalian cells (Vance, 1990; Shiao et al., 1995). The distance between interacting mem-branes, calculated on a basis of electron micrographs (Achleitner et al., 1999), is small enough to allow stabile contacts formation by proteins located on the surface of both organelles. The contacts between ER and mitochondria were also observed using high res-olution electron tomography (Marsh et al., 2001) and using GFP targeted probes and high resolution digital imaging microscopy (Rizzuto et al., 1998a,b). Interestingly, close contacts between smooth subdomains of ER and mitochondria have been shown to be required for both maintaining mitochondrial structure and lipid transfer between the two organelles (Vance, 1990; Prinz et al., 2000).
Co-isolation of ER, mitochondria and PM suggests that dynamic associations between these membranes could be fairly tight. The aim of the study presented in this paper was to isolate PAM frac-tion from Jurkat lymphoidal cells, and using various biochemical approaches, investigate its role in SOCE. It was confirmed that stimulation of Jurkat cells by thapsigargin results in the increased amount of STIM1 protein found next to the plasma mebrane. More-over, STIM1 was identified in the PAM fraction and upon addition of thapsigargin it was detected in protein complexes of much higher molecular mass than those in which it is present in unstimulated cells. It may be concluded that PAM are important intermembrane structures, of which the formation and rearrangement, following the ER depletion of Ca2+, accompanies activation of SOCE. The par-ticipation of STIM1 in such rebuilding was confirmed.
2. Materials and methods
2.1. Cell culture
Human lymphoblastoid T cells (Jurkat) were grown in RPMI 1640 medium supplemented with 10% fetal bovine serum (Gibco BRL), 2 mM glutamine (Gibco BRL), penicillin (100 U/ml), and strepto-mycin (50g/ml) in a humidified atmosphere of 5% CO2-95% air at 37◦C.
2.2. Induction of store-operated Ca2+entry
Cells washed twice with PBS, were suspended in nominally Ca2+ -free buffer consisting of 132 mM NaCl, 5 mM KCl, 25 mM HEPES, 1 mM MgCl2, 0.5 mM NaH2PO4, 1 mM pyruvate, 5 mM glucose, 0.05 mM EGTA; the pH was adjusted to a desired value with NaOH. After incubation of cells with 100 nM thapsigargin for 8 min at 37◦C 3 mM the mixture was supplemented with 2 mM CaCl2to induce CCE. After next 3 min the cells were used for subfractionation.
2.3. Subfractionation of Jurkat cells
Isolation of cellular fractions from Jurkat cells was made accord-ing to the method previously described for yeasts by Pichler et al. (2001)and adapted for Jurkat cells in our laboratory. Briefly, the control and SOCE induced cells were washed in PBS, resus-pended in cold (4◦C) homogenization buffer containing 225 mM mannitol, 75 mM sucrose, 0.1 mM EGTA, protein protease inhibitor cocktail, 5 mM Tris–HCl pH 7.4 and homogenized in the ice-cold water bath using glass Potter–Elvehjem homogenizer with a motor-ized teflon pestle. The efficiency of homogenization was monitored under the microscope and homogenization was stopped when disintegration of 90% of cells was reached. The homogenate was centrifuged at 600×gfor 3 min twice. The final supernatant was centrifuged at 20,000×gfor 20 min. Supernatant containing micro-somes and cytosolic proteins was centrifuged at 100,000×gfor 1 h to sediment microsomes. Crude membrane fraction containing plasma membrane, mitochondria and PAM fraction was suspended in 5 mM Bis–Tris, 0.2 mM EDTA, pH 6.0 and subjected to sep-aration on a discontinuous 38%, 43% and 53% sucrose gradient made on the base of the solution: 5 mM Bis–Tris, 0.2 mM EDTA, pH 6.0. A low-density band localized on the top of 38% sucrose (denoted as the PAM fraction), middle-density band character-ized as a crude mitochondrial fraction localcharacter-ized at the 38/43% sucrose interface and a high-density band, 43/53% sucrose interface, (denoted as plasma membrane) were collected and diluted three-fold with 225 mM mannitol, 75 mM sucrose, 0.1 mM EGTA, 5 mM Tris–HCl pH 7.4. PAM fraction was sedimented at 100,000×gfor 45 min. Purified plasma membrane was centrifuged at 10,000×g for 10 min to remove contaminating mitochondria and then sedi-mented at 48 000×gfor 20 min. Crude mitochondrial fraction was obtained by centrifugation at 13 000×g for 10 min. All isolated subcellular fractions were suspended in 225 mM mannitol, 75 mM sucrose, 0.1 mM EGTA, 5 mM Tris–HCl pH 7.4 using a loose-fitting Dounce homogenizer. Protein concentration in the fractions was determined according to Bradford’s method using Bio-Rad protein estimation kit.
2.4. Isolation of the plasma membrane – PAM enriched fraction and pure plasma membrane by biotinylation of cell-surface proteins from Jurkat cells
supple-mented with 100 mM DTT at 50◦C for 30 min. The eluted proteins were subjected to SDS-PAGE and Western blot.
To purify PM form PAM fraction, NeutrAvidin beads with bound PM/PAM proteins were incubated with 7 M urea/2 M tiourea for 15 min in RT. Beads with PM proteins were prepared for SDS-PAGE as described before.
2.5. Estimation of the protein profile of subcellular fractions by SDS-PAGE
40g of the protein of each fraction was separated on 4–12% SDS-PAGE with the size of 1 mm/16 cm/20 cm. Proteins were visual-ized by the colloidal Coomassie staining according to the Anderson procedure (Anderson and Anderson, 1991).
2.6. Blue native electrophoresis and second dimension (SDS-PAGE) of the BN-PAGE
The cells (30×106) washed twice with PBS or of PAM frac-tion (75g of protein) were resuspended in the aminocaproic acid buffer (1.5 M 6-aminocaproic acid, 50 mM Bis–Tris pH 7.0) and sup-plemented withn-dodecyl--d-maltoside (1% final concentration). Samples were incubated on ice for 20–30 min and then centrifuged at 100,000×gfor 15 min. to remove unsolubilized material. Protein concentration in the supernatant containing solubilized protein complexes was determined according to the Bradford’s method using Bio-Rad protein estimation kit. The supernatant was mixed with Serva Blue G (final concentration 0.5%) and subjected to elec-trophoresis on the acrylamide gel gradient of 5–12% and the size of 1 mm/16 cm/20 cm. At the beginning the separation was con-ducted slowly at 50 V for 30 min to 1 h until the samples entered the 4% stacking gel. Then the voltage was increased to 300 V. When the front of separated samples reached 1/3 of the gel length, the Coomassie blue containing cathode buffer was replaced by the another, colorless one (without Coomassie). The electrophoresis was continued at 300 V.
The lanes of the first-dimension gel were separated and incu-bated in a dissociating solution (1% SDS and 1% 2-mercaptoethanol), for 0.5 h at room temperature. Then were washed in electrophore-sis buffer, stacked over a 10% SDS-PA gel and separated at a constant current of 35 mA until a front of the blue dye reached the end of the gel. Proteins were visualized with the colloidal Coomassie staining or transfered on to the PVDF membrane using standard procedure.
2.7. Western blot analysis
For SDS-PAGE analysis subcellular fractions were separated on 10% SDS-polyacrylamide gels and identified with specific antibod-ies as follows:␣IP3R, non isotype specific monoclonal antibody, 1:200, Calbiochem; recognizing all three isoforms; Orai 1, 1:500 rabbit polyclonal, Abcam; ACSL-4, goat polyclonal, 1:1000, Santa Cruz; SOD2, goat polyclonal, 1:1000, Santa Cruz; SERCA2 (IID8), mouse monoclonal, 1:2000, Santa Cruz; PMCA, mouse monoclonal, 1:2000, Santa Cruz; PMCA4b (JA3), mouse monoclonal, 1:2500, Santa Cruz; Na/K ATPase mouse monoclonal, 1:2000, Abcam; COX II, mouse monoclonal, 1:2000, MitoSciences; ANT goat polyclonal, 1:1000, Santa Cruz; ␣VDAC1, 1:5000; Calbiochem, monoclonal anti-porin 31HLHuman; CD3, 1:2500, rabbit polyclonal, DAKO Cytomation; GOK1/STIM, 1:500, BD Transduction Laboratories. After hybridization with peroxidase (HRP) conjugated secondary antibody, the signal was revealed using ECL Plus Western blot detec-tion reagent (Amersham Pharmacia Biotech). Samples containing 70g total cellular protein per well were run on a Laemmli-type 8% sodium dodecyl sulfate-polyacrylamide gel and proteins were elec-troblotted onto nitrocellulose membranes. Blocking of nonspecific protein binding to nitrocellulose was performed by incubating the
membranes for 30 min with Tris-buffered saline (TBS)-0.1% Tween-2% milk.
2.8. Measurement of the cystosolic Ca2+concentration
Cytosolic free Ca2+ was measured with Fura-2 (Grynkiewicz
et al., 1985). The cells were loaded with 1M Fura-2/AM in the culture medium at 37◦C for 15 min. After centrifugation the cells were resuspended in the solution consisting of 132 mM NaCl, 5 mM KCl, 25 mM HEPES, 1 mM MgCl2, 0.5 mM NaH2PO4, 1 mM pyruvate, 5 mM glucose, 0.1 mM CaCl2, and centrifuged again. Next, the cells were suspended in the same but nominally calcium free solution (CaCl2 replaced with 0.05 mM EGTA) and used for experiments. Fluorescence of Fura-2 was measured at 30◦C with Shimadzu RF 5301PC spectrofluorimeter set in the ratio mode using 340 nm and 380 nm as excitation wavelengths and 510 nm as the emission wavelength. The time resolution of the measurements was 1 s.
2.9. Immunocytochemical detection of STIM1 protein
After activation of SOCE as described above, the cells (as well as the control ones not stimulated by thapsigargin) were fixed with 4% p-formaldehyde (15 min, at room temperature), washed in PBS and permealized by 0,1% Triton X-100 containing 0.1 M glycine (15 min). All steps of the immunostaining were performed in sus-pension. After washing in PBS, the cells incubated in 5% horse serum for 30 min. The primary antibody against Stim1 (monoclonal, BD Transduction Laboratories) was applied at dilution 1:100, 4◦C, overnight. Cells were then washed in PBS and incubated in sec-ondary antibody (Alexa Fluor 488, Donkey Anti-Rabbit IgG) diluted 1:200 for 2 h, at room temperature. After immunostaining, the cell pellets were dehydratated respectively in 50%, 70%, 96% and 100% ethanol (in each one for 15 min). Cells were then incubated twice in propylene oxide for 15 min, at room temperature and infil-trated with propylene oxide/epon at a ratio as follows: 2:1, 1:1, 1:2 (for 1 h at each one). Next, infiltration was performed overnight in 100% epon. After addition of a new portion of pure epon, the samples were left for polymerization at 60◦C for 48 h. Cell immo-bilized in polymerized epon were cut with use of ultramicrotome (Leica) into 500 nm-thick plastic sections. Images were acquired using confocal microscope (Leica TCS SP2). Images were subjected to background-subtraction and deconvolution, using Huygens 3.1 software (maximum-likelihood estimation algorithm), followed by brightness adjustment (in Corel Photo Paint), to cover full dynamic range of pixel-intesities.
2.10. Analysis of mitochondrial and endoplasmic reticulum structure
made using an inverted microscope (Axiovert 200 M; Carl Zeiss MicroImaging, Inc.), using a 63×/1.4 Plan-Apochromat objective, a Cool-SNAP HQ interline charge-coupled device camera (Roper Sci-entifi c) and the MetaMorph 5.0 software (Universal Imaging Corp.). 3D reconstruction and co-localization analysis were performed on a wide-field digital imaging system as previously described (Szabadkai et al., 2004, 2006). 3D image deconvolution was per-formed using a custom made software developed by the Biomedical Imaging Group of the University of Massachusetts (Worcester, MA, USA) based on measured point spread function (Rizzuto et al., 1998a,b). This setup thus allowed the resolution of 250 nm in the xy, and 500 nm in the z direction. For 3D reconstruction and co-localization analysis of fluorescence signals thedata analysis and visualization environment(DAVE) software, developed by the same group (Carrington et al., 1995; Rapizzi et al., 2002).
3. Results
3.1. Activation of SOCE induces changes in STIM1 protein localization
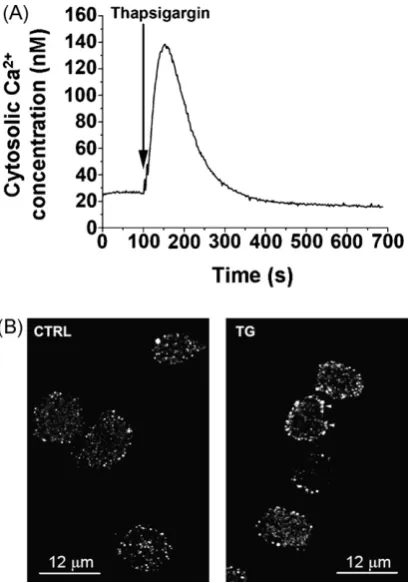
Translocation of STIM1 from ER to PM accompanying of SOCE was previously shown in various cell types (Serrano, 1988). In our experiments, a complete depletion of the ER of Ca2+, which is a prerequisite for SOCE activation, was achieved due to inhibition of SERCA by 100 nM thapsigargin. It resulted in a transient increase in the cytosolic Ca2+concentration (Fig. 1A). Such treatment of cells resulted also in accumulation of large STIM1-immunoreactive gran-ules at the cell periphery, sometimes forming linear aggregates (Fig. 1B). They may reflect an accumulation of vesicles separated from the plasma membrane by the distance smaller than the opti-cal microscopy resolution (∼250 nm). Notably, the specimen was
Fig. 1.Intracellular localization of STIM1 in control and SOCE-activated cells. (A) Representative trace showing a thapsigargin-evoked transient increase of the cytosolic Ca2+in Jurkat cells suspended in the Ca2+-free solution. (B) Translocation
of STIM1 to the plasma membrane in Jurkat cells in upon addition of thapsigargin.
prepared by distortion-free embedding of cells in the resin, fol-lowed by cutting of semi-thin sections. Such a procedure preserves the native 3D arrangement of cellular compartments. This obser-vation, confirming data coming from other laboratories, led us to further studies focused on a transient formation of specialized structures consisting of the ER and PM, putatively engaged in the store-operated Ca2+entry.
3.2. Isolation and characterization of PAM fraction from Jurkat cells
To isolate the PAM fraction, we took an advantage of a method developed byGaigg et al. (1995) using sucrose density gradient centrifugation that allowed to fractionate the crude PM fraction to PAMs and the purified PM (Gaigg et al., 1995; Serrano, 1988). To improve the quality and efficiency of the purification procedure we slightly modified the original protocol. Four subcellular fractions: mitochondria, ER, PM and PAM fraction were isolated from human lymphoblastoid T cells (Jurkat cells). For details of our protocol see Section2andSupplementary Figure 1.
According to the data available in the literature, divalent cations modify PAM composition and increase stability of interactions between the PM and the ER, and/or the mitochondria (Pichler et al., 2001). Moreover, a slightly acidic medium (ca. pH 6.0) also seems to be critical for these interactions. Therefore, in all experiments described in this paper, PAM fraction was isolated in the presence of divalent cations chelators in buffers, and pH of sucrose gradi-ent was adjusted to 6.0. Protein composition of the PAM fraction was compared with the protein profiles of the mitochondria, ER and PM isolated from Jurkat cells, using 1D SDS-PAGE technique. As expected, protein profile of the PAM fraction (Supplementary Figure 2) differs from others, but some of protein bands of the PAM have counterparts in the ER and mitochondria.
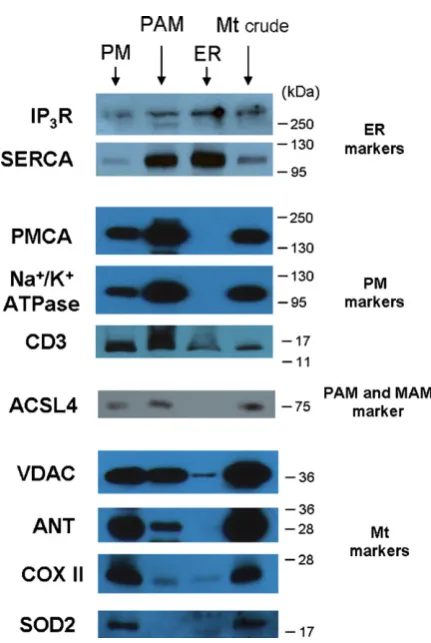
To identify interactions between the organelles, and find pro-tein “fingerprint” characteristic for the PAM fraction obtained from Jurkat cells, we used various antibodies against proteins which are specific markers of particular subcellular fractions. As it is shown in
Fig. 2.Immunoblot analysis of protein components of subcellular fractions pre-pared from Jurkat cells. Subcellular fractions from Jurkat cells were separated on 10% SDS-polyacrylamide gels, transferred to PVDF membrane and incubated with corresponding antibodies. Representative blots showing the relative amounts of characteristic protein markers in isolated subcellular fractions are shown. ER mark-ers: IP3R, SERCA. PM markers: Na+/K+-ATPase, PMCA, CD3R. Mitochondrial markers:
VDAC, ANT, COXI, SOD2. Quantification of Western blots is presented in Supplemen-taryFig. 3.
Furthermore, an introduction of additional steps to the PM isola-tion/purification procedure, consisting of hypertonic treatment of the PM fraction followed by centrifugation at 48,000×gfor 20 min, did not improve its purity (not shown). This might indicate that the plasma membrane and mitochondria form stabile structures distinct from the PAM formed predominantly by the endoplasmic reticulum and plasma membrane. The presence of ACSL4 protein in the PM fraction supports this hypothesis but it needs further confirmation.
Co-localization of selected proteins typical for different intracel-lular structures in the PAM fraction supports the idea that PAM is a structure which reflects stable bridges between PM and ER. Such a close positioning of ER to the PM enables fast and discrete cross-talk between these two structures e.g. to help or maintain SOCE (Lebiedzinska et al., 2009).
3.3. STIM1and Orai1 proteins are present in the PAM fraction
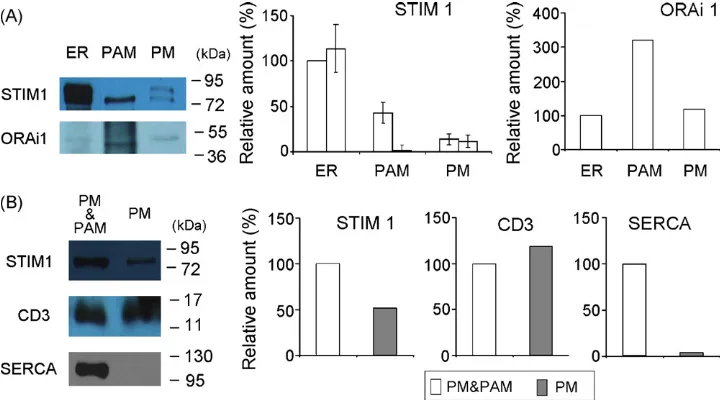
STIM1 has been shown to be a Ca2+sensor within the ER stores and its role in the store-operated Ca2+signaling pathway was firmly established (Zhang et al., 2005; Roos et al., 2005; Spassova et al., 2006). This protein interacts with Orai1 protein located in the PM, which is another crucial component of the CCE machinery. To test whether both CCE participants, STIM1 and Orai1 are components of the PAM fraction, an intracellular localization of these proteins was investigated. We estimated the relative amount of STIM1 and Orai1 in selected cellular fractions. As shown inFig. 3A a high amount of
STIM1 is detected in both ER and PAM fractions, whereas a rela-tively low amount of this protein was detected in the PM fraction. Orai1 protein was predominantly detected in the PAM and PM frac-tion. Using this isolation procedure two bands of STIM1 have been always observed. The lower band corresponds to the STIM1 which is deglycosylated and the upper to the glycosylated form. Occurrence of this two forms of STIM1 is in agreement with the data recently published by our group (Czy ˙z et al., 2009). Interestingly, in PAM fraction only deglycosylated STIM1 has been observed what addi-tionally supports our hypothesis of the involvement of PAM fraction in the CCE.
As STIM1 (but not Orai1) is thought to undergo intracellular translocation between the ER and the PM upon depletion of the intracellular Ca2+stores, the further experiments were focused on this protein. To verify the previously reported observation that STIM1 is present not only in the ER but also can be an integral PM protein (Zhang et al., 2005) an alternative method based on cell surface protein biotinylation was used for isolation of the crude PM fraction. It consist of both “bright” (“pure”) PM free of other membrane fragments and PAM fraction. Incubation of the collected material with 7 M urea and 2 M thio-urea resulted in an dissociation of the high purity PM. The PM fraction prepared by this method is free of ER marker (Fig. 3B) whereas the mitochondrial markers (ANT, COX and SOD2) were not detected either in the PM + PAM fraction prior to or in the PM fraction after the urea + thiourea treatment (not shown). Western blot analysis of such highly purified PM clearly indicates that STIM1 is also present in the PM (Fig. 3B). The com-parison of both methods used for purification of the PM and PAM fractions confirms that the biotinylation technique allows isolating of PM of much higher purity than that based on the centrifugation in sucrose gradient (Peirce et al., 2009).
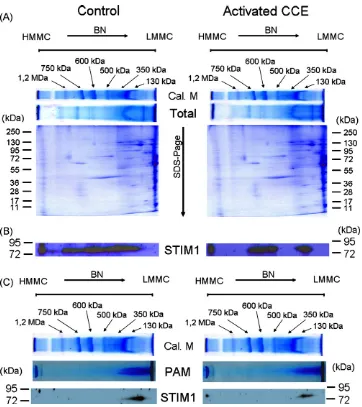
3.4. Protein profile of Jurkat cells is unchanged during CCE but STIM1 is present in different protein complexes
An activation of SOCE is an indispensable element of signaling cascade that follows lymphocyte stimulation. Depletion of the ER Ca2+stores induced by an extracellular stimulus results in opening of SOCs located in the PM. Recently it has been shown that this lat-ter step needs close apposition of the ER and PM proteins, STIM1 and Orai1, respectively. For a qualitative description of such rela-tionships between PM and ER under resting condition and during SOCE activation, the rearrangement of STIM1-containing protein complexes were analyzed.
numer-Fig. 3.Subcellular localization of STIM1 protein. (A) Subcellular fractions were prepared as is described in Material and methods. 30g proteins were loaded on 10% SDS-polyacrilamide gels. A typical result of immunoblots are shown. Bar chart showing quantified levels of STIM1 and ORAi1 in subcellular fractions isolated from Jurkat cells. Each bar chart represents means±S.E.M.n= 3. For ORAi1 presented values are means from two independent experiments. Western blot scans were analyzed using NIH ImageJ software; (B) Crude plasma membrane (enriched in PAM fraction, PM/PAM) and pure plasma membrane (PM) were isolated by biotinylation of the cell-surface proteins from Jurkat cells and separated on 10% SDS-polyacrilamide gel. A typical results of immunoblot are shown. Bar chart showing quantified levels of STIM1 and CD3 and SERCA. Presented values are means from two independent experiments. Western blot scans were analyzed using NIH ImageJ software.
ous complexes of relatively high, medium and low molecular mass. These changes indicate that STIM1-containing protein complexes are modified during SOCE. Such a remodeling might be important for the initiation and/or execution of Ca2+entry. To distinguish between global and local changes in protein profiles, a participation of STIM1 in different protein complexes located in the PAM fraction was investigated. Results presented inFig. 4C show remodeling of STIM1-containing complexes during CCE in PAM fraction.
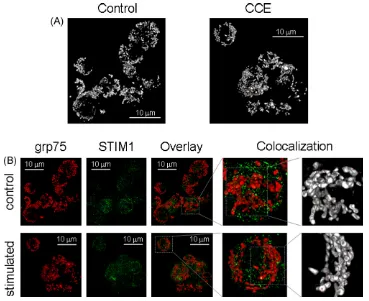
3.5. 3D morphological imaging reveals physical association of STIM1 with plasma membrane and mitochondria
It has been previously shown that following SOCE induction by thapsigargin, mitochondria shifted towards the plasmamembrane in Jurkat cells (Quintana et al., 2006). However, no data concerning the relationship between mitochondria and STIM1 during activa-tion of the SOCE pathway have been published so far. In order to determine the interaction of STIM1 with the mitochondrial network in the control and thapsigargin treated cells we applied a 3D digital imaging approach previously described to assess mitochondrial-ER interactions (Rizzuto et al., 1998a,b). To acquire Z-series of images of the mitochondrial marker grp75 (present in the mitochondrial matrix and the OMM surface) (Szabadkai et al., 2006) and STIM1, cells were immobilized on glass coverslips, fixed either without treatment or immediately after induction of capacitative Ca2+influx (see Section2), and the proteins were visualized by immunoflu-orescence. As shown on Fig. 5A, mitochondria form a partially continuous network in a narrow space between the nucleus and PM in both control and Tg treated cells, without any gross change in their structure. Co-localization analysis of the STIM1 and grp75 signals (Fig. 5B) revealed a low level of interaction in control cells (0.27%), presumably reflecting the previously demonstrated ER-mitochondrial contact sites (Rizzuto et al., 1998a,b). Interestingly, in Tg stimulated cells we observed a significant increase in the formation of such STIM1 containing contact sites between mito-chondria and the ER and presumably the PM (0.57%). These results thus further confirm the findings that STIM1 co-purifies with mito-chondrial, ER and PM markers, coalescing into dynamic protein complexes comprising all three organelles.
In conclusion, our data confirm a close physical coupling between ER and PM which leads to formation of PAM structures, plays a crucial role in activation and/or maintenance of SOCE.
4. Discussion
Previously it was shown that the depletion of Ca2+ stores of Ca2+ results in enhanced interaction of the ER with mitochon-dria (Rizzuto et al., 1998a,b). Recently, we have identified protein components of the MAM fraction, and pointed out a possible par-ticipation of IP3R, VDAC and MOT2 proteins in the Ca2+transport between these organelles (Szabadkai et al., 2006). Moreover, we defined the mitochondrial proteins in contact sites between the mitochondria and ER in the MAM fraction, and highlighted their role in modulating Ca2+cross talk between the mitochondria and ER (Wieckowski et al., 2006). Furthermore, we also found that the MAM fraction isolated during mitochondria purification from HeLa cells or rat liver contains not only mitochondrial and ER markers but also plasma membrane Ca2+ATPase (PMCA).
More recently, similar interaction between the PM and ER were described in control and stimulated cells, suggesting that forma-tion of direct contacts between selected regions of different cellular membranes is necessary for activation of Ca2+channels (Zhang et
al., 2005; Luik et al., 2008). Altogether, these observations indi-cate that stimulation of Ca2+ signal in electrically non-excitable cells needs very complex interactions between membranes of three cellular structures: plasma membrane, endoplasmic reticulum and mitochondria (Lebiedzinska et al., 2009).
Fig. 4.Blue Native Electrophoresis and Western blot analysis of the total cellular lysate and PAM fraction from Jurkat cells in resting state and after CCA activation. Jurkat cells or native PAM fractions were separated on a 5–12% acrylamide gel in the first dimension. Then, the native gels were incubated with a dissociating solution, stacked over a 10% SDS-PA gel and electrophoreticaly separated as described in Material and methods section. (A) BN-PAGE/SDS-PAGE of control and “stimulated” “total proteom” from Jurkat cells. Calibration marker–BN-PAGE of rat heart mitochondria used as a molecular marker to calibrate separation in the gel. TOTAL–BN-PAGE of “total proteom” stained by Coomassie Brillant Blue G250. (B) Western blot of BN-PAGE/SDS-PAGE separated “total proteom” of Jurkat cells developed against STIM1 protein. C) BN-PAGE/SDS-PAGE of PAM fraction isolated from control and “stimulated” Jurkat cells. Calibration marker–BN-PAGE of rat heart mitochondria used as a molecular marker to calibrate separation in the gel. PAM–BN-PAGE of PAM fraction stained by Coomassie Brillant Blue G250. STIM1-Western blot of BN-PAGE/SDS-PAGE separated PAM fraction developed against STIM1 protein. (B and C) – a typical results of an immunoblot from two separate experiments shown.
cellular homogenate in non-linear sucrose gradient. The second one based on a biotinylation of the intact cell surface proteins and iso-lation of biotinylated PM subfractions from cellular homogenate. Difference in the proportion of the selected mitochondrial and ER markers in the purified PM and PAM in comparison to that found in the purified ER or mitochondria excludes unspecific contamination of the both PM-containing fractions. It allows regarding “bright” PM and PAMs as a specific subfraction of the total plasma membrane. As we shown inFig. 2, PAM fraction contains relatively high amount of the outer mitochondrial membrane marker VDAC and the inner mitochondrial membrane marker ANT what is in a good agreement with findings ofPichler et al. (2001). Previously, we have shown the lack of COX II, a subunit of cytochrome c oxidase (a marker of the inner mitochondrial membrane) in the MAM fraction (Szabadkai et al., 2006). Similarly in this case, the absence COX I subunit in the PAM fraction indicates a selective participation of ANT in PAM. ANT present in the PAM fraction comes from the mitochondrial con-tact sites where VDAC as a link can interact with proteins either from PM or ER. It suggests that only specific regions of the outer
and inner mitochondrial membranes are involved in the PAM for-mation. The detection of the only selected mitochondrial and ER proteins in the PAM fraction suggests the specificity of these com-plex interorganelle interactions.
3D reconstruction of the mitochondrial structure in control and SOCE activated Jurkat cells shows no significant differences in mito-chondrial shape (seeFig. 5A). This observation is in agreement with the data presented by Quintana and co-workers, who pointed out that translocation of mitochondria to the PM regions was observed in the late phase of Ca2+influx (after 8–10 min. when Ca2+ con-centration in the cytosol reached plateau) (Quintana et al., 2006). In our experimental model cells were fixed 2 min after initiation of the Ca2+influx. Thus, it probably was to short period for mito-chondrial translocation to be observed. In control cells and during early phase of SOCE mitochondria form a partially continuous net-work in the narrow space between the nucleus and the PM. STIM1 is localized as irregular patches in the ER membranes, often surround-ing the mitochondrial particles. We found an increased degree of co-localization of STIM1 and mitochondrial network in stimulated cells (seeFig. 5B). Furthermore, immunocytochemical analysis of the excited cells has revealed that STIM1 shifted towards the edge of the cells what corresponds with the data obtained by Wu et al. indicating that STIM1 accumulates in clusters formed in these areas of ER which are positioned closely to PM (Wu et al., 2006). Increased co-localization of the ER and mitochondria in the excited cells sug-gests that the abundance of the mitochondria-ER contact sites is maintained at a higher level not only during Ca2+release phase but also upon early phase of the capacitative Ca2+entry.
Analysis of the subcellular fractions isolated from Jurkat cells showed that the PAM fraction is enriched in the PM markers in com-parison to the distribution of these proteins in the PM not involved in PAM. It was previously reported that the plasma membrane pro-teins in Jurkat cells are clustered into separated “islands”. This may indicate that the PAM fraction isolated from these cells preferen-tially contains these sub-regions of the plasma membrane which enriched in proteins which are responsible for interaction with
intracellular organelles (Lillemeier et al., 2006). Low contamination level of PM by ER markers together with the lack of the PM markers in the ER fraction suggests that the composition of PAM fraction is unique and not accidental. It has previously been reported by Pich-ler and co-workers that PAM fraction isolated from yeast contains markers of both PM and ER. They found that the plasma membrane ATPase activity in PAM fraction is 100-fold lower in comparison to the pure PM. The authors have left open the question whether the protein composition of the PAM fraction is the same as or different then the subfraction of the ER in the proximity to the plasma mem-brane (Pichler et al., 2001). In contrary to these data our results obtained for Jurkat cells indicate that PAM fraction exhibits high similarity to the PM.
The hypothesis suggesting that PAM can be involved in the SOCE was additionally supported by our finding indicating that the PAM obtained from Jurkat cells by sucrose gradient centrifugation, con-tained significant amount of STIM1 protein. STIM1 is the ER protein though its localization in other subcellular compartments has also been suggested (Zhang et al., 2005). Furthermore, data obtained from the experiments based on fractionation of cells with the use of the biotinylation technique, confirmed that STIM1 could also be found in the PM. This result is in good agreement with observa-tion described bySpassova et al. (2006). It was also reported that depletion of the ER of Ca2+caused translocation of STIM1 to the PM. (Peirce et al., 2009). Our data may support a hypothesis that STIM1 present in the PAM fraction is involved in the interaction between ER and PM and formation/activation of SOC channels (seeFig. 6). On the other hand, they may became controversial in a view of other reports evidencing that translocation of STIM1 to PM during SOCE does not occur (Wu et al., 2006; Luik et al., 2006; Patterson et al., 1999). The interactional model of SOCE activation assumes that the opening of Ca2+channels needs a specific interaction of STIM1
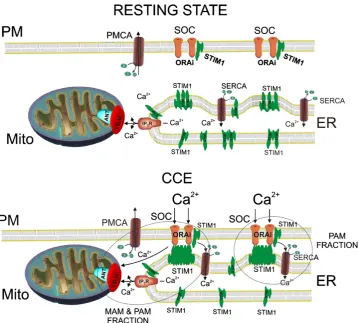
Fig. 6. Model of capacitative calcium entry initiated by aggregation o STIM1 present in PAM fraction in to high molecular weight complexes. Interaction of STIM1 aggregates with ORAi protein results in activation of SOC channels. Close positioning of mitochondria to the SOC reduces Ca2+-dependent channel inactivation. SERCA presence in the
vicinity of Ca2+transmission areas enables fast and efficient ER refilling.
and proteins of the PM (Venkatachalam et al., 2002; Dziadek and Johnstone, 2007). Using TIRF microscopy,Wu et al. (2006)observed that STIM1 aggregated in the ER may be positioned at the dis-tance of 10–20 nm from the PM. This is close enough for direct interaction between STIM1and PM proteins (Wu et al., 2006). It is suggested that STIM1 interacts with ORAi1 protein or, alternatively, with STIM1 located in the PM. Such explanation in the line with our observation that, activation of SOCE accompanies the remodel-ing of STIM1-containremodel-ing complexes of a molecular masses rangremodel-ing between 800 kDa–1.5MDa and 300–500 kDa. (Fig. 4B). Unfortu-nately, in the total native lysate we could not observe an appearance of the very high molecular weight STIM1-containing complexes, which formation was postulated by Dziadek and Johnstone in their model of conformational changes in STIM1 protein (Dziadek and Johnstone, 2007). On the other hand, our results obtained with the use of PAM fraction isolated from Jurkat cells correspond well to the conformational model of SOCE. Detection of STIM1 in the higher molecular mass complexes concomitantly with its decreased par-ticipation in the low molecular mass complexes indicates serious changes in proteins interrelationships upon stimulation of cells by thapsigargin. The presence of some amount of the low molecular mass STIM1-containing complexes in PAM fraction after induction of SOCE indicates that not all STIM1 present in the ER or PAM is involved in the activation and/or maintenance of the Ca2+entry (see
Fig. 4C low/right panel). It seems that STIM1 accumulation near the PM does not need a massive movement of ER toward PM and is in an agreement with the data presented by Wu et al. that only 1/3 of con-tacts is newly formed and the rest comes from already preexisting ones. This could emphasize a potential role of PAM fraction in SOCE (Wu et al., 2006). Recently it has been reported that close
apposi-tion of ER membrane to the PM can also be important for refilling of ER stores with minimal changes in cytosolic Ca2+level (Jousset et
al., 2007). The authors tested the hypothesis that Ca2+influx during SOCE occurs in clusters containing SOC channels, STIM1 and SERCA proteins.
Taking together, we propose that PAM are subcellular structures involved in the store-operated Ca2+entry. It must be emphasized that they not only reflect the functional interactions between the PM, ER and mitochondria, but also are stabile enough to allow puri-fying them as a defined subfraction of the total plasma membrane. However, the mode of interaction between mitochondria, ER and PM is still far from being fully understood and identification of other components of contact sites between these organelles needs addi-tional studies. More information about the role of PAM and MAM fraction you can find in our recent review, see ref.Lebiedzinska et al. (2009).
Acknowledgments
This work was supported in part by Ministry of Science and Higher Education in Poland (grants N301 092 32/3407 and N301 086 31/2742) and the Polish Mitochondrial Network. P.P. laboratory is supported by AIRC, UMDF, PRRIITT, FISM grants and local funds from the University of Ferrara. This work was also partly supported by a University College London startup grant to G.S.
Appendix A. Supplementary data
References
Achleitner G, Gaigg B, Krasser A, Kainersdorfer E, Kohlwein SD, Perktold A, et al. Association between the endoplasmic reticulum and mitochondria of yeast facil-itates interorganelle transport of phospholipids through membrane contact. Eur J Biochem 1999;264:545–53.
Anderson NL, Anderson NG. A two-dimensional gel database of human plasma pro-teins. Electrophoresis 1991;12:883–906.
Carrington WA, Lynch RM, Moore ED, Isenberg G, Fogarty KE, Fay FS. Superresolution three-dimensional images of fluorescence in cells with minimal light exposure. Science 1995;268:1483–7.
Chen P, Zhang L, Li X, Wang X, Cao R, Liu Z, et al. Evaluation of strategy for ana-lyzing mouse liver plasma membrane proteome. Sci China series: C Life Sci 2007;50:731–8.
Czy ˙z A, Brutkowski W, Fronk J, Duszynski J, Zablocki K. Tunicamycin desensitizes store-operated Ca2+ entry to ATP and mitochondrial potential. Biochem Biophys Res Commun 2009;381:176–80.
Duszynski J, Koziel R, Brutkowski W, Szczepanowska J, Zablocki K. The regula-tory role of mitochondria in capacitative calcium entry. Biochim Biophys Acta 2006;1757:380–7.
Dziadek MA, Johnstone LS. Biochemical properties and cellular localization of STIM proteins. Cell Calcium 2007;42:123–32.
Gaigg B, Simbeni R, Hrastnik C, Paltauf F, Daum G. Characterization of a microsomal subfraction associated with mitochondria of the yeast. Saccharomyces cere-visiae. Involvement in synthesis and import of phospholipids into mitochondria. Biochim Biophys Acta 1995;1234:214–20.
Grynkiewicz G, Poenie M, Tsien RY. A new generation of Ca2+indicators with greatly
improved fluorescent properties. J Biol Chem 1985;260:3440–50.
Jousset H, Frieden M, Demaurex N. STIM1 knockdown reveals that store-operated Ca2+channels located close to sarco/endoplasmic Ca2+ATPases (SERCA) pumps
silently refill the endoplasmic reticulum. J Biol Chem 2007;282:11456–64. Lebiedzinska M, Szabadkai G, Jones AWE, Duszynski J, Wieckowski MR.
Interac-tions between the endoplasmic reticulum, mitochondria, plasma membrane and other subcellular organelles. Internat J Biochem Cell Biol 2009;41:1805– 6.
Lillemeier BF, Pfeiffer JR, Surviladze Z, Wilson BS, Davis MM. Plasma membrane-associated proteins are clustered into islands attached to the cytoskeleton. Proc Natl Acad Sci USA 2006;103:18992–7.
Luik RM, Wang B, Prakriya M, Wu MM, Lewis RS. Oligomerization of STIM1 couples ER calcium depletion to CRAC channel activation. Nature 2008;454:538–42. Luik RM, Wu MM, Buchanan J, Lewis RS. The elementary unit of store-operated
Ca2+entry: local activation of CRAC channels by STIM1 at ER-plasma membrane
junctions. J Cell Biol 2006;174:815–25.
Malli R, Frieden M, Trenker M, Graier WF. The role of mitochondria for Ca2+refilling
of the endoplasmic reticulum. J Biol Chem 2005;280:12114–22.
Marsh BJ, Mastronarde DN, Buttle KF, Howell KE, McIntosh JR. Organellar relation-ships in the Golgi region of the pancreatic beta cell line, HIT-T15, visualized by high resolution electron tomography. PNAS 2001;98:2399–406.
Parekh AB, Putney Jr JW. Store-operated calcium channels. Physiol Rev 2005;85:757–810.
Patterson RL, van Rossum DB, Gill DL. Store-operated Ca2+entry: evidence for a
secretion-like coupling model. Cell 1999;98:487–99.
Peirce MJ, Cope AP, Wait R. Proteomic analysis of the lymphocyte plasma membrane using cell surface biotinylation and solution-phase isoelectric focusing. Methods Mol Biol 2009;528:135–40.
Pichler H, Gaigg B, Hrastnik C, Achleitner G, Kohlwein SD, Zellnig G, et al. A subfraction of the yeast endoplasmic reticulum associates with the plasma
mem-brane and has a high capacity to synthesize lipids. Eur J Biochem 2001;268: 2351–61.
Prinz WA, Grzyb L, Veenhuis M, Kahana JA, Silver PA, Rapoport TA. Mutants affecting the structure of the cortical endoplasmic reticulum inSaccharomyces cerevisiae. J Cell Biol 2000;150:461–74.
Quintana A, Schwarz EC, Schwindling C, Lipp P, Kaestner L, Hoth M. Sustained activity of calcium release-activated calcium channels requires translocation of mito-chondria to the plasma membrane. J Biol Chem 2006;28:40302–9.
Rapizzi E, Pinton P, Szabadkai G, Wieckowski MR, Vandecasteele G, Baird G, et al. Recombinant expression of the voltage-dependent anion channel enhances the transfer of Ca2+microdomains to mitochondria. J Cell Biol 2002;159:613–24.
Rizzuto R, Carrington W, Tuft RA. Digital imaging microscopy of living cells. Trends Cell Biol 1998a;8:288–92.
Rizzuto R, Pinton P, Carrington W, Fay FS, Fogarty KE, Lifshitz LM, et al. Close con-tacts with the endoplasmic reticulum as determinants of mitochondrial Ca2+
responses. Science 1998b;280:1763–6.
Roos J, Di Gregorio PJ, Yeromin AV, Ohlsen K, Lioudyno M, Zhang S, et al. STIM1, an essential and conserved component of store-operated Ca2+channel function. J
Cell Biol 2005;169:435–45.
Schägger H, von Jagow G. Blue native electrophoresis for isolation of membrane protein complexes in enzymatically active form. Anal Biochem 1991;199:223–31. Serrano R. H+-ATPase from plasma membranes of Saccharomyces cerevisiae
and Avena sativa roots: purification and reconstitution. Methods Enzymol 1988;157:533–44.
Shiao YJ, Lupo G, Vance JE. Evidence that phosphatidylserine is imported into mito-chondriaviaa mitochondria-associated membrane and that the majority of mitochondrial phosphatidylethanolamine is derived from decarboxylation of phosphatidylserine. J Biol Chem 1995;270:11190–8.
Spassova MA, Hewavitharana T, Xu W, Soboloff J, Gill DL. A common mechanism underlies stretch activation and receptor activation of TRPC6 channels. Proc Natl Acad Sci USA 2006;103:16586–91.
Szabadkai G, Bianchi K, Varnai P, De Stefani D, Wieckowski MR, Cavagna D, et al. Chaperone-mediated coupling of endoplasmic reticulum and mitochondrial Ca2+channels. J Cell Biol 2006;175:901–11.
Szabadkai G, Simoni AM, Chami M, Wieckowski MR, Youle RJ, Rizzuto R. Drp-1 depen-dent division of the mitochondrial network blocks intraorganellar Ca2+waves
and protects against Ca2+mediated apoptosis. Mol Cell 2004;16:59–68.
Vance JE, Stone SJ, Faust JR. Abnormalities in mitochondria-associated membranes and phospholipid biosynthetic enzymes in the mnd/mnd mouse model of neu-ronal ceroid lipofuscinosis. Biochim Biophys Acta 1997;1344:286–99. Vance JE. Phospholipid synthesis in a membrane fraction associated with
mitochon-dria. J Biol Chem 1990;265:7248–56.
Venkatachalam K, van Rossum DB, Patterson RL, Ma HT, Gill DL. The cellular and molecular basis of store-operated calcium entry. Nat Cell Biol 2002;4:E263–272. Wang Y, Deng X, Hewavitharana T, Soboloff J, Gill DL, Stim ORAI. TRPC channels in the control of calcium entry signals in smooth muscle. Clin Exp Pharmacol Physiol 2008;35:1127–33.
Wieckowski MR, Szabadkai G, Wasilewski M, Pinton P, Duszynski J, Rizzuto R. Overexpression of adenine nucleotide translocase reduces Ca2+signal
trans-mission between the ER and mitochondria. Biochem Biophys Res Commun 2006;348:393–9.
Wu MM, Buchanan J, Luik RM, Lewis RS. Ca2+store depletion causes STIM1 to
accu-mulate in ER regions closely associated with the plasma membrane. J Cell Biol 2006;174:803–13.
Zhang SL, Yu Y, Roos J, Kozak JA, Deerinck TJ, Ellisman MH, et al. STIM1 is a Ca2+
sensor that activates CRAC channels and migrates from the Ca2+store to the