Refer to Important disclosures in the last page of this report
Stock DataTarget price (Rp) Rp2,100
Prior TP (Rp) Rp2,950
Shareprice (Rp) Rp1,330
Upside/downside (%) +57.9
Sharesoutstanding (m) 6,200
Marketcap. (US$ m) 542
Government of Indonesia 51.0%
Public 49.0%
Estimate Change; Vs. Consensus
2018 2019 PT Indo Premier Sekuritas [email protected] +62 21 5793 1168
Modest 3Q18, still in-line
Earnings grew by 53% in 9M18, in-line with our forecast.
Resilient 9M18 contract achievement (+2% yoy).
To invest in Energy and Water treatment projects.
Maintain Buy albeit lower TP of Rp2,100 (Target P/E of 8.0x).
Modest 3Q18 bottom line with improved margin.
PTPP reported 9M18
Earnings of Rp865bn (+53% yoy), which came in-line with ours (54%), but
slightly below consensus FY18F estimate (50%). Net margin were squeezed to
5.9% in 9M18 (9M17: 7.2%) due to increase in interest expense of Rp464bn
(+95% yoy) and non-controlling interest portion of 22% (9M17: 11%). However,
PTPP booked modest 3Q18 earnings of Rp395bn (+22% qoq, -5% yoy), forming
24% of our FY18F forecast. In addition, 3Q18 net margin was improved to 7.5%
in 3Q18 (vs. 2Q18: 5.6%) given lower opex and increase in other income of
Rp144bn (-39% qoq) and Rp186bn (+85% qoq), respectively.
The only SOE contractor with positive new contract growth.
PTPP booked
new contract of Rp32.5tn in 9M18 (+2% yoy), forming 66% of company’s FY18
guidance of Rp49tn. We are confident that PTPP will be able to achieve our FY18F
target of Rp48tn given new contract pipeline of Rp21.3tn in 4Q18. PTPP will need
77% winning rate to achieve company’s FY18F contract target of Rp49tn. As of
8M18, PTPP has total orderbook of Rp80tn, which translate to 3.5x trailing
12-month sales, providing strong profitability for the next 3 years.
Diversify to Energy and Water treatment projects.
Through it’s subsisdiary,
PP Energi has acquired 95% of oil and fuel storage company in Palembang, PT
Odira Energy. PTPP plans to construct fuel storage in Nipa Island with total
investment of US$400mn. In addition, PTPP is also planning to create a JV to
develop 200MV power plant in Philippine with total investment of Rp4tn. PP Energi
is currently developing another power plant in Solo which will soon reach financial
closing and signing of power purchase agreement (PPA). On the other hand, PTPP
has 3 water treatment projects in their pipeline which located in Bekasi, Bali, and
Tangerang Selatan.
Maintain Buy with TP of Rp2,100 (from Rp2,950).
Given in-line 9M18
earnings and new contract achievement, we maintain our positive stand on PTPP
as one of our top picks in construction sector. As of 9M18, PTPP has the lowest
DER of 0.8x among SOE contractor peers (Industry average: 1.4x). However, we
reduced our target price for PTPP to Rp2,100, based target FY18F P/E of 8.0x as
we raise our risk free rate to 8.5% (from: 7%). Key risk to our call might come
from lower than expected new contract achievement due to infrastructure projects
tender delays.
Pembangunan Perumahan
(
PTPP IJ
)
01 November 2018
Results Note
Source: PTPP, IndoPremier Share Price Closing as of : 31-October-2018
2
Refer to Important disclosures in the last page of this report
Fig. 1: Revenue by segment Fig. 2: 9M18 revenue by segments
Source: Company, IndoPremier Source: Company, IndoPremier
Fig. 3: Order book to grow by 7% CAGR in FY17A-FY20F Fig. 4: 9M new contract achievements
Source: Company, IndoPremier Source: Company, IndoPremier
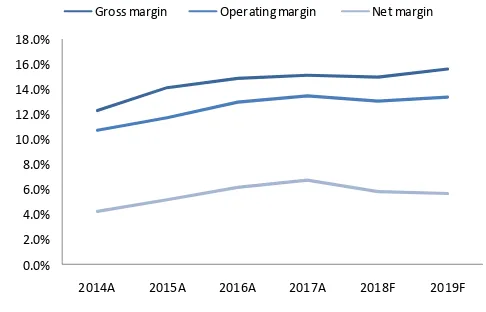
Fig. 5: PTPP has the lowest DER among SOE peers Fig. 6: Margin to improve given property and EPC contribution
Source: Company, IndoPremier Source: Company, IndoPremier
0%
2014A 2015A 2016A 2017A 2018A 2019A 2020A
(Rp Bn)
Construction EPC Property and realty
Equipment rent Precast growth
65%
20% 12%
Construction EPC Property and realty
Equipment rent Precast Energy
Infrastructure
2014A 2015A 2016A 2017A 2018F 2019F 2020F
Carry over New contract
(Rp bn)
WSKT ADHI WIKA PTPP
(x)
WSKT ADHI WIKA PTPP
0.0%
2014A 2015A 2016A 2017A 2018F 2019F
3
Refer to Important disclosures in the last page of this report
Fig.7: 9M18 earnings result
(Rp bn) 9M18 9M17 YoY 3Q18 2Q18 QoQ FY17/ ours FY17/ consensus
Revenue 14,787 13,762 7% 5,280 5,824 -9% 53% 55%
Gross profit 2,228 1,994 12% 765 905 -15% 53% 54%
Operating profit 1,811 1,701 6% 732 710 3% 50% 55%
Net profit 875 990 -12% 395 324 22% 54% 50%
Gross margin 15.1% 14.5% 14.5% 15.5%
Operating margin 12.2% 12.4% 13.9% 12.2%
Net margin 5.9% 7.2% 7.5% 5.6%
4
Refer to Important disclosures in the last page of this report
Year To 31 Dec (RpBn) 2016A 2017A 2018F 2019F 2020F
Income Statement
Net Revenue 16,459 21,502 27,938 33,038 36,103
Cost of Sales (14,003) (18,251) (23,748) (27,871) (30,341)
Gross Profit 2,456 3,251 4,190 5,167 5,762
SG&A Expenses (487) (726) (934) (1,158) (1,364)
Operating Profit 1,968 2,525 3,257 4,008 4,398
Net Interest (360) (421) (820) (1,129) (1,077)
Forex Gain (Loss) 22 3 0 0 0
Others-Net 213 328 366 372 382
Pre-Tax Income 1,843 2,436 2,802 3,251 3,703
Income Tax (552) (712) (865) (1,023) (1,127)
Minorities (128) (271) (311) (361) (412)
Net Income 1,163 1,453 1,626 1,867 2,164
Balance Sheet
Cash & Equivalent 9,424 9,587 10,995 13,295 13,524
Receivable 11,154 16,229 18,179 20,065 22,368
Inventory 2,656 2,421 3,239 3,961 4,404
Other Current Assets 1,110 1,671 2,551 2,875 2,871
Total Current Assets 24,344 29,908 34,964 40,197 43,168
Fixed Assets - Net 5,640 9,057 10,508 11,913 12,518
Goodwill 0 0 0 0 0
Non Current Assets 762 1,635 1,552 2,124 2,448
Total Assets 31,233 41,783 48,562 56,053 60,121
ST Loans 1,996 2,154 3,701 4,333 4,710
Payable 10,237 14,506 0 19,415 19,483
Other Payables 1,943 2,731 2,667 3,105 3,413
Current Portion of LT Loans 1,702 1,309 618 713 770
Total Current Liab. 15,879 20,700 24,928 27,565 28,376
Long Term Loans 3,048 5,144 7,314 10,051 10,942
Other LT Liab. 1,510 1,696 2,150 2,624 3,124
Total Liabilities 20,437 27,540 34,392 40,240 42,442
Equity 6,874 7,391 7,391 7,391 7,391
Retained Earnings 2,922 4,063 5,257 6,637 8,241
Minority Interest 1,000 2,789 1,527 1,790 2,053
Total SHE + Minority Int. 10,796 14,243 14,175 15,817 17,684
Total Liabilities & Equity 31,233 41,783 48,567 56,057 60,126
5
Refer to Important disclosures in the last page of this report
Year to 31 Dec 2016A 2017A 2018F 2019F 2020F
Cash Flow
Net Income (Excl.Extraordinary&Min.Int) 1,291 1,724 1,937 2,229 2,575
Depr. & Amortization 526 650 649 674 655
Changes in Working Capital (406) (1,139) (213) (1,295) (2,561)
Others 705 561 592 1,099 957
Cash Flow From Operating 2,116 1,796 2,965 2,707 1,627
Capital Expenditure (3,576) (4,939) (2,018) (2,652) (1,584)
Others (114) (370) (305) (251) (126)
Cash Flow From Investing (3,690) (5,309) (2,322) (2,902) (1,709)
Loans 3,068 1,861 3,026 3,463 1,325
Equity 4,414 0 0 0 0
Dividends (148) (307) (436) (488) (560)
Others 508 1,838 (1,739) (471) (387)
Cash Flow From Financing 7,842 3,392 851 2,505 378
Changes in Cash 6,268 (120) 1,494 2,310 296
Financial Ratios
Gross Margin (%) 14.9 15.1 15.0 15.6 16.0
Operating Margin (%) 12.0 11.7 11.7 12.1 12.2
Pre-Tax Margin (%) 11.2 11.3 10.0 9.8 10.3
Net Margin (%) 7.1 6.8 5.8 5.7 6.0
ROA (%) 4.6 4.0 3.6 3.6 3.7
ROE (%) 14.6 11.6 11.4 12.5 12.9
ROIC (%) 9.8 9.2 7.8 7.3 7.3
Acct. Receivables TO (days) 85.4 95.8 93.3 89.5 89.3
Acct. Receivables - Other TO (days) 136.2 136.6 131.5 121.7 125.2
Inventory TO (days) 5.4 7.2 8.4 7.7 7.3
Payable TO (days) 236.2 247.4 249.4 244.6 234.0
Acct. Payables - Other TO (days) 0.0 0.0 0.0 0.0 0.0
Debt to Equity (%) 62.5 60.4 82.1 95.4 92.9
Interest Coverage Ratio (x) 0.2 0.3 0.3 0.3 0.3
Net Gearing (%) (22.0) (5.5) 6.4 13.4 18.3
Head Office
PT INDO PREMIER SEKURITAS
Wisma GKBI 7/F Suite 718
Jl. Jend. Sudirman No.28
Jakarta 10210 - Indonesia
p +62.21.5793.1168
f +62.21.5793.1167
INVESTMENT RATINGS
BUY : Expected total return of 10% or more within a 12-month period HOLD : Expected total return between -10% and 10% within a 12-month period SELL : Expected total return of -10% or worse within a 12-month period
ANALYSTS CERTIFICATION.
The views expressed in this research report accurately reflect the analysts personal views about any and all of the subject securities or issuers; and no part of the research analyst's compensation was, is, or will be, directly or indirectly, related to the specific recommendations or views expressed in the report.
DISCLAIMERS