THE MISTARGETING AND
REGRESSIVE TAKE UP OF
THE INDONESIAN RICE SUBSIDY PROGRAM
WORKING
PAPER 5 - 2018
July 2018
THE MISTARGETING AND REGRESSIVE TAKE UP OF
THE INDONESIAN RICE SUBSIDY PROGRAM
The TNP2K Working Paper Series disseminates the findings of work in progress to encourage discussion and exchange of ideas on poverty, social protection and development issues.
Support to this publication is provided by the Australian Government through the MAHKOTA Program.
The findings, interpretations and conclusions herein are those of the author(s) and do not necessarily reflect the views of the Government of Indonesia or the Government of Australia.
You are free to copy, distribute and transmit this work, for non-commercial purposes.
Suggested citation: Satriawan, E., Shrestha, R. 2018. The Mistargeting and Regressive Take Up of The Indonesian Rice Subsidy Program. TNP2K Working Paper 5-2018. Jakarta, Indonesia.
To request copies of this paper or for more information, please contact: [email protected]. The papers are also available at the TNP2K (www.tnp2k.go.id).
TNP2K
Grand Kebon Sirih Lt. 4,
Jl. Kebon Sirih Raya No.35, Jakarta Pusat, 10110 Tel: +62 (0) 21 3912812
TNP2K WORKING PAPER 5 - 2018
July 2018
The Mistargeting and Regressive Take Up of the Indonesian Rice Subsidy Program
Elan Satriawan
§†and Ranjan Shrestha
‡July 2018
Abstract
We evaluate household participation in the Indonesian Raskin program, a national rice price
subsidy program for the poor. Using a household panel from the 2000 and 2007 rounds of the
Indonesian Family Life Survey (IFLS), we evaluate program participation over the duration of the
year prior to the 2007 survey using four different measures of participation. We find that although
the poor as a whole are likely to have higher levels of participation compared to the non-poor,
program participation is regressive among the poor. The poorest households are less likely to
purchase Raskin rice over the course of a year, and conditional on participation, they are likely to
purchase lower quantities of rice, purchase rice with lower frequency, and have lower participation
relative to the number of community distributions. We also find that this regressive participation
among the poorest households is more severe in urban areas.
JEL classification: H40, H50, I38, O20
Keywords: Raskin Program, Food Price Subsidy, Program Take Up, Indonesian Family Life
Survey
§ National Team for Acceleration of Poverty Reduction (TNP2K), Office of the Vice President—Republic of Indonesia.
Email: [email protected]
Table of Contents
Figure 1. Raskin participation by log per capita expenditure
Figure 2. Raskin participation by log per capita expenditure: rural and urban
6
Table 2: Descriptive statistics - rural and urban
Table 3: Pooled OLS results for Raskin participation using bottom 30 percent per capita expenditure (PCE) poverty classification
Table 4: Fixed effects results for Raskin participation using bottom 30 percent per capita expenditure (PCE) poverty classification
Table 5: Fixed effects results for Raskin participation using bottom 30 percent per capita expenditure (PCE) poverty classification: rural and urban
24
Table A1: Fixed effects results for Raskin participation using bottom 30 percent per capita income (PCI) poverty classification
Table A2: Fixed effects results for Raskin participation using bottom 30 percent per capita income (PCI) poverty classification: rural and urban
Table A3: Fixed effects results for Raskin participation using subjective ranking poverty classification
Table A4: Fixed effects results for Raskin participation using subjective ranking poverty classification: rural and urban
Table A5: Fixed effects results for Raskin participation using bottom 25 percent per capita expenditure (PCE) poverty classification
Table A6: Fixed effects results for Raskin participation using bottom 35 percent per capita expenditure (PCE) poverty classification
Introduction
In this study, we evaluate the targeting and take up of the Indonesian Raskin (Beras untuk
Keluarga Miskin – Rice for the Poor) program, a national rice price subsidy scheme for poor
households. Raskin is the largest transfer program in terms of government expenditure and
includes participation of about half of all households in the country1. As expenditure on rice
constitutes about 30 percent of a poor household’s monthly budget, a rice assistance scheme could
potentially have a large impact on the wellbeing of the poor. Previous studies on Raskin (including
Hastuti et al. 2008, TNP2K 2015, World Bank 2012) indicate weaknesses in program targeting
and implementation, leading to significant leakage of the rice to the non-poor. However, despite
the known weaknesses in program implementation, the current consensus is that the program is
weakly pro-poor with a large number of non-poor households also benefiting from the program.
Our study expands on the previous findings on the Raskin program by using the Indonesian Family
Life Survey (IFLS) not only to reappraise the issue of targeting, but also to focus on the issue of
program take up. Specifically, our study addresses whether in fact the poorest households are less
likely to participate in the program. While it is clear from previous studies that significant
mistargeting occurs, less is known about program take up by the poor, even those who are properly
targeted. Since this program provides a price subsidy and not a free in-kind transfer, the actual
beneficiaries of such a subsidy scheme are likely to be those who can afford to purchase the rice.
Furthermore, the program requires a lump sum purchase of rice following an irregular distribution
schedule, which is likely to be disadvantageous for the targeted poor as they may not have
sufficient resources to buy large quantities of rice in a single purchase, especially when credit
market imperfections exist.
In this study we evaluate household Raskin participation over the duration of a year using
a broader set of participation measures: the likelihood of any purchase of rice, total quantity of
purchases, the frequency of purchases, and the participation frequency relative to the number of
community distributions of rice. We use household information from the 2000 and 2007 rounds of
the IFLS, and evaluate participation in the year prior to 2007. While the Raskin targeting scheme
and program mechanism have undergone some changes since 2007 with targeting based on a new
1In terms of spending, the Raskin budget has ranged from 6.4 to 21 trillion rupiah (approximately 490 million to 1.6 billion USD
national Unified Database (BDT – Basis Data Terpadu) of the poor, the issues of mistargeting and
ineffective allocation persist (TNP2K 2015, World Bank 2012). The findings from this study,
therefore, remain relevant with respect to the current program.
Our findings show that, contrary to previous thinking, Raskin is in fact regressive among
the poor. Although poor households as a whole are more likely to participate in the program
compared to the non-poor, the poorest in this group benefit less from the program than those with
higher incomes in this group. The poorest households are less likely to participate in the program,
they purchase lower quantities of rice, they purchase rice fewer times per year, and they participate
at a lower frequency with respect to the number of community distributions.
Prior studies have suggested that some of the community-based mistargeting of transfer
programs in Indonesia may be due to people in villages having different perceptions about poverty
that may not be fully captured by expenditure or proxy means measures (Alatas et al. 2012). We
thus supplement our analysis by using a subjective measure of economic wellbeing based on
a household’s self-ranking on a six-step economic ladder. The results remain consistent using
a poverty indicator based on such a self-appraisal of economic ranking in place of household per
capita expenditure. Among households who ranked themselves to be in the bottom two steps of
the ladder, the poorest are less likely to benefit from the program compared to those with higher
expenditures in this group, supporting the finding that program take up among the poor is
regressive in nature.
This paper is organized as follows. The next section provides a brief description of the
Raskin program. Section 3 describes the data, section 4 provides an overview of the empirical
framework, and section 5 presents the regression results. The last section provides a conclusion
and a discussion.
Program Description
Indonesia introduced the Raskin program in 2002 as a replacement for the Special Market
Operations (Operasi Pasar Khusus, OPK) program. The OPK program was part of the social safety
net package initiated after the 1997 Asian financial crisis to aid vulnerable households. The Raskin
program provides 15 to 20 kg of rice per month to poor and near-poor households at prices 75 to
rupiah per kg, substantial variability in actual price existed across regions, e.g., up to 2900 rupiah
per kg in 2006 (Hastuti et al 2008).
With targeted beneficiaries reaching 18.5 million households, Raskin is the largest transfer
program targeting poor households in Indonesia in terms of central government expenditure,
accounting for around half of all targeted social assistance spending as well as non-energy
subsidies. Between 2000 and 2010, the amount of rice allocated for the program averaged 2 million
tons per year (World Bank 2012). The Coordinating Ministry of Social Welfare along with Bulog
(the National Logistics Agency) are the main government bodies responsible for running the
program, especially in planning and determining the yearly allocation of rice and the price at which
the rice is sold to households.
In principle, the program is implemented in the following way. One year prior to
implementation, the program budget is allocated based on the planned beneficiary quota, i.e. the
total number of beneficiaries to receive the program. From the inception of the program until 2012,
the beneficiary quota remained at the initial 18.5 million households. After the approval of the
budget, decisions are made on the beneficiary list, i.e. the list of households that are eligible to
receive the program, with allocation decisions made at the national, district, and village levels.
Bulog is then instructed to procure the rice and is also responsible for delivering the rice to 50,000
dropping points, which are usually at the subdistrict or village level. From each of the dropping
points, it is then the responsibility of village administrations to transport the rice to village
distribution points, where beneficiaries can purchase the rice, or deliver it directly to the
beneficiaries. Beneficiaries can then ‘purchase’ the rice at a subsidized price, which is the
difference between the Bulog purchase price and the value of subsidy provided to Bulog by the
government. For instance, in 2014/2015, the Bulog purchase price was 8600 rupiah per kg, while
the rice was sold to the beneficiaries at 1600 rupiah per kg (approximately USD 0.15 per kg) which
corresponds to a government subsidy of 7000 rupiah per kg.
Like other targeted social transfer programs in Indonesia, the beneficiaries are determined
through a combination of proxy means testing and community targeting. The allocation quota for
various regions is based on the incidence of poverty in those regions. The central government uses
the national list of poor households to determine the regional incidence of poverty and then
on the 2005 Household Socioeconomic Survey (PSE-05) conducted by BPS (Central Bureau of
Statistics). At the local level, village consultative meetings (Mudes) were supposed to determine
the final distribution of Raskin rice to the beneficiaries. However, numerous problems existed in
the implementation of the program at the local level leading to widespread misallocation of the
rice.
The national list of poor households is not perfect and excludes many poor households
since it is based on household assets and other observable characteristics, such as occupation and
education level of the household head, which may not reflect short term changes in the economic
situation of households, thereby providing local bodies the leeway to deviate from the list in
distributing the rice. Furthermore, the 2006-2007 Raskin program guidelines did not mandate that
the local bodies use the list of poor households to determine beneficiaries, nor did it state that the
beneficiaries have to be poor (Hastuti et al. 2008). This has led to a distribution that is not in
alignment with the objectives of the Raskin program. Although the program aims to provide food
security to the poor and near-poor, there is significant leakage of the rice to the non-poor.
Previous qualitative studies focusing on a few regions indicate other weaknesses in
program targeting and implementation (Hastuti et al. 2008). The distribution of rice is irregular in
many regions, especially in places that are harder to reach. Some communities do not receive
enough rice to be distributed to all the poor households. There is variability in distribution schemes,
with some localities distributing rice equally among households and others using a rotational
system where different households become eligible to purchase rice in different distribution cycles.
The frequency of rice distributions may also be well below the stipulated 10-12 times a year in
some localities, especially in more isolated regions. These localities may, subsequently, pool
distributions and increase each household’s rice allocation for each distribution.
Prior studies have also highlighted the issue of the “missing rice”– that is, not all the rice
allocated to the Raskin program reaches the beneficiaries. For the OPK program, the predecessor
of Raskin, Olken (2006) estimated that 17.8 percent of the rice from the Bulog distribution centers
did not reach the beneficiaries. He estimated the amount of rice that the villages actually received
using household responses from the 19981999 Hundred Villages Survey (Survei Seratus Desa
-SSD) along with the 1999 National Social Welfare Survey (Susenas). On the other hand, he
district level Bulog distribution centers. Analyzing the correlates of the missing rice, he found that
villages that are poorer, more ethnically fragmented, and with lower population densities are more
likely to be missing rice.
Data
The Indonesian Family Life Survey (IFLS) is an extensive longitudinal survey, with the
first wave conducted in 1993 which sampled over 7000 households from 13 of the 27 provinces
representing 83% of the population. Subsequent waves interviewed target members of the original
IFLS1 households along with split-off households with over 90 percent re-contact rates. This study
uses the 2000 and 2007 waves of the survey. The sample for the analysis consists of all households
in the original IFLS enumeration areas that were interviewed in the 2000 and 2007 rounds. After
dropping 93 observations with missing values, the final pooled analysis sample consists of 15682
observations: 7390 from 2000 and 8292 from 2007, of which 6425 households were interviewed
in both years.
We evaluate four different measures of household Raskin participation during the year
prior to the 2007 survey: (i) whether the household purchased any rice (a measure of any
participation), (ii) the total quantity of rice (kg) purchased, (iii) the frequency of purchases (number
of times purchased), and (iv) the ratio of the frequency of household purchases to the frequency of
community distributions (hereafter, referred to as the household purchases to community
distributions ratio – HP-CD ratio). Unlike the total quantity and frequency of rice purchases,
which are influenced by variations in both household participation and community distributions,
the last measure captures household participation relative to the number of community
distributions, thereby providing a better measure of household program take up independent of
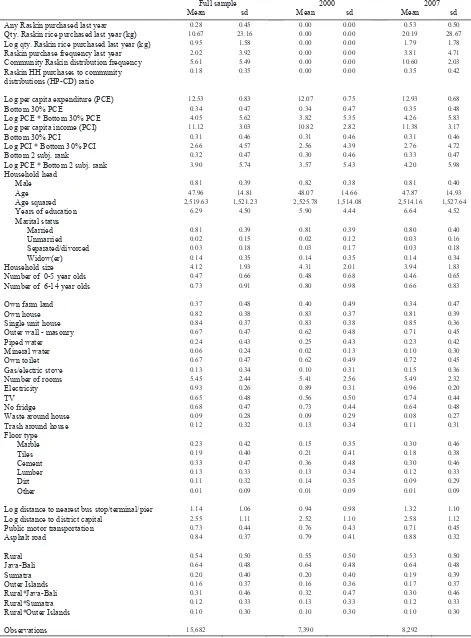
Table 1: Descriptive statistics
Full sample 2000 2007
Mean sd Mean sd Mean sd
Any Raskin purchased last year 0.28 0.45 0.00 0.00 0.53 0.50
Qty. Raskin rice purchased last year (kg) 10.67 23.16 0.00 0.00 20.19 28.67 Log qty. Raskin rice purchased last year (kg) 0.95 1.58 0.00 0.00 1.79 1.78
Raskin purchase frequency last year 2.02 3.92 0.00 0.00 3.81 4.71
Community Raskin distribution frequency 5.61 5.49 0.00 0.00 10.60 2.03 Raskin HH purchases to community
distributions (HP-CD) ratio
0.18 0.35 0.00 0.00 0.35 0.42
Log per capita expenditure (PCE) 12.53 0.83 12.07 0.75 12.93 0.68
Bottom 30% PCE 0.34 0.47 0.34 0.47 0.35 0.48
Log PCE * Bottom 30% PCE 4.05 5.62 3.82 5.35 4.26 5.83
Log per capita income (PCI) 11.12 3.03 10.82 2.82 11.38 3.17
Bottom 30% PCI 0.31 0.46 0.31 0.46 0.31 0.46
Log PCI * Bottom 30% PCI 2.66 4.57 2.56 4.39 2.76 4.72
Bottom 2 subj. rank 0.32 0.47 0.30 0.46 0.33 0.47
Log PCE * Bottom 2 subj. rank 3.90 5.74 3.57 5.43 4.20 5.98
Household head
Male 0.81 0.39 0.82 0.38 0.81 0.40
Age 47.96 14.81 48.07 14.66 47.87 14.93
Age squared 2,519.63 1,521.23 2,525.78 1,514.08 2,514.16 1,527.64
Years of education 6.29 4.50 5.90 4.44 6.64 4.52
Marital status
Married 0.81 0.39 0.81 0.39 0.80 0.40
Unmarried 0.02 0.15 0.02 0.12 0.03 0.16
Separated/divorced 0.03 0.18 0.03 0.17 0.03 0.18
Widow(er) 0.14 0.35 0.14 0.35 0.14 0.34
Household size 4.12 1.93 4.31 2.01 3.94 1.83
Number of 0-5 year olds 0.47 0.66 0.48 0.68 0.46 0.65
Number of 6-14 year olds 0.73 0.91 0.80 0.98 0.66 0.83
Own farm land 0.37 0.48 0.40 0.49 0.34 0.47
Own house 0.82 0.38 0.83 0.37 0.81 0.39
Single unit house 0.84 0.37 0.83 0.38 0.85 0.36
Outer wall - masonry 0.67 0.47 0.62 0.48 0.71 0.45
Piped water 0.24 0.43 0.25 0.43 0.23 0.42
Mineral water 0.06 0.24 0.02 0.13 0.10 0.30
Own toilet 0.67 0.47 0.62 0.49 0.72 0.45
Gas/electric stove 0.13 0.34 0.10 0.31 0.15 0.36
Number of rooms 5.45 2.44 5.41 2.56 5.49 2.32
Electricity 0.93 0.26 0.89 0.31 0.96 0.20
TV 0.65 0.48 0.56 0.50 0.74 0.44
No fridge 0.68 0.47 0.73 0.44 0.64 0.48
Waste around house 0.09 0.28 0.09 0.29 0.08 0.27
Trash around house 0.12 0.32 0.13 0.34 0.11 0.31
Floor type
Marble 0.23 0.42 0.15 0.35 0.30 0.46
Tiles 0.19 0.40 0.21 0.41 0.18 0.38
Cement 0.33 0.47 0.36 0.48 0.30 0.46
Lumber 0.13 0.33 0.13 0.34 0.12 0.33
Dirt 0.11 0.32 0.14 0.35 0.09 0.29
Other 0.01 0.09 0.01 0.09 0.01 0.09
Log distance to nearest bus stop/terminal/pier 1.14 1.06 0.94 0.98 1.32 1.10
Log distance to district capital 2.55 1.11 2.52 1.10 2.58 1.12
Public motor transportation 0.73 0.44 0.76 0.43 0.71 0.45
Asphalt road 0.84 0.37 0.79 0.41 0.88 0.32
Rural 0.54 0.50 0.55 0.50 0.53 0.50
Java-Bali 0.64 0.48 0.64 0.48 0.64 0.48
Sumatra 0.20 0.40 0.20 0.40 0.19 0.39
Outer Islands 0.16 0.37 0.16 0.36 0.17 0.37
Rural*Java-Bali 0.31 0.46 0.32 0.47 0.30 0.46
Rural*Sumatra 0.12 0.33 0.13 0.33 0.12 0.33
Rural*Outer Islands 0.10 0.30 0.10 0.30 0.10 0.30
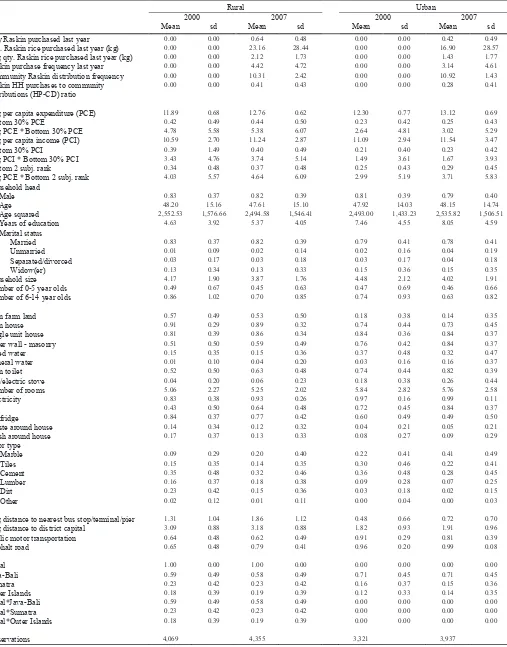
Table 2: Descriptive statistics - rural and urban
Rural Urban
2000 2007 2000 2007
Mean sd Mean sd Mean sd Mean sd Any Raskin purchased last year 0.00 0.00 0.64 0.48 0.00 0.00 0.42 0.49
Qty. Raskin rice purchased last year (kg) 0.00 0.00 23.16 28.44 0.00 0.00 16.90 28.57
Log qty. Raskin rice purchased last year (kg) 0.00 0.00 2.12 1.73 0.00 0.00 1.43 1.77
Raskin purchase frequency last year 0.00 0.00 4.42 4.72 0.00 0.00 3.14 4.61
Community Raskin distribution frequency 0.00 0.00 10.31 2.42 0.00 0.00 10.92 1.43
Raskin HH purchases to community distributions (HP-CD) ratio
0.00 0.00 0.41 0.43 0.00 0.00 0.28 0.41
Log per capita expenditure (PCE) 11.89 0.68 12.76 0.62 12.30 0.77 13.12 0.69
Bottom 30% PCE 0.42 0.49 0.44 0.50 0.23 0.42 0.25 0.43
Log PCE * Bottom 30% PCE 4.78 5.58 5.38 6.07 2.64 4.81 3.02 5.29
Log per capita income (PCI) 10.59 2.70 11.24 2.87 11.09 2.94 11.54 3.47
Bottom 30% PCI 0.39 1.49 0.40 0.49 0.21 0.40 0.23 0.42
Log PCI * Bottom 30% PCI 3.43 4.76 3.74 5.14 1.49 3.61 1.67 3.93
Bottom 2 subj. rank 0.34 0.48 0.37 0.48 0.25 0.43 0.29 0.45
Log PCE * Bottom 2 subj. rank 4.03 5.57 4.64 6.09 2.99 5.19 3.71 5.83
Household head
Male 0.83 0.37 0.82 0.39 0.81 0.39 0.79 0.40
Age 48.20 15.16 47.61 15.10 47.92 14.03 48.15 14.74
Age squared 2,552.53 1,576.66 2,494.58 1,546.41 2,493.00 1,433.23 2,535.82 1,506.51
Years of education 4.63 3.92 5.37 4.05 7.46 4.55 8.05 4.59
Marital status
Married 0.83 0.37 0.82 0.39 0.79 0.41 0.78 0.41
Unmarried 0.01 0.09 0.02 0.14 0.02 0.16 0.04 0.19
Separated/divorced 0.03 0.17 0.03 0.18 0.03 0.17 0.04 0.18
Widow(er) 0.13 0.34 0.13 0.33 0.15 0.36 0.15 0.35
Household size 4.17 1.90 3.87 1.76 4.48 2.12 4.02 1.91
Number of 0-5 year olds 0.49 0.67 0.45 0.63 0.47 0.69 0.46 0.66
Number of 6-14 year olds 0.86 1.02 0.70 0.85 0.74 0.93 0.63 0.82
Own farm land 0.57 0.49 0.53 0.50 0.18 0.38 0.14 0.35
Own house 0.91 0.29 0.89 0.32 0.74 0.44 0.73 0.45
Single unit house 0.81 0.39 0.86 0.34 0.84 0.36 0.84 0.37
Outer wall - masonry 0.51 0.50 0.59 0.49 0.76 0.42 0.84 0.37
Piped water 0.15 0.35 0.15 0.36 0.37 0.48 0.32 0.47
Mineral water 0.01 0.10 0.04 0.20 0.03 0.16 0.16 0.37
Own toilet 0.52 0.50 0.63 0.48 0.74 0.44 0.82 0.39
Gas/electric stove 0.04 0.20 0.06 0.23 0.18 0.38 0.26 0.44
Number of rooms 5.06 2.27 5.25 2.02 5.84 2.82 5.76 2.58
Electricity 0.83 0.38 0.93 0.26 0.97 0.16 0.99 0.11
TV 0.43 0.50 0.64 0.48 0.72 0.45 0.84 0.37
No fridge 0.84 0.37 0.77 0.42 0.60 0.49 0.49 0.50
Waste around house 0.14 0.34 0.12 0.32 0.04 0.21 0.05 0.21
Trash around house 0.17 0.37 0.13 0.33 0.08 0.27 0.09 0.29
Floor type
Marble 0.09 0.29 0.20 0.40 0.22 0.41 0.41 0.49
Tiles 0.15 0.35 0.14 0.35 0.30 0.46 0.22 0.41
Cement 0.35 0.48 0.32 0.46 0.36 0.48 0.28 0.45
Lumber 0.16 0.37 0.18 0.38 0.09 0.28 0.07 0.25
Dirt 0.23 0.42 0.15 0.36 0.03 0.18 0.02 0.15
Other 0.02 0.12 0.01 0.11 0.00 0.04 0.00 0.03
Log distance to nearest bus stop/terminal/pier 1.31 1.04 1.86 1.12 0.48 0.66 0.72 0.70
Log distance to district capital 3.09 0.88 3.18 0.88 1.82 0.93 1.91 0.96
Public motor transportation 0.64 0.48 0.62 0.49 0.91 0.29 0.81 0.39
Asphalt road 0.65 0.48 0.79 0.41 0.96 0.20 0.99 0.08
Rural 1.00 0.00 1.00 0.00 0.00 0.00 0.00 0.00
Java-Bali 0.59 0.49 0.58 0.49 0.71 0.45 0.71 0.45
Sumatra 0.23 0.42 0.23 0.42 0.16 0.37 0.15 0.36
Outer Islands 0.18 0.39 0.19 0.39 0.12 0.33 0.14 0.35
Rural*Java-Bali 0.59 0.49 0.58 0.49 0.00 0.00 0.00 0.00
Rural*Sumatra 0.23 0.42 0.23 0.42 0.00 0.00 0.00 0.00
Rural*Outer Islands 0.18 0.39 0.19 0.39 0.00 0.00 0.00 0.00
Table 1 presents the descriptive statistics for the full 2000 and 2007 pooled sample, as well
as for the separate years. In 2007, 53 percent of households had purchased Raskin rice in the past
year. For the full sample, the average annual quantity of rice purchased was 20 kg and the average
frequency of purchase was 3.81 times per year. On average, there were 10.6 community
distributions per year and the household purchases to community distributions ratio was 0.35.
Table 2 presents the descriptive statistics by rural and urban for the two survey years. Some
variation in Raskin participation exists between urban and rural households. Rural households
were more likely to participate in Raskin, with 64 percent of the sample having purchased rice in
the past year compared to 42 percent of urban households. The average annual quantity of rice
purchased for rural households was 23.16 kg while it was 16.90 kg for urban households, and rural
households purchased rice 4.42 times on average in a year compared to 3.14 times for urban
households. The average number of community distributions is similar between rural and urban
areas (10.31 and 10.92, respectively). However, the household purchases to community
distributions ratio is higher for rural households (0.41 compared to 0.28 for urban households),
suggesting that rural households have fuller participation in the program with respect to the number
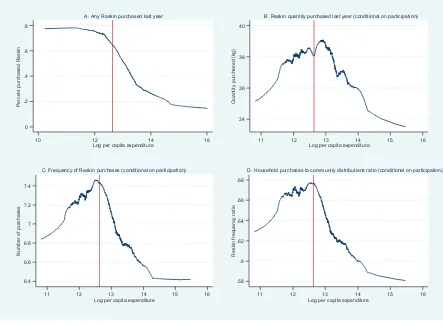
Figure 1: Raskin participation by log per capita expenditure
Notes: The means were computed using a tricube weighting function with a bandwidth of 0.4. The vertical line represents the bottom 30 percent per capita expenditure threshold.
Using the 2007 data, Figure 1 presents the weighted means of the household Raskin
participation measures by log household per capita expenditure (PCE). The weighted means are
computed using a tri-cube weighting function with a bandwidth of 0.4. The vertical line represents
the PCE threshold for the bottom 30 percent. Figure 1A presents the likelihood of any participation
in Raskin, i.e. purchased any Raskin rice in the past year. Figures 1B, 1C, and 1D present
the weighted means, conditional on any participation in the past year, of the total quantity of Raskin
rice purchased, the number of purchases, and the household purchases to community distributions
ratio, respectively.
Figure 1A suggests that the likelihood of any Raskin participation falls with PCE.
The likelihood of any participation among the poorest group is about 80 percent. While
participation declines steadily with rising PCE, a significant portion of non-poor households
0
B. Raskin quantity purchased last year (conditional on participation)
6.4
C. Frequency of Raskin purchases (conditional on participation)
.58
participate in the program. Although overall participation in the program falls with higher PCE,
Figures 1B, 1C, and 1D show that, conditional on participation, the benefits derived from Raskin
increases with PCE among poor households, i.e. those with PCE in the bottom 30 percent. This
suggests a regressive distribution of rice among poor households; higher expenditure households
among the poor are likely to purchase larger quantities of rice, purchase rice more frequently, and
purchase rice with higher frequency with respect to the number of distributions in the community.
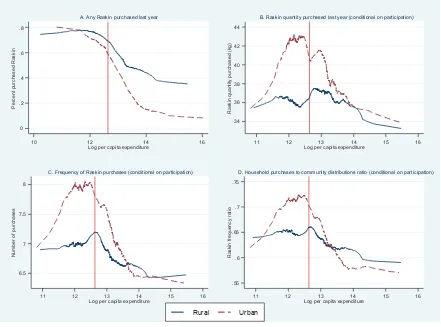
Figure 2: Raskin participation by log per capita expenditure: rural and urban
Notes: The means were computed using a tricube weighting function with a bandwidth of 0.4. The vertical line represents the bottom 30 percent per capita expenditure threshold.
Figure 2 presents the weighted means of the participation measures for rural and urban
households. The figures suggest significant differences in the nature of participation in rural and
urban areas. Figure 2A shows that the likelihood of any Raskin participation with respect to PCE
declines faster in urban areas compared to rural areas. Rural areas have higher Raskin participation
0
B. Raskin quantity purchased last year (conditional on participation)
6.5
C. Frequency of Raskin purchases (conditional on participation)
.55
D. Household purchases to community distributions ratio (conditional on participation)
rates among non-poor households (i.e. those above the bottom 30 percent PCE threshold), with
participation in the 40 percent range for the highest PCE households. The subsequent figures
(Figures 2B, 2C, and 2D) show that, conditional on participation, the benefits derived from Raskin
in urban areas increases substantially with PCE among poor households and then starts to decline
with PCE beyond the bottom 30 percent threshold. This suggests a regressive distribution of rice
among poor households in urban areas. This regressive phenomenon is weaker in rural areas:
conditional on participation, the rice is distributed more equally, both in terms of quantity and
frequency, across a wider range of per capita expenditures.
Empirical Framework
Our general empirical strategy is to relate the Raskin participation measures to household
log per capita expenditure and an indicator for poverty status with additional controls for
household and community characteristics. We run ordinary least square regressions (OLS) using
two different specifications using the 2000 and 2007 pooled household sample:
(1) 𝑅𝑅𝑅𝑅𝑖𝑖𝑖𝑖𝑖𝑖𝑖𝑖 =𝛽𝛽𝛽𝛽0+ 𝛽𝛽𝛽𝛽1𝑙𝑙𝑙𝑙𝑙𝑙𝑙𝑙𝑙𝑙𝑙𝑙𝑙𝑙𝑙𝑙𝑖𝑖𝑖𝑖𝑖𝑖𝑖𝑖+ 𝛽𝛽𝛽𝛽2𝑃𝑃𝑃𝑃𝑃𝑃𝑃𝑃𝑃𝑃𝑃𝑃𝑖𝑖𝑖𝑖𝑖𝑖𝑖𝑖 + 𝜷𝜷𝜷𝜷𝟒𝟒𝟒𝟒𝑿𝑿𝑿𝑿𝒊𝒊𝒊𝒊𝒊𝒊𝒊𝒊 + 𝜇𝜇𝜇𝜇𝑖𝑖𝑖𝑖+ 𝜏𝜏𝜏𝜏2007+𝜀𝜀𝜀𝜀𝑖𝑖𝑖𝑖𝑖𝑖𝑖𝑖
(2) 𝑅𝑅𝑅𝑅𝑖𝑖𝑖𝑖𝑖𝑖𝑖𝑖 =𝛽𝛽𝛽𝛽0+ 𝛽𝛽𝛽𝛽1𝑙𝑙𝑙𝑙𝑙𝑙𝑙𝑙𝑙𝑙𝑙𝑙𝑙𝑙𝑙𝑙+ 𝛽𝛽𝛽𝛽2𝑃𝑃𝑃𝑃𝑃𝑃𝑃𝑃𝑃𝑃𝑃𝑃𝑖𝑖𝑖𝑖𝑖𝑖𝑖𝑖 + 𝛽𝛽𝛽𝛽3𝑙𝑙𝑙𝑙𝑙𝑙𝑙𝑙𝑙𝑙𝑙𝑙𝑙𝑙𝑙𝑙 ∗ 𝑃𝑃𝑃𝑃𝑃𝑃𝑃𝑃𝑃𝑃𝑃𝑃𝑖𝑖𝑖𝑖𝑖𝑖𝑖𝑖 + 𝜷𝜷𝜷𝜷𝟒𝟒𝟒𝟒𝑿𝑿𝑿𝑿𝒊𝒊𝒊𝒊𝒊𝒊𝒊𝒊 + 𝜇𝜇𝜇𝜇𝑖𝑖𝑖𝑖 + 𝜏𝜏𝜏𝜏2007+ 𝜀𝜀𝜀𝜀𝑖𝑖𝑖𝑖𝑖𝑖𝑖𝑖
where Ritis the Raskin participation measure of household iin period t.𝑙𝑙𝑙𝑙𝑙𝑙𝑙𝑙𝑙𝑙𝑙𝑙𝑙𝑙𝑙𝑙𝑖𝑖𝑖𝑖𝑖𝑖𝑖𝑖is the household log
per capita expenditure and POVit is the poverty indicator. Xit is the vector of household and
community characteristics. 𝜏𝜏𝜏𝜏2007is a dummy for the year 2007. As Figure 2 suggests variations in
Raskin participation among rural and urban areas, we first run the regressions for the full sample
and then separately for rural and urban households. We compute robust standard errors to correct
for potential heteroscedasticity. We also run the regressions with household fixed effects (µi) to
account for unobserved time invariant household characteristics. Particularly, we are concerned
about unobserved heterogeneity at the household level related to the selection of beneficiaries;
besides using PMT-related indicators, the selection of beneficiaries also relied on input from
village leaders. In addition, since our sample is restricted to households who are in the original
IFLS enumeration areas, taking household fixed effects will also account for time invariant
We evaluate two aspects of program participation among the poor: 1) whether the program
is pro-poor overall (i.e. whether the poor are more likely to participate compared to the non-poor)
and 2) whether program participation is uniform among the poor. Specification (1) above is used
to evaluate the first aspect of program participation and the coefficient on the poverty indicator,
β2, will indicate whether the poor overall are more likely to participate. Specification (2) includes
an interaction term between log per capita expenditure and the poverty indicator. The coefficients
on the poverty indicator, β2, and on the interaction term, β3, will provide insights about program
participation among the poor. A positive coefficient on the interaction term will imply that program
participation among the poor is regressive, i.e. those with higher per capita expenditures have
higher program participation.
The regressions control for an extensive set of households characteristics. We include
household head characteristics (gender, age, education, marital status), household size, number of
children in the household under 15 years old, ownership of farm land, household living conditions
(such as house ownership, single unit house, number of rooms, type of outer wall and floor, source
of drinking water, own toilet, gas or electric stove, electricity, no fridge, waste and trash around
house). Some of these household characteristics are typically used to generate the poverty
classification through proxy means testing and their inclusion will control for observable
characteristics used to determine program targeting.2
We include community characteristics that reflect the accessibility of the community and
its transportation infrastructure development. As Raskin distributions are thought to be affected by
the distance of the community from the Bulog distribution center, we control for the distance of
the community from the district headquarter. We also account for other factors that could
potentially affect the transaction costs of transferring the rice from the distribution center to
households, such as the distance to the nearest bus stop/terminal/pier, whether the community has
2After the Asian Financial Crisis in 1997/98, Indonesia launched Social Safety Net programs targeting the poor and vulnerable
population. These programs constituted the country’s first generation of targeted programs and operated in five major sectors: food security, employment creation, education, health, and community empowerment (Sumarto and Bazzi 2014). They were replaced by the second generation targeted programs which used proxy means testing (PMT) for the first time to generate the list of eligible households. The first PMT was based on the 2005 Household Socioeconomic Survey (PSE-05). Subsequently, the PMTs were
updated using the 2008 and 2011 rounds of the PPLS (Pendataan Program Perlindungan Social– Data Collection for Social
an asphalt main road, and whether the community has any motorized public transportation (three
wheel, four wheel, or boat) based on the responses from the community questionnaire.
Given the geographical heterogeneity of Indonesia, program participation and distribution
schemes are likely to differ across regions. The provinces in Java and Bali are more densely
populated with better infrastructure compared to those in Sumatra and the Outer Islands3.
Accordingly, we include dummies for Sumatra and Outer Islands along with their interactions with
the rural dummy to account for the heterogeneity of program participation across geographical
regions.
Results
Full sample results
Table 3 and Table 4 present the pooled OLS results with and without household
fixed-effects, respectively, for the four different measures of Raskin participation in the past year. In
each table, column 1 presents the results for any participation, column 2 for the quantity of Raskin
rice purchased, column 3 for the frequency of purchases, and column 4 for the household purchases
to community distributions (HP-CD) ratio. For each participation measure, the first sub-column
presents results for the specification with log per capita expenditure (PCE) and the bottom 30
percent PCE poverty indicator without an interaction between the two variables. The second
sub-column adds an interaction of log PCE and the poverty indicator to the previous specification. In
the first specification without the PCE-poverty interaction term, the coefficient on the poverty
indicator indicates whether the program overall is pro-poor, i.e. whether the poor as a whole have
higher program participation compared to the non-poor. Including the PCE-poverty interaction
term allows us to make inferences about regressive program participation among the poor.
Controls for household and community characteristics along with rural and regional dummies are
included in all regressions, but are not reported in the tables.
3The IFLS sample consists of five provinces in Java - West Java, Jakarta, Central Java, Yogyakarta, and West Java – while Bali
Table 3: Pooled OLS results for Raskin participation using bottom 30 percent per capita expenditure (PCE) poverty classification
1. Any purchase 2. Log quantity purchased (kg)
3. Purchase frequency
4. HP-CD ratio
(a) (b) (c) (d) (e) (f) (g) (h)
VARIABLES Coeff Coeff Coeff Coeff Coeff Coeff Coeff Coeff
Log PCE -0.041*** -0.082*** -0.143*** -0.280*** -0.377*** -0.707*** -0.029*** -0.052*** (0.008) (0.008) (0.026) (0.029) (0.069) (0.078) (0.005) (0.006) Bottom 30% PCE 0.039*** -2.417*** 0.127*** -8.159*** 0.338*** -19.635*** 0.020*** -1.373***
(0.010) (0.138) (0.035) (0.523) (0.094) (1.554) (0.007) (0.118)
Log PCE*Bottom 30% PCE 0.204*** 0.690*** 1.663*** 0.116***
(0.012) (0.045) (0.135) (0.010)
Year 2007 0.590*** 0.558*** 1.977*** 1.871*** 4.346*** 4.088*** 0.318*** 0.301*** (0.021) (0.021) (0.077) (0.076) (0.215) (0.210) (0.017) (0.016)
Observations 15,682 15,682 15,682 15,682 15,682 15,682 15,682 15,682
R-squared 0.452 0.467 0.428 0.442 0.324 0.338 0.517 0.525
HH characteristics YES YES YES YES YES YES YES YES
Community characteristics YES YES YES YES YES YES YES YES
HH fixed effects NO NO NO NO NO NO NO NO
The pooled OLS results in Table 3 suggest that while overall participation falls with
household PCE, participation among the poor increases with household PCE. The results for any
Raskin purchase from the first specification (without the poverty-PCE interaction) suggest that
poor households are 3.9 percentage points more likely to participate in the program over the course
of the year compared to the non-poor after controlling for observable characteristics. Including the
poverty-PCE interaction term, however, leads to a negative coefficient on the poverty indicator
and a positive coefficient on the interaction term, both of which are significant at the 1 percent
level (column 2). This suggests a regressive participation among the poor with the likelihood of
program participation increasing with PCE among the poor.
The same patterns are observed for participation measures that capture the intensity of
program participation. Among the poor, the poorest households purchase lower quantities of
Raskin rice and purchase the rice fewer times over the year. These results suggest that program
misallocation has additional distributional consequences besides leakage to the non-poor.
Regressive participation among the poorest suggests that the most vulnerable households may not
be deriving the intended benefits from the program.
The quantity and frequency of purchases provide insights into the intensity of household
program participation. However, the variations in these participation measures could be due to
differences in community distribution and targeting schemes besides differences in household take
up decisions. The household purchases to community distributions ratio (HP-CD ratio), on the
other hand, provides a better measure of household take up choices that accounts for variations in
community distribution schemes. In the first regression specification without the PCE-poverty
interaction term, the coefficient on the poverty indicator is positive suggesting overall the poor
receive rice more frequently than the non-poor within a community. However, including the
PCE-poverty interaction term indicates that program take up among the poor is regressive, with the
poorest households in this group likely to purchase the subsidized rice at a lower frequency relative
Table 4: Fixed effects results for Raskin participation using bottom 30 percent per capita expenditure (PCE) poverty classification
1. Any purchase 2. Log quantity purchased (kg)
3. Purchase frequency 4. HP-CD ratio
(a) (b) (c) (d) (e) (f) (g) (h)
VARIABLES Coeff Coeff Coeff Coeff Coeff Coeff Coeff Coeff
Log PCE -0.013 -0.086*** -0.032 -0.287*** -0.073 -0.682*** -0.009 -0.064*** (0.021) (0.023) (0.074) (0.079) (0.200) (0.212) (0.018) (0.020) Bottom 30% PCE 0.013 -3.597*** 0.047 -12.467*** 0.081 -29.878*** 0.007 -2.690***
(0.024) (0.374) (0.086) (1.394) (0.225) (4.072) (0.020) (0.360)
Log PCE*Bottom 30% PCE 0.300*** 1.039*** 2.488*** 0.224***
(0.031) (0.117) (0.340) (0.030)
Year 2007 0.556*** 0.518*** 1.892*** 1.760*** 3.972*** 3.657*** 0.370*** 0.341*** (0.038) (0.038) (0.139) (0.138) (0.400) (0.389) (0.039) (0.038)
Observations 15,682 15,682 15,682 15,682 15,682 15,682 15,682 15,682
R-squared 0.588 0.615 0.558 0.584 0.456 0.482 0.462 0.487
Number of households 9,290 9,290 9,290 9,290 9,290 9,290 9,290 9,290
HH characteristics YES YES YES YES YES YES YES YES
Community characteristics YES YES YES YES YES YES YES YES
HH fixed effects YES YES YES YES YES YES YES YES
Accounting for unobserved heterogeneity by including household fixed effects does not
change the results on regressive participation among the poor (Table 4). This specification
accounts for time-invariant unobserved household specific characteristics that could be correlated
with program participation and household per capita expenditure. We still find a positive and
significant coefficient for the PCE-poverty interaction term suggesting regressive participation
among the poor for all participation measures. In comparison to the previous pooled OLS results,
the fixed effects results differ in the first specifications without the PCE-poverty interaction term.
Both PCE and the poverty dummy lose significance in this specification. However, after
incorporating the poverty-PCE interaction term, all coefficients are statistically significant with
larger point estimates, suggesting greater regressive participation among the poorest than implied
by the pooled OLS results without household fixed effects.
Rural vs. urban
Table 5 presents fixed effects results separately for rural and urban areas. For each of the
four Raskin participation measures, we only present the results for the specification that includes
Table 5: Fixed effects results for Raskin participation using bottom 30 percent per capita expenditure (PCE) poverty classification: rural and urban
Log PCE -0.091*** -0.286** -0.670** -0.065** -0.051 -0.192* -0.473* -0.040 (0.033) (0.115) (0.328) (0.031) (0.031) (0.112) (0.283) (0.025) Bottom 30% PCE -2.370*** -7.618*** -18.458*** -1.634*** -5.057*** -18.839*** -47.381*** -4.220***
(0.522) (1.871) (5.327) (0.457) (0.588) (2.292) (7.079) (0.640) Log PCE*Bottom 30% PCE 0.195*** 0.628*** 1.519*** 0.134*** 0.425*** 1.580*** 3.973*** 0.354***
(0.043) (0.156) (0.443) (0.038) (0.049) (0.189) (0.587) (0.053) Year 2007 0.619*** 2.090*** 4.199*** 0.404*** 0.411*** 1.406*** 3.134*** 0.277***
(0.059) (0.211) (0.600) (0.059) (0.051) (0.181) (0.519) (0.048)
Observations 8,424 8,424 8,424 8,424 7,258 7,258 7,258 7,258
R-squared 0.688 0.652 0.539 0.547 0.518 0.501 0.436 0.441
Number of households 5,106 5,106 5,106 5,106 4,628 4,628 4,628 4,628
HH characteristics YES YES YES YES YES YES YES YES
Community characteristics YES YES YES YES YES YES YES YES
HH fixed effects YES YES YES YES YES YES YES YES
The findings on program participation with respect to per capita expenditure and the
poverty indicator in both rural and urban areas are similar to those for the full sample: overall,
participation falls with higher per capita expenditure, but among the poor, participation is
regressive as it increases with per capita expenditure. The coefficient on log PCE is negative and
statistically significant for all participation measures for rural areas, but loses significance for the
likelihood of any purchase and the HP-CD ratio for urban areas. The coefficient on the
poverty-PCE interaction term, on the other hand, is positive and significant at the 1 percent level for all
participation measures for both rural and urban areas.
Comparing the rural and urban regression results, the urban areas have a more regressive
participation among the poor. For the urban regressions, the coefficients for both the PCE poverty
indicator and the PCE-poverty interaction term are of greater magnitude compared to the rural
regressions. This suggests that urban areas have a steeper increase in participation with respect to
PCE among the poor. For instance, in the results for any Raskin participation in the last year, the
coefficient on the PCE poverty indicator is -2.37 for rural and -5.06 for urban, while the coefficient
on the interaction term is 0.20 for rural and 0.43 for urban. This pattern holds for the other three
Raskin participation measures.
Robustness checks
So far we have used a poverty classification based on whether a household is in the bottom
30 percent of the per capita expenditure distribution. We use this classification as the Indonesian
government defines official poverty using household per capita expenditure and targeted social
protection programs to approximately 30 percent of the population during the evaluation period.
Another advantage of using household expenditure instead of household income as a measure of
household wellbeing is that the former is a less volatile measure. In less-developed countries,
household income for the poor is likely to vary significantly from one month to the next due to
seasonality of agricultural income and the unpredictability of employment and earnings in the
informal sector. Household expenditures, on the other hand, can be a better proxy for permanent
income due to consumption smoothing by households.
However, since program distribution at the local level may be based on different notions
classifications. First, we conduct robustness checks for poverty classifications using other welfare
measures besides per capita expenditure. Second, we check if the results hold for poverty
classifications using different threshold values of per capita expenditure.
We first test whether our results hold when using a poverty classification based on monthly
household per capita income (PCI) instead of per capita expenditure. We define the poor as those
in the bottom 30 percent of the PCI distribution. The results are consistent with those using the
PCE poverty classification—overall participation falls with per capita income, but among those in
the bottom 30 percent, participation increases with higher income, suggesting regressive
participation for all four participation measures (see Table A1 in the Appendix). However, the
coefficients on the poverty dummy and the PCI-poverty interaction term are smaller with respect
to the results using the PCE poverty classification.
Program allocation at the local level may also be based on local perceptions about poverty
using additional information about household living conditions not fully captured by per capita
expenditure or per capita income. To test that the results on regressive participation are not purely
due to communities using different poverty criteria for targeting based on local information, but
also due to low take up by the poorest, we test whether regressive participation holds when we
define poverty based on subjective self-appraisal by households. We classify a household as poor
if it ranked itself in the bottom two steps of a six-step economic ladder. Approximately 30 percent
of the sample classified itself to be in the bottom two steps. Once again, the results are consistent
with regressive participation among the poor (Table A3 in the Appendix). Among those who
classified themselves in the bottom two-steps, participation increases with higher per capita
expenditure. As in the case with the PCI poverty classification, the parameter estimates are smaller
than those estimated using the PCE poverty classification. These results further suggest that the
regressive participation is not only due to targeting errors, but due to low take up among the poorest
households.
We also test whether the results are sensitive to our choice of poverty threshold. We run
separate regressions using different poverty thresholds, defining a household as poor if it is in the
bottom 25 percent, bottom 35 percent, and bottom 40 percent of the PCE distribution. The results
do not change with any of these poverty thresholds, with participation rising among the poor for
higher per capita expenditure for all participation measures.
Conclusion
In this paper, we evaluated household Raskin program participation over the duration of a
year along four measures: i) any participation, ii) quantity of rice purchases, iii) frequency of
purchases, and iv) frequency of purchases relative to the number of community distributions.
Using the pooled sample of households from the 2000 and 2007 rounds of the IFLS, we found that
while the program is pro-poor overall, i.e. the poor as a whole are likely to have higher participation
than the non-poor, the program is regressive among the poor – the poorest have lower participation
than those with higher per capita expenditures within this group. The poorest are less likely to have
any participation in the program, they purchase lower quantities of rice, purchase rice fewer times
per year, and participate at lower rates with respect to the number of community distributions.
Furthermore, there is variation in program participation between poor households in rural areas
and those in urban areas - the regressive phenomenon among the poor is stronger among urban
households. While the regressive participation among the poorest is still prevalent in rural areas,
the program is more equitably distributed, not only among poor households, but also among
non-poor households across a wider range of per capita expenditures.
As Raskin is the largest government transfer program in Indonesia, the findings from this
research have important policy implications. While our findings reinforce earlier findings about
mistargeting and leakage to the non-poor, our research also shows that the most vulnerable
households may not be deriving the intended benefits from the program. Further research is needed
to ascertain the factors that contribute towards low program take up among the poorest households.
The findings on regressive participation among the poor provide additional justification for
reforms in the program’s rice distribution mechanism. The current mechanism requires the
beneficiaries to make a lump sum purchase of rice at subsidized price once a month, often with
irregular distribution schedules. This, among other factors, may explain why the targeted poor
households who are resource-constrained receive lower quantities of Raskin rice than what is
The findings in this paper provide support for switching the program from a rice subsidy
scheme to a full social assistance scheme by removing the lump-sum payment requirement.
Furthermore, switching from an in-kind transfer program towards a cash transfer program where
the beneficiaries receive an equivalent value in the form of a restricted cash assistance is likely to
be welfare enhancing for the poorest households. These changes will arguably be more effective
in improving the welfare of the poor by providing them the flexibility to purchase food items they
want at the quantity they need without requiring them to allocate resources to make the purchase.
Our findings, therefore, provide additional support for ongoing program reforms. In 2017,
the Government of Indonesia piloted food vouchers in a number of cities as a way to reform
Raskin. The new program electronically transfers program benefits directly to the bank accounts
of the beneficiaries, who can then use the transfers to purchase rice and other pre-determined food
items at market prices in local shops. Such new program features are likely to address some of the
References
Alatas, Vivi, Abhijit Banerjee, Rema Hanna, Benjamin A. Olken, and Julia Tobias (2012). "Targeting the Poor: Evidence from a Field Experiment in Indonesia." American Economic
Review102(4): 1206-1240
Bah, Adama, Suahasil Nazara, and Elan Satriawan (2015). "Indonesia's Single Registry Program for Social Protection Programmes." International Policy Center for Inclusive Growth Research Brief49.
Banerjee, Abhijit, Rema Hanna, Jordan Kyle, Benjamin A. Olken, and Sudarno Sumarto (2015). The Power of Transparency: Information, Identification Cards, and Food Subsidy Program in Indonesia. TNP2K Working Papers. Jakarta, Indonesia.
Hastuti et al. (2008). The Effectiveness of the Raskin Program. Jakarta, Indonesia, The Smeru Research Institute.
Olken, Benjamin A. (2006). "Corruption and the Costs of Redistribution: Micro Evidence from Indonesia." Journal of Public Economics90: 853-870.
Strauss, John, Firman Witoelar, Bondan Sikoki, and Anna Marie Wattie (2009). The Fourth Wave of the Indonesia Family Life Survey: Overview and Field Report.
Sumarto, Sudarno, and Sam Bazzi (2014). Social Protection in Indonesia: Past Experience and Lessons for the Future. Munich Personal RePec Archive Paper
SurveyMETER (2011). Laporan Studi Kualitatif Efektifitas Disain dan Implementasi Program Raskin. Jakarta, Indonesia.
SurveyMETER (2011). Studi Efektifitas Disain dan Implementasi Program Raskin. Jakarta, Indonesia.
TNP2K (2015). Lessons from Pilot of New Mechanism of Raskin 2012-2013: Findings from Field Monitoring. Jakarta, Indonesia, TNP2K.
TNP2K (2015). Raskin: The Challenge of Improving Programme Effectiveness. Jakarta, Indonesia, TNP2K.
APPENDIX
Table A1: Fixed effects results for Raskin participation using bottom 30 percent per capita income (PCI) poverty classification
1. Any purchase 2. Log quantity purchased (kg)
3. Purchase frequency
4. HP-CD ratio
(a) (b) (c) (d) (e) (f) (g) (h)
VARIABLES Coeff Coeff Coeff Coeff Coeff Coeff Coeff Coeff
Log PCI 0.004 -0.074*** 0.011 -0.232*** 0.012 -0.561*** 0.001 -0.052*** (0.003) (0.016) (0.013) (0.055) (0.035) (0.142) (0.003) (0.013) Bottom 30% PCI 0.026 -0.967*** 0.065 -3.033*** 0.229 -7.081*** 0.021 -0.649***
(0.023) (0.190) (0.083) (0.675) (0.230) (1.787) (0.021) (0.161)
Log PCI*Bottom 30% PCI 0.084*** 0.263*** 0.620*** 0.057***
(0.016) (0.058) (0.152) (0.014)
Year 2007 0.543*** 0.573*** 1.859*** 1.955*** 3.891*** 4.119*** 0.361*** 0.381*** (0.033) (0.034) (0.122) (0.126) (0.352) (0.367) (0.034) (0.036)
Observations 15,682 15,682 15,682 15,682 15,682 15,682 15,682 15,682
R-squared 0.588 0.594 0.557 0.562 0.455 0.460 0.461 0.466
Number of households 9,290 9,290 9,290 9,290 9,290 9,290 9,290 9,290
HH characteristics YES YES YES YES YES YES YES YES
Community characteristics YES YES YES YES YES YES YES YES
HH fixed effects YES YES YES YES YES YES YES YES
25
Table A2: Fixed effects results for Raskin participation using bottom 30 percent per capita income (PCI) poverty classification: rural and urban
1. Rural 2. Urban
(a) (b) (c) (d) (e) (f) (g) (h)
Any purchase Log quantity Purchase
frequency
HP-CD ratio Any purchase Log quantity Purchase
frequency
HP-CD ratio
VARIABLES
Log PCI -0.061** -0.193** -0.485** -0.044* -0.068*** -0.210** -0.562*** -0.049***
(0.026) (0.092) (0.241) (0.023) (0.022) (0.082) (0.209) (0.018)
Bottom 30% PCI -0.799** -2.522** -6.165** -0.543** -0.895*** -2.773*** -7.205*** -0.640***
(0.312) (1.100) (2.940) (0.265) (0.280) (1.037) (2.685) (0.235)
Log PCI*Bottom 30% PCI 0.070*** 0.221** 0.554** 0.049** 0.077*** 0.236*** 0.613*** 0.055***
(0.027) (0.094) (0.250) (0.023) (0.024) (0.088) (0.227) (0.020)
Year 2007 0.638*** 2.158*** 4.374*** 0.414*** 0.503*** 1.724*** 3.945*** 0.350***
(0.050) (0.187) (0.511) (0.051) (0.052) (0.187) (0.579) (0.054)
Observations 8,424 8,424 8,424 8,424 7,258 7,258 7,258 7,258
R-squared 0.681 0.646 0.534 0.542 0.470 0.445 0.379 0.383
Number of households 5,106 5,106 5,106 5,106 4,628 4,628 4,628 4,628
HH characteristics YES YES YES YES YES YES YES YES
Community characteristics YES YES YES YES YES YES YES YES
HH fixed effects YES YES YES YES YES YES YES YES
Table A3: Fixed effects results for Raskin participation using subjective ranking poverty classification
1. Any purchase 2. Log quantity purchased (kg)
3. Purchase frequency 4. HP-CD ratio
(a) (b) (c) (d) (e) (f) (g) (h)
VARIABLES Coeff Coeff Coeff Coeff Coeff Coeff Coeff Coeff
Log PCE -0.018 -0.059*** -0.050 -0.189** -0.099 -0.388** -0.011 -0.040** (0.020) (0.021) (0.070) (0.076) (0.181) (0.193) (0.017) (0.018) Bottom 2 subj. rank 0.019 -1.573*** 0.077 -5.355*** 0.209 -11.080*** 0.024 -1.119***
(0.019) (0.246) (0.070) (0.851) (0.190) (2.328) (0.017) (0.215)
Log PCE* Bottom 2 subj. rank 0.129*** 0.441*** 0.916*** 0.093***
(0.020) (0.070) (0.191) (0.018)
Year 2007 0.560*** 0.557*** 1.906*** 1.895*** 3.989*** 3.967*** 0.370*** 0.368*** (0.039) (0.039) (0.141) (0.141) (0.392) (0.391) (0.039) (0.039)
Observations 15,682 15,682 15,682 15,682 15,682 15,682 15,682 15,682
R-squared 0.589 0.597 0.558 0.566 0.456 0.462 0.462 0.469
Number of households 9,290 9,290 9,290 9,290 9,290 9,290 9,290 9,290
HH characteristics YES YES YES YES YES YES YES YES
Community characteristics YES YES YES YES YES YES YES YES
HH fixed effects YES YES YES YES YES YES YES YES
27
Table A4: Fixed effects results for Raskin participation using subjective ranking poverty classification: rural and urban
1. Rural 2. Urban
Log PCE -0.065** -0.212** -0.366 -0.042 -0.032 -0.111 -0.262 -0.023
(0.030) (0.106) (0.287) (0.028) (0.032) (0.115) (0.292) (0.026)
Bottom 2 subj. rank -1.482*** -5.084*** -8.764*** -0.938*** -1.500*** -5.383*** -13.534*** -1.262***
(0.348) (1.196) (3.309) (0.310) (0.442) (1.539) (3.967) (0.351)
Log PCE* Bottom 2 subj. rank 0.122*** 0.421*** 0.738*** 0.079*** 0.124*** 0.443*** 1.111*** 0.104***
(0.029) (0.099) (0.275) (0.026) (0.036) (0.124) (0.320) (0.028)
Year 2007 0.638*** 2.148*** 4.316*** 0.412*** 0.462*** 1.593*** 3.599*** 0.318***
(0.058) (0.215) (0.579) (0.058) (0.054) (0.192) (0.560) (0.052)
Observations 8,424 8,424 8,424 8,424 7,258 7,258 7,258 7,258
R-squared 0.684 0.650 0.534 0.544 0.473 0.450 0.384 0.389
Number of households 5,106 5,106 5,106 5,106 4,628 4,628 4,628 4,628
HH characteristics YES YES YES YES YES YES YES YES
Community characteristics YES YES YES YES YES YES YES YES
HH fixed effects YES YES YES YES YES YES YES YES
Table A5: Fixed effects results for Raskin participation using bottom 25 percent per capita expenditure (PCE) poverty classification
1. Any purchase 2. Log quantity purchased (kg)
3. Purchase frequency 4. HP-CD ratio
(a) (b) (c) (d) (e) (f) (g) (h)
VARIABLES Coeff Coeff Coeff Coeff Coeff Coeff Coeff Coeff
Log PCE -0.016 -0.071*** -0.051 -0.240*** -0.131 -0.564*** -0.013 -0.052*** (0.021) (0.022) (0.072) (0.078) (0.200) (0.212) (0.018) (0.020) Bottom 25% PCE 0.008 -3.448*** 0.007 -11.925*** -0.045 -27.468*** -0.003 -2.476***
(0.025) (0.393) (0.089) (1.469) (0.236) (4.208) (0.021) (0.375)
Log PCE*Bottom 25% PCE 0.290*** 1.001*** 2.301*** 0.207***
(0.033) (0.124) (0.354) (0.032)
Year 2007 0.559*** 0.522*** 1.910*** 1.781*** 4.027*** 3.732*** 0.374*** 0.347*** (0.039) (0.039) (0.142) (0.140) (0.407) (0.398) (0.040) (0.039)
Observations 15,682 15,682 15,682 15,682 15,682 15,682 15,682 15,682
R-squared 0.588 0.611 0.558 0.580 0.456 0.476 0.461 0.482
Number of households 9,290 9,290 9,290 9,290 9,290 9,290 9,290 9,290
HH characteristics YES YES YES YES YES YES YES YES
Community characteristics YES YES YES YES YES YES YES YES
HH fixed effects YES YES YES YES YES YES YES YES
29
Table A6: Fixed effects results for Raskin participation using bottom 35 percent per capita expenditure (PCE) poverty classification
1. Any purchase 2. Log quantity
purchased (kg)
3. Purchase
frequency
4. HP-CD ratio
(a) (b) (c) (d) (e) (f) (g) (h)
VARIABLES Coeff Coeff Coeff Coeff Coeff Coeff Coeff Coeff
Log PCE -0.008 -0.099*** -0.022 -0.336*** -0.007 -0.758*** -0.004 -0.072***
(0.021) (0.023) (0.073) (0.080) (0.195) (0.209) (0.018) (0.019)
Bottom 35% PCE 0.022 -3.620*** 0.064 -12.606*** 0.206 -30.064*** 0.016 -2.717***
(0.023) (0.354) (0.083) (1.317) (0.221) (3.836) (0.019) (0.334)
Log PCE*Bottom 35% PCE 0.299*** 1.042*** 2.489*** 0.225***
(0.029) (0.110) (0.318) (0.028)
Year 2007 0.552*** 0.515*** 1.883*** 1.754*** 3.912*** 3.604*** 0.365*** 0.338***
(0.039) (0.039) (0.140) (0.138) (0.394) (0.384) (0.039) (0.038)
Observations 15,682 15,682 15,682 15,682 15,682 15,682 15,682 15,682
R-squared 0.588 0.617 0.558 0.586 0.456 0.484 0.462 0.490
Number of households 9,290 9,290 9,290 9,290 9,290 9,290 9,290 9,290
HH characteristics YES YES YES YES YES YES YES YES
Community characteristics YES YES YES YES YES YES YES YES
HH fixed effects YES YES YES YES YES YES YES YES
Table A7: Fixed effects results for Raskin participation using bottom 40 percent per capita expenditure (PCE) poverty classification
1. Any purchase 2. Log quantity purchased (kg)
3. Purchase frequency
4. HP-CD ratio
(a) (b) (c) (d) (e) (f) (g) (h)
VARIABLES Coeff Coeff Coeff Coeff Coeff Coeff Coeff Coeff
Log PCE -0.007 -0.110*** -0.020 -0.373*** 0.034 -0.802*** 0.000 -0.076*** (0.022) (0.024) (0.076) (0.085) (0.199) (0.219) (0.018) (0.020) Bottom 40% PCE 0.023 -3.513*** 0.066 -12.041*** 0.279 -28.368*** 0.024 -2.586***
(0.025) (0.342) (0.090) (1.268) (0.239) (3.683) (0.023) (0.320)
Log PCE*Bottom 40% PCE 0.288*** 0.986*** 2.333*** 0.213***
(0.028) (0.104) (0.301) (0.026)
Year 2007 0.551*** 0.517*** 1.881*** 1.767*** 3.877*** 3.607*** 0.361*** 0.337*** (0.040) (0.040) (0.144) (0.143) (0.397) (0.388) (0.038) (0.037)
Observations 15,682 15,682 15,682 15,682 15,682 15,682 15,682 15,682
R-squared 0.588 0.616 0.558 0.584 0.456 0.482 0.462 0.488
Number of households 9,290 9,290 9,290 9,290 9,290 9,290 9,290 9,290
HH characteristics YES YES YES YES YES YES YES YES
Community characteristics YES YES YES YES YES YES YES YES
HH fixed effects YES YES YES YES YES YES YES YES
We evaluate household participation in the Indonesian Raskin program, a national rice price subsidy program for the poor. Using a household panel from the 2000 and 2007 rounds of the Indonesian Family Life Survey (IFLS), we evaluate program participation over the duration of the year prior to the 2007 survey using four different measures of participation. We find that although the poor as a whole are likely to have higher levels of participation compared to the non-poor, program participation is regressive among the poor. The poorest households are less likely to purchase Raskin rice over the course of a year, and conditional on participation, they are likely to purchase lower quantities of rice, purchase rice with lower frequency, and have lower participation relative to the number of community distributions. We also find that this regressive participation among the poorest households is more severe in urban areas.
THE NATIONAL TEAM FOR THE ACCELERATION OF POVERTY REDUCTION
Office of the Vice President of the Republic of Indonesia Jl. Kebon Sirih No. 14, Jakarta Pusat 10110