Yosi Kristian,
Member
,
IAENG
, Hideya Takahashi, I Ketut Eddy Purnama, Kayo Yoshimoto,
Esther Irawati Setiawan, Elizeus Hanindito, Mauridhi Hery Purnomo,
Member
,
IAENG
Abstract—Infants are unable to communicate pain, they cry to express their pain. In this paper we describe the most effective feature for infant facial pain classification. The image dataset was classified by medical doctors and nurses based on cortisol hormone difference and FLACC (Face, Legs, Activity, Cry, Consolability) measurement. In this paper we try a number of features based on Action Unit (AU) for infant facial pain classification and discover that the best features are combination between geometrical and textural features. We trained our own Active Shape Model (ASM) and extracted the geometrical features based on landmark points found by our ASM. The textural features are extracted using Local Binary Patterns (LBP) from multiple facial patches. We also experiment with two stage pain classification preceded by a cry detection system, and concluded that this scenario combined with geometrical and textural feature produce a very high F1 score for infant facial pain classification.
Index Terms—Infant facial pain classification, infant facial expression, infant cry detection, facial geometrical features, facial textural features.
I. INTRODUCTION
A
DULT communicate their pain in many ways [1]. One of the popular method to measure pain is by patient self-report because no special skills of advanced technology are needed [2]. While useful this method could not be use for infants because they unable to speak to report their pain experience.To detect pain on infants, we can rely on their facial expressions as one of the best data source. Compared to behavioral and psychological reponses, facial expressions for pain are more specific and consistent [3]. This is why in many infant pain measurement instrument such as CRIES [4], FLACC (Face, Legs, Activity, Cry, and Consolability) [5], and MIPS (Modified Infant Pain Scale) [6] are focused on infant facial expressions. In Indonesian hospitals, FLACC
Manuscript received October 24, 2016; manuscript revised February 17, 2017.
Yosi Kristian, I Ketut Eddy Purnama, Esther Irawati Setiawan and Mauridhi Hery Purnomo, are with the Department of Electrical Engi-neering, Institut Teknologi Sepuluh Nopember, Surabaya, Indonesia (e-mail: [email protected], [email protected], [email protected], [email protected])
Yosi Kristian and Esther Irawati Setiawan are also with the Department of Information Technology, Sekolah Tinggi Teknik Surabaya, Surabaya, Indonesia (email: [email protected], [email protected])
Hideya Takahashi and Kayo Yoshimoto are with the Graduate School of Engineering, Osaka City University, Osaka, Japan (e-mail: [email protected], yoshimoto@@elec.eng.osaka-cu.ac.jp)
Elizeus Hanindito is with the Faculty of Medicine, Airlangga University, Surabaya, Indonesia (e-mail: [email protected])
observation and scoring is the most common pain measure-ment for infant pain[7].
Even though thees observation related instrument have been used commonly, they have substantial shortcomings in availability of observer, and observer bias [8]. The number of nurses and doctors in hospital are limited, so it is almost impossible for them to monitor the infants continuously. On the other hand, the observer bias could be caused by various of personality, backgrounds, gender, and the observation context [9]. That is why, we need an intelligent system that can detect pain on infants automatically and correctly is imminent.
Earlier researches [10] and [7] used crying sound to detect pain. Implementing monitoring system that uses sound is considered challenging because there are usually more than one infant in pediatric intensive care unit (PICU), and they may cry on the same time. In 2006 [11] Brahnam tries to classify pain in infant facial expression using PCA, LDA, and SVM. They tested their method on 26 infants and got 88% accuracy on pain versus nonpain expression. In 2008 Sciavenato et al introduce a set of point-pair distance (geometrical feature) to measure pain from infant facial expression [12]. Later on Nanni et al propose an LBP textural based feature [13] to perform infant facial pain detection. Both of this research have good results.
Since introduced by Ekamn in [14] Facial Action Coding System (FACS) has been widely used in many research related to facial expression. In [15] they use a neural network based automatic recognition of Action Units (AU) from Ek-man FACS. In [16] Fasel conduct a survey of automatic facial expression recognition and most of the surveyed research used FACS. In [17] Prkachin et al measured facial behavior and described a set of facial actions unit associated with pain. In [2] Lucey et al used an Active Appearance Model (AAM) based feature combined with Support Vector Machine (SVM) to detect pain on adult face.
However Brahnam et al system in [11] left the feature extraction to PCA and didn’t explore more on the features it self. While Nanni et al system in [13] only used textural or local feature using LBP and its modifications. On the other hand PPD by Schiavenato et al in[12] only focused on geometrical features. While Lucey et al system in [2] focused on adult face and using the slower AAM.
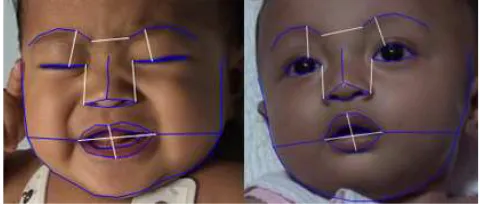
(a) (b)
Fig. 1: In this paper, a set of features and an automatic system are developed to distinguish whether an infant is (a) ”in pain” or (b) ”not in pain” base on his facial expressions.
tried a number of modification and combination between geometrical features in [12] and textural features in [13] based on facial action units described in [17]. Figure 1 shows the difference between infant facial expression in pain and not that we are trying to distinguish.
Based on[7] and all the data we collected, infant always cry when experiencing severe pain. That is why we also em-ploy and continue Kristian et al research in [18] that perform infant facial cry detection to improve the performance of our system.
The key contributions of this paper are:
1) We created an Active Shape Model (ASM) based infant facial landmark detection, because geometrically infant faces are slightly different from adult. This facial landmark detection can later on be used for many other research involving infant facial landmark.
2) We modified the point-pair distance from [12] based on Pain FACS in [19] to enhance the performance of our infant facial pain classification.
3) We added textural feature to improve our detection performance using LBP.
4) We introduced a two stage pain classification process that preceded by a facial cry detection to produce a higher performance pain classification system.
II. RELATEDWORK
In [7] Hanindito used acoustic sound pattern on baby cries to detect pain. During his research he created 56 video taken form 28 infant before and after a specific surgical procedure. He also score the FLACC scale and measure the saliva cortisol hormone from every infant before and after their surgery procedure. This videos are the source of this research dataset.
In 2008, Schiavenato et al introduce the primal face of pain (PFP) [12] a set of point-pair distance to measure infant pain. They conduct their research based of 57 neonates representing both sexes and 3 ethnic backgrounds (African American, Caucasian and Hispanic/Latino). They concluded that there is no particular cluster or unique display of pain based on sex, or ethnicity. This is why we tried to use PFP as one of the feature in this research even our subjects are infants from Indonesia. PFP point pair distances is shown
Fig. 2: Infant Facial Landmark (blue lines), with PFP Point Pair Distance (white lines) on baby face.
with white lines on Figure 2, the blue lines is the facial landmark discovered by Active Shape Model.
Later on in 2013 Nanni et al [13] proposed an LBP based textural feature to detect pain on baby face. In their method they divided baby face image to 7 x 9 overlapping cell, each cell have 25 x 25 pixel dimension. Than they run cells selection algorithm to select the best cells to represent baby face. They continued by extracting texture descriptor on each selected cell using LBP and feed the LBP features to an SVM classifier. They also tried few LBP modifications and got a high Area Under ROC Curve.
More recently Kristian et al [18] published their work on infant facial cry detection. In the paper they introduce sets of geometrical feature discovered by Active Shape Model to perform infant facial cry detection. They also use a relatively new Chaotic Neural Network based classifier called the Ideal Modified Adachi Chaotic Neural Network (Ideal-M-AdNN). In the paper they reported a high accuracy for infant facial cry detection.
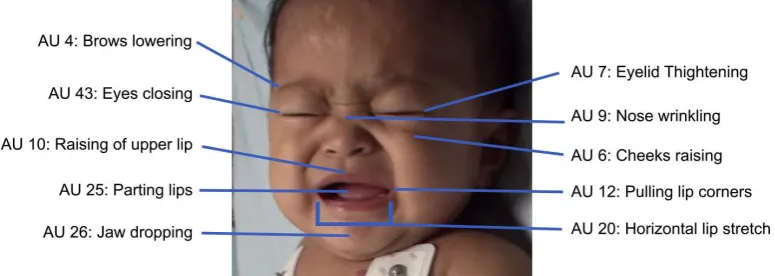
Based on FACS and earlier research [20] and [17] the AU related to pain are: brow-lowering (AU 4), cheek-raising (AU 6), eyelid tightening (AU 7), nose wrinkling (AU 9), upper-lip raising (AU 10), oblique upper-lip raising (AU 12), horizontal lip stretch (AU 20), lips parting (AU 25), jaw dropping (AU 26), mouth stretching (AU 27) and eye closing (AU 43). The visualization of these AU on Infant face in pain can be seen in figure 3. In [19] Prkachin and Solomon recode the AU of pain into a more simple set of AU as in equation 1.
P ain=AU4+ (AU6||AU7)+(AU9||AU10)+AU43 (1) This equation means that pain is the sum of AU4, AU6 or AU7 (choose the higher), AU9 or AU10 (choose the higher) and AU43.
For adult pain detection, in [2] Lucey et al has created a system utilizing AAM and SVM. They used UNBC-McMaster Shoulder Pain Expression Archive database that contain 129 video. AAM is used to extract shape and appearance features. For the shape feature they normalize all of the vertex (68 vertex) found by AAM. For the appearance feature they run piece-wise affine warp on each triangle patch appearance in the source image to aligns with the base face shape. Then they scale the image into 87 x 93 pixel. SVMs are used to detect AUs based on these features. Then they use Equation 1 to determine whether the example is in pain or not.
[image:2.595.306.546.54.156.2]Fig. 3: Infant Facial Action Unit on Pain
still considered the most robust and is widely used in many research such as [18], [2] and [22]. A widely used method for facial landmark detection is Active Shape Model (ASM). ASM [23] is a method where the model is iteratively changed to match a model in the image. This method used an elastic model which acquired from a number of training data sample.
III. THEPROPOSEDWORK
In this paper we use face detection and Active Shape Model (ASM) to detect facial landmark point on infant face. We then conduct features extraction and tested a few feature combination between geometrical and textural to find the most suitable set for infant facial pain classification. We also tested single stage classifier and two stage classifier (preceded by a cry detection) using SVM. An overview of our final system is given in Figure 4.
A. Dataset
In [7] Hanindito create a dataset consist of 46 videos from 23 infants. The videos was taken before and after a surgery procedure. He also measured the saliva cortisol hormone and score the FLACC instrument of each infant before and after the procedure. Then he concluded whether the infants are in severe, light to moderate, or in no pain. The recording, saliva cortisol hormone measurement, and FLACC scoring are done clinically in hospital by medical doctor and nurse, with consent from the infant parents.
For this research we record 10 more video from 5 infant, before and after various surgery procedures. We also conduct the same process as the first 23 infants. This 56 video are the source of our dataset. Unfortunately we have to discard 12 videos because no frontal face could be extracted. From the 44 video we extracted 3 frames from each video and selected various crying expression if the videos contain any crying session. Example of our frame selection process can be seen in Figure 5.
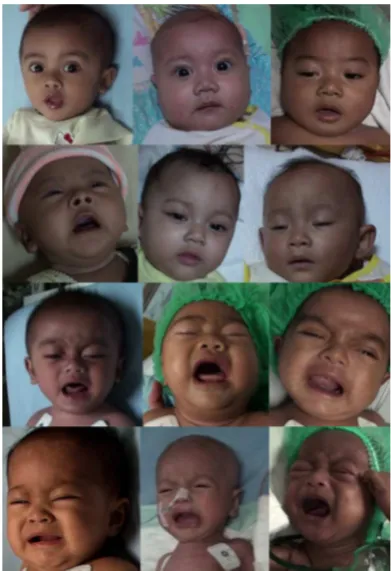
Finally, our dataset contain 132 images with class and cry distribution shown on table I. As you can see in the dataset we have three classes: no pain, light to moderate pain, and severe pain. Our primary goal is to detect the severe pain with highest recall and precision. In table I all of the example experiencing severe pain are also crying, so we believed that it will be easier for our classifier to distinguish severe pain from just the crying examples. A few examples of our dataset can be seen in Figure 6
TABLE I: Class distribution of our dataset
Class Cry Not Cry Total
Severe Pain (SP) 30 0 30
Light to Moderate Pain (LM) 19 18 37
No Pain (NP) 5 60 65
Total: 54 78 132
B. Face Detection and Facial Landmark Detection
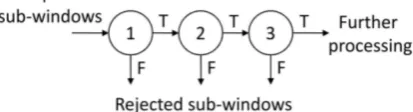
Acording to [24] the Viola-Jones algorithm from [21] is one the best frontal face detection algorithm. It contains three main ideas that make it possible to build a real time face detection: the integral image, classifier learning with AdaBoost, and the cascade classifier structure.
Integral image, also known as a summed area table, is an algorithm for quickly and efficiently computing the sum of values in a rectangle subset of a grid. While boosting is a method of finding a highly accurate hypothesis by combining many weak hypotheses, each with moderate accuracy. The key insight of Viola Jones algorithm is the cascade classifier, boosted classifiers can be built which reject most of the negative sub-windows while keeping almost all the positive examples. Consequently, majority of the subwindows will be rejected in early stages of the detector, making the detection process extremely efficient. Illustration of this cascade clas-sifier can be seen in Figure 7
For facial landmark detection We choose ASM [23] over AAM because in [25] Tim Cootes the creator of ASM and AAM state that ASM runs significantly faster for facial model, and locates the points more accurately than the AAM. We modified ASM landmark points from [18] and train it with more than 200 infant facial images.
Active Shape Model (ASM) is a method where the model is iteratively changed to match that model into a model in the image. This method is using a flexible model which are acquired from a number of training data sample. Given a guessed position in a picture, ASM iteratively will be matched with the image. By choosing a set of shape param-eter b for Point Distribution Model, the shape of the model can be defined in a coordinate frame which centered in the object. Instance X in the images model can be constructed by defining position, orientation, and scale.
[image:3.595.305.546.248.336.2]Fig. 4: Overview of our system. The face is detected using Viola-Jones, and the landmark points is found by ASM. From the landmark points found we extracted the geometrical feature and conduct the cry detection. For the crying face we continued to detect pain using textural feature discovered by LBP.
Fig. 5: Selecting Frames
and crop the infant face to prepare for geometrical feature extraction.
C. Feature Extraction
In [2] Lucey et al use an Active Appearance Model based feature extraction and use the machine learning to determine AUs. Contrary, in here we don’t detect AUs, but we extracted distance and texture that related to the AUs of pain, and then we feed them to machine learning for classification.
Fig. 6: Example of images in dataset: (Row 1 and 2) unpainful faces (Row 3 and 4) painful faces
In this paper we extracted two sets of geometrical feature which is a normalized distance between landmark points found by ASM:
• NPPD: Normalized Point Pair Distance as in [12] but
[image:4.595.72.267.360.627.2]Fig. 8: Top Row: Original PPD, Bottom Row: Extended PPD (5 more distances added)
distance between lip corner and distance between brow that is need to be divided by face width, the rest is divided by the face height. We used standard euclidean distance for this feature, see Equation 2. This NPPD feature consist of 7 real number.
D(p1, p2) =q(xp1−xp2)2+ (yp1−yp2)2 (2)
• ENPPD: Extended Normalized Point Pair Distance is
our extension of NPPD which can be compared to the original NPPD in Figure 8. The addition are drawn in red lines, and the original are drawn in white lines. We add seven more distance to the original PPD to capture more information from the infant face that is considered related to the AUs of pain in Equation 1. Our addition will provide more feature related to AU43(Eyes Closing), and AU25(Parting Lips).
Although very useful, Not all AUs, can be captured from geometrical feature, nose wrinkling and cheek raising AUs for example. This is the reason we added textural based feature using Local Binary Pattern.
Local Binary Pattern (LBP) [26] is a local texture operator with powerful discrimination, low computational complexity, and less sensitivity to changes in illumination. Many work on facial expression has report promising result using LBP feature such as [27], [28], and [13].
The LBP descriptor is obtained by evaluating the binary difference between the gray value of a pixel P from the gray values of its N neighborhood placed on a circle radius of R. See figure 9. The operator labels the pixels of an image block by thresholding the neighborhood of each pixel with the center value and considering the result as a binary
Fig. 9: LBP neighbors for different N and R parameter
number (LBP code), can be seen on equation 3 and 4. After calculating LBP code using N=8 and R=1 for each pixel, we create histogram based on it to get 256 long histogram. Using the uniform patterns from [26] we reduce the 256 long histogram into 59 long histogram to create rotation invariant texture feature. In this paper we experimented with 2 sets of LBP features:
LBP(Xp, Yp) = N−1
X
n=0
s(gp−gn)2n (3)
s(x) = (
1 x≥0
0 x <0 (4)
• TBLBP81: Top Bottom LBP with N=8 R=1, means we
split the face region horizontally into top portion and bottom portion and then run LBP for each portion using 8 neighbor and one pixel radius. This will produce 59*2 = 118 features. The process of top bottom LBP feature extraction can be seen in Figure 10.
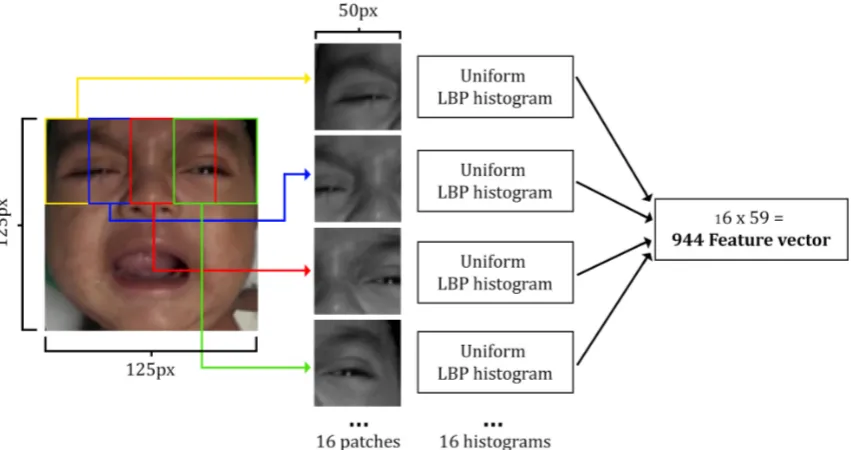
• MPLBP81: Multi patch LBP with N=8 R=1 neighbor,
means running the LBP algorithm for 16 overlapping patches of the face using 8 neighbor and one pixel radius. This method produce 59*16 = 944 features. The multi patch LBP extraction process can be seen on Figure 11.
Based on our analysis in AU of pain, we believe that face textural feature should not be extracted from the whole face, but the top and bottom portion of the face should be extracted separately or by using multiple overlapping patches.
D. Support Vector Machine classification
SVM was introduced in 1995 [29] and the fast training using Sequential Minimal Optimization (SMO) was intro-duced in [30]. Since then SVM has gained many attention from machine learning researchers. Recently Kristian et al also use SVM for an age classification problem in [22].
An SVM model is known as the large margin classifier, it mapped the examples as point in space so that the examples of separate categories are divided by a clear gap or wide as possible. This new space is generated by employing the kernel tricks. There are a few popular kernel used with SVM such as Linear, Sigmoid, RBF, and Polynomial.
[image:5.595.66.273.63.119.2] [image:5.595.50.289.153.358.2]Fig. 10: Top Bottom LBP Features Extraction
Fig. 11: Multi Patch LBP Features Extraction
In this paper we use SVMs to classify the pain degree of infant facial image. But our main goal is to distinguish the severe pain from others. To create a good SVM classifier we need to determine the suitable kernel and a number of parameters. Kernels we tried including: Radial Basis Function (equation 5), Linear, Polynomial, and Sigmoid.
K(x, x′) =exp(−γ||x−x′||2
) (5)
The first important parameter to decide is the C parameter, because if it is too large, we have a high penalty for non separable points and we may store many support vectors and overfit. If it is too small, we may have an underfitting classifier [31]. Each kernel also have parameter to define, such as γ in RBF, and the d parameter for degree in polynomial kernel. We decide to employ automatic parameter search using algorithm from [32] and using LIBSVM [33] for our system.
E. Performance Measurement
For our experiment we used the k-fold scenario using k= 10, which mean we randomly split our dataset into 10 segments, and then run the classifier 10 times using different segment as the test segment and the rest as train segment. To
measure the performance of our system we use Area Under the ROC curve (AUC) and F1 Score, they are considered more reliable than classification accuracy.
To calculate AUC, first we must create the Receiver Operating Characteristic (ROC). The ROC curve is created by plotting the true positive rate (TPR) against the false positive rate (FPR) at various threshold settings. The true-positive rate is also known as sensitivity, or recall in machine learning. The false-positive rate is also known as the fall-out and can be calculated as (1 - specificity) [34]. The ROC curve is thus the sensitivity as a function of fall-out and AUC is the area under this curve. While the F1 Score is the harmonic mean of precision and recall. See Equation 6.
F1 = 2· precision·recall
precision+recal (6)
IV. EXPERIMENTS ANDRESULTS
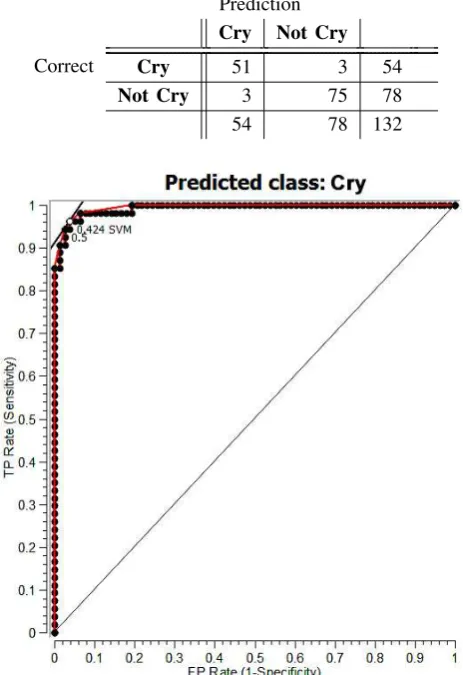
[image:6.595.87.513.237.462.2]Fig. 12: ROC for Cry detection using ENPPD and RBF Kernel
A. Infant Facial Cry Detection
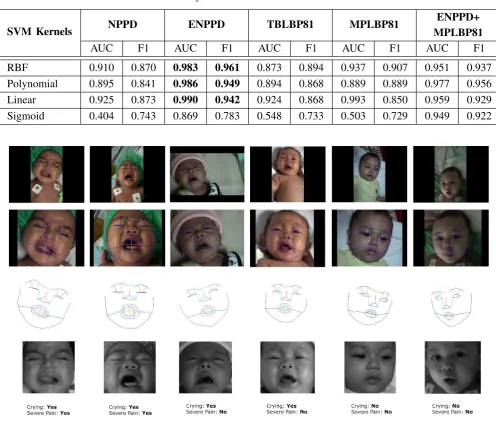
The results for infant facial cry detection is shown in table III. In this table it is clearly that our ENPPD feature can detect cry with a very high AUC and F1 Score compared to other feature. Even the combinational feature between ENPPD with textural feature MLLBP81 could not perform as well as the ENPPD alone. This experiment shows that textural feature does not perform too well on our facial cry detection system.
And the best kernel for our cry detection problem is using Radial Basis Function (RBF). The RBF kernel out perform other kernel in almost every feature we have. ROC graph for Crying class with ENPPD feature using SVM with RBF Kernel can be seen on Figure 12. In this experiment we are able to detect every sample in severe pain class as crying. The confusion matrix from one of our best classification result can be seen on table II.
B. Infant Facial Pain Classification
We conduct a number of experiments using different feature and scenario to detect pain on infant facial ex-pression. In this test we still use the same k-fold cross validation testing with k = 10. Table IV shows the single stage pain classification result using SVM with RBF kernel and automatic parameter search. In this table we can see
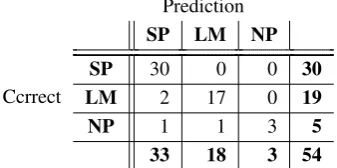
can be seen on table V. In this table it is clear that by eliminating the non crying faces, we can classify pain with better accuracy. Our MPLBP81 feature got the best result with 92.3% accuracy and 0.952 average F1 score. To describe our result more clearly the confusion matrix from our second stage pain classification can be seen in Table VII. Table VIII shows comparison of Precision and Recall for Severe Pain (SP) and Light to Medium Pain (LM) between Single Stage and Two Stage Infant Pain Classification.
Based on our experiments, we can conclude that geo-metrical feature is more suitable for cry detection, and for pain classification, the textural feature in this case MPLBP81 perform better than other features and even better than combination between textural and geometrical. Example of our system tries to classify cries and pain can be seen in Figure. 13. Overall comparison of our experiment can be seen on Figure 14.
V. CONCLUSION ANDFUTUREWORK
In this paper we have describe a new approach consisting a sequence of procedures to detect infant cry, continued with infant pain classification based on facial expression. We have shown that a hybrid between geometrical and textural features with the help of a multi stage SVM classifier can obtain a high AUC and F1 Score for infant severe pain detection.
Geometrical features perform better for cry detection because when an infant cries the facial landmark points are geometrically changed. While for pain classification preceded by a cry detection, textural features perform better in distinguishing a cry in pain, because texture difference around eyes, nose and cheeks can differentiate whether the infant is crying in pain or not.
For future work we are planning to create a real time system that can detect cry and pain from infant facial expression.
REFERENCES
[1] K. M. Prkachin, N. A. Currie, and K. D. Craig, “Judging nonverbal expressions of pain.,”Canadian Journal of Behavioural Science/Revue canadienne des sciences du comportement, vol. 15, no. 4, p. 409, 1983. [2] P. Lucey, J. F. Cohn, I. Matthews, S. Lucey, S. Sridharan, J. Howlett, and K. M. Prkachin, “Automatically detecting pain in video through facial action units,” Systems, Man, and Cybernetics, Part B: Cyber-netics, IEEE Transactions on, vol. 41, no. 3, pp. 664–674, 2011. [3] C. M. Lilley, K. D. Craig, and R. E. Grunau, “The expression of pain
in infants and toddlers: developmental changes in facial action,”Pain, vol. 72, no. 1, pp. 161–170, 1997.
[4] S. W. Krechel and J. BILDNER, “Cries: a new neonatal postoperative pain measurement score. initial testing of validity and reliability,”
Pediatric Anesthesia, vol. 5, no. 1, pp. 53–61, 1995.
[5] T. Voepel-Lewis, J. R. Shayevitz, and S. Malviya, “The flacc: a behavioral scale for scoring postoperative pain in young children,”
Pediatr Nurs, vol. 23, pp. 293–7, 1997.
[image:7.595.54.286.76.414.2]RBF
0.910
0.870
0.983
0.961
0.873
0.894
0.937
0.907
0.951
0.937
Polynomial
0.895
0.841
0.986
0.949
0.894
0.868
0.889
0.889
0.977
0.956
Linear
0.925
0.873
0.990
0.942
0.924
0.868
0.993
0.850
0.959
0.929
[image:8.595.48.545.62.485.2]Sigmoid
0.404
0.743
0.869
0.783
0.548
0.733
0.503
0.729
0.949
0.922
Fig. 13: Example of our process, intermediate result, features extraction and final result. First row: Original image, Second Row: Facial landmark detection, Third Row: Geometrical feature (NPPD: green line, ENPPD: green+red line), Fourth row: Gray leveling, rotating, scaling, cropping for textural feature extraction using LBP, Last row: Classification result from our system.
Fig. 14: Performance Comparison of Different Features and Stage
[7] E. Hanindito,Dynamic Acoustic Pattern as Pain Indicator on Baby Cries Post Surgery Procedure. PhD thesis, Universitas Airlangga, 2013.
[8] K. M. P. PhDI and B. Teresa Hwang, “Does experience influence judgments of pain. behaviour? ´evidence from relatives of pain patients and therapists,”Pain, vol. 6, no. 2, p. 105, 2001.
[9] B. Stevens, C. Johnston, and S. Gibbins, “Pain assessment in neonates,”Pain research and clinical management, vol. 10, pp. 101– 134, 2000.
[10] B. F. Fuller, “Acoustic discrimination of three types of infant cries.,”
Nursing Research, vol. 40, no. 3, pp. 156–160, 1991.
[image:8.595.50.549.569.680.2]ENPPD+TBLBP81 0.857 0.853 0.984 ENPPD+MPLBP81 0.887 0.871 0.973
TABLE V: Second Stage Pain Classification Performance
Feature CA Average F1 AUC
TBLBP81 0.870 0.903 0.910
MPLBP81 0.923 0.952 0.906
ENPPD+TBLBP81 0.867 0.903 0.896
ENPPD+MPLBP81 0.887 0.921 0.910
recognition and representation of neonatal facial displays of acute pain,”Artificial intelligence in medicine, vol. 36, no. 3, pp. 211–222, 2006.
[12] M. Schiavenato, J. F. Byers, P. Scovanner, J. M. McMahon, Y. Xia, N. Lu, and H. He, “Neonatal pain facial expression: Evaluating the primal face of pain,”Pain, vol. 138, no. 2, pp. 460–471, 2008. [13] L. Nanni, S. Brahnam, and A. Lumini, “A local approach based on
a local binary patterns variant texture descriptor for classifying pain states,”Expert Systems with Applications, vol. 37, no. 12, pp. 7888– 7894, 2010.
[14] P. Ekman and W. Friesen., “Facial action coding system: A technique for the measurement of facial movement.,”Consulting Psychologists Press, 1978.
[15] Y.-l. Tian, T. Kanade, and J. F. Cohn, “Recognizing action units for facial expression analysis,”Pattern Analysis and Machine Intelligence, IEEE Transactions on, vol. 23, no. 2, pp. 97–115, 2001.
[16] B. Fasel and J. Luettin, “Automatic facial expression analysis: a survey,”Pattern recognition, vol. 36, no. 1, pp. 259–275, 2003. [17] K. M. Prkachin, “The consistency of facial expressions of pain: a
[image:9.595.65.275.83.180.2]comparison across modalities,”Pain, vol. 51, no. 3, pp. 297–306, 1992. [18] Y. Kristian, M. Hariadi, and M. H. Purnomo, “Ideal modified adachi chaotic neural networks and active shape model for infant facial cry detection on still image,” in Neural Networks (IJCNN), 2014
TABLE VI: Confusion Matrix of Single Stage Pain Classi-fication
Prediction SP LM NP
SP 26 2 2 30
LM 4 29 4 37
NP 1 2 62 65
Ccrrect
31 33 68 132
TABLE VII: Confusion Matrix of Second Stage Pain Clas-sification
Prediction SP LM NP
SP 30 0 0 30
LM 2 17 0 19
NP 1 1 3 5
Ccrrect
33 18 3 54
[19] K. M. Prkachin and P. E. Solomon, “The structure, reliability and validity of pain expression: Evidence from patients with shoulder pain,”Pain, vol. 139, no. 2, pp. 267–274, 2008.
[20] K. D. Craig, S. A. Hyde, and C. J. Patrick, “Genuine, suppressed and faked facial behavior during exacerbation of chronic low back pain,”
Pain, vol. 46, no. 2, pp. 161–171, 1991.
[21] P. Viola and M. J. Jones, “Robust real-time face detection,” Interna-tional journal of computer vision, vol. 57, no. 2, pp. 137–154, 2004. [22] Y. Kristian, E. Setyati, Y. M. Pranoto, A. T. Hermawan, and M. P. Wijaya, “Human facial age classification using active shape model, ge-ometrical feature, and support vector machine on early growth stage,” in ISICO, The Third Information Systems International Conference, ITS, 2015.
[23] T. F. Cootes, C. J. Taylor, D. H. Cooper, and J. Graham, “Active shape models-their training and application,” Computer vision and image understanding, vol. 61, no. 1, pp. 38–59, 1995.
[24] C. Zhang and Z. Zhang, “A survey of recent advances in face detection,” tech. rep., Tech. rep., Microsoft Research, 2010. [25] T. F. Cootes, G. J. Edwards, and C. J. Taylor, “Comparing active shape
models with active appearance models.,” inBMVC, vol. 99, pp. 173– 182, 1999.
[26] T. Ojala, M. Pietik¨ainen, and T. M¨aenp¨a¨a, “Multiresolution gray-scale and rotation invariant texture classification with local binary patterns,”
Pattern Analysis and Machine Intelligence, IEEE Transactions on, vol. 24, no. 7, pp. 971–987, 2002.
[27] C. Shan, S. Gong, and P. W. McOwan, “Facial expression recognition based on local binary patterns: A comprehensive study,”Image and Vision Computing, vol. 27, no. 6, pp. 803–816, 2009.
[28] N. Algaraawi and T. Morris, “Study on aging effect on facial ex-pression recognition,” inLecture Notes in Engineering and Computer Science: Proceedings of The World Congress on Engineering 2016, WEC 2016, 29 June-1 July, 2016, London, U.K, pp 465–470. [29] C. Cortes and V. Vapnik, “Support-vector networks,”Machine
learn-ing, vol. 20, no. 3, pp. 273–297, 1995.
[30] J. Plattet al., “Fast training of support vector machines using sequen-tial minimal optimization,”Advances in kernel methodssupport vector learning, vol. 3, 1999.
[31] E. Alpaydin,Introduction to machine learning. MIT press, 2014. [32] C.-W. Hsu, C.-C. Chang, C.-J. Lin,et al., “A practical guide to support
vector classification,” 2003.
[33] C.-C. Chang and C.-J. Lin, “Libsvm-a library for support vector machines,” 2014.
[34] J. A. Hanley and B. J. McNeil, “The meaning and use of the area under a receiver operating characteristic (roc) curve.,”Radiology, vol. 143, no. 1, pp. 29–36, 1982.
[image:9.595.66.275.208.282.2] [image:9.595.77.253.568.653.2] [image:9.595.82.251.699.783.2]interests include interactive 3D display, retinal projection display, and wearable computers. He is a member of SPIE and OSA.
I Ketut Eddy Purnama received the bache-lor degree in Electrical Engineering from Institut Teknologi Sepuluh Nopember (ITS), Surabaya, Indonesia in 1994. He received his Master of Tech-nology from Institut Teknologi Bandung, Ban-dung, Indonesia in 1999. He received Ph.D de-gree from University of Groningen, Netherlands in 2007. Currently, he is a staff of Electrical Engi-neering Deparment of Institut Teknologi Sepuluh Nopember, Surabaya, Indonesia. His research in-terest is in Data Mining, Medical Image Processing and Intelligent System.
Kayo Yoshimoto recieved the B.E and M.E. degrees in mechanical engineering from Osaka University in 2009 and 2011, respectively, and completed the doctoral program at Osaka Uni-versity (Graduate School of Medicine) in 2014. She became a research associate of the Dept. of Electric and Information Engineering at the Grad-uate School of Engineering of Osaka University since 2014. Her current research interests include Medical Engineering and Nursing Engineering.
Esther Irawati Setiawan receive hes bachelor degree in computer science and master degree in information technology from Sekolah Tinggi Teknik Surabaya (STTS), Surabaya, Indonesia, in 2006 and 2010 respectively. She is currently taking a Ph.D degrees Institut Teknologi Sepuluh Nopem-ber (ITS), Surabaya, Indonesia. She joined as a faculty member in STTS since 2006. Her current research interests include Machine Learning, Text Mining, Social Network Analysis, and Natural Language Processing.
Elizeus Hanindito received his Medical Doc-tor degree in 1979, Anesthesiology Specialty in 1984, and Medical Ph.D in 2013 from Faculty of Medicine, Airlangga University, Surabaya, Indone-sia. He is currently a Chief Lecturer in Department of Anesthesiology and Reanimation, Faculty of Medicine, Airlangga University. He also work as Head of Pediatric Anesthesiology division in Dr. Soetomo National Hospital. His current interest include Pediatric Anesthesiology, Pediatric Pain Management, and Reanimation.