| 284
PRELIMINARY STUDY ON DEVELOPING SCIENCE LITERACY
TEST FOR HIGH SCHOOL STUDENTS IN INDONESIA
Ade Intan Permata Ariyantia, Murni Ramlib, Baskoro Adi Prayitnoc
aPostgraduate of Science Education Faculty of Teacher Training and Education Sebelas Maret University, Surakarta, Indonesia b,cBiology Education,Faculty of Teacher Training and Education, SebelasMaret University, Surakarta, Indonesia
Corresponding e-mail: [email protected]
Abstract: The research aimed to describe the science literacy of high school student tested by Nature of Science
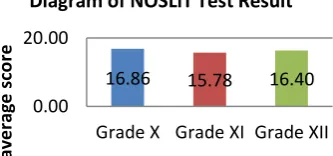
Literacy Test (NOSLiT), which was developed by Carl J. Wenning. NOSLiT is a test to measure science literacy, as a research instrument to identify weaknesses of students’ understanding, and determine instrument effectiveness. NOSLiT consists of 35 multiple choice questions with four alternative answers, and true-false questions with two alternative answers. This study was begun with translating the original NOSLiT into Indonesian language, and validated the translated version by expert validators. Second, selected the respondents, consisted of 225 students from ten public and private high schools, i.e. 30 students of SMAN 1 Ngawi, 25 students of SMAN 2 Ngawi, 26 students MAN Ngawi, 21 students of SMAN Kwadungan, 25 students of SMA Muhammadiyah 1 Ngawi, 17 students of SMA Karya Pembangunan Paron, 29 students of SMAN 1 Madiun, 18 students of SMAN 3 Madiun, 23 students of SMAN 1 Nglames, and 11 students of SMA Cokro Aminoto Madiun. The result showed that the average score of NOSLiT test of grader X was 16.86; grader XI was 15.78; and grader XII was 16.40. Score of student’s science literacy was quite low, or had not achieved at least 50% of total score, which put students into moderate literacy.
Keywords: Science literacy, science literacy test, NOSLiT
1. INTRODUCTION
Globalization is indicated by advance in science and technology, which bring some positive impacts in the life, and also on the other hand raise complex issues. Global life requires human resources who are resilient and have the ability to think clearly about problems, facts, and phenomena surrounding. To nurture qualified human resources, we need to improve the quality of education. Science and technology are growing rapidly in recent times. These facts strongly and directly foster the advance of education, especially science and technology education. Earning good quality of education is a guarantee to survive and life in prosperity in the era of globalization. In the industrialized world, technical reading skills can be taken for granted. But literacy requirements have shifted toward reading for learning the capacity to identify, understand, interpret, create, and communicate knowledge, using written materials associated with varying situations in changing contexts. These skills have now
become an almost universal requirement for success in the industrialized world (Schleicher, 2010).
| 285
Improving the quality of science educationin Indonesia is started by the implementation of The Curriculum 2013, which stresses on the application of scientific approach. This approach is designed in such learning design in order to provide learners to be actively constructing concepts, through learning process, which is initiated by observing, then formulating the problem by posing some related questions, proposing a hypothesis, designing an investigation to collect data, analysing the data, concluding, and communicating the results.
Scientific literacy in PISA 2015 is defined by three competencies, i.e. to explain phenomena scientifically, evaluate and design scientific enquiry and interpret data and evidence scientifically (OECD, 2015). According to Holbrook (2009) in the Journal The Meaning of Science, scientific literacy is defined as a tribute to science by improving the components of learning in themselves to be able to contribute to the social environment. DeBoer (2000), states that science literacy is a term that has been used since the late 1950s to describe a desired familiarity with science on the part of the general public. The history of science education shows that there have been at least nine separated and distinctive goals of science education that are related to the larger goal of scientific literacy. Science literacy is also defined as the elements of a civic concept that represents behavior’s awareness that serves as guidelines for interpreting the functions of science/technology in human affairs and the management of life (Hurd, 1997). A person who is science-literated is aware that science, mathematics, and technology are interdependent human enterprises with strengths and limitations who; understands key concepts and principles of science; is familiar with the natural world and recognizes both its diversity and unity; and uses scientific knowledge and scientific ways of thinking for individual and social purposes (AAAS, 1990). Scientific literacy also can be defined as a person's ability to understand science, communicate science (oral and written), and apply scientific knowledge to solve problems. It also represents an attitude and the high sensitivity of environment in making
decisions based on considerations of science (Toharudin, et al, 2011).
Various opinion of experts on science literacy illustrate that the understanding of science is fundamental, especially for teachers and parties related to science education. Wenning (2006) states that the definition of scientific literacy is a goal of scientists, educators and philosophers towards a better 21st century.
Measurement of science literacy is urgently required to know science literacy of students. Measurement of scientific literacy is performed by firstly, determining student achievement indicators for science literacy. Currently, international level tests used to measure competence in mathematics and science, such as the Program for International Student Assessment (PISA), which is developed by OECD, the test of No Child Left Behind (NCLB), National Assessment of Educational Progress (NAEP), and Trends in International Mathematics and Science Survey (TIMSS).
However, those measurements somehow do not match with the science educational approach in Indonesia. Some cases tested in those tests cannot easily be understood by the Indonesian students, due to unfamiliarity with the context asked in. One of the good assessments for science literacy due to its wide range of aspect measured is the Nature of Science Literacy Test developed by Dr. Carl J. Wenning of Illinois University.
| 286
of scientists, philosophers, and educators whocan advance by fiat a universal definition of scientific literacy.
2. RESEARCH METHOD
Type of this research is a quantitative descriptive. According to Sugiyono (2009), descriptive research aims to describe carefully and systematically about the fact and character of certain populations. This type of research is used to describe the NOSLiT result which was tested on high school students in ten schools in Ngawi and Madiun Resident.
The research was conducted in December 2014. The population was grade X, XI and XII of senior high school. First, the Indonesian version of NOSLiT had been developed through translating the 35 items of the original NOSLiT. Second, selected the respondents, which were 225 students from ten public and private schools, i.e. 1) 30 students of SMAN 1 Ngawi, 2) 25 students of SMAN 2 Ngawi, 3) 26 students MAN Ngawi 4) 21 students of SMAN Kwadungan, 5) 25 students of SMA Muhammadiyah 1 Ngawi, 6) 17 students of SMA Karya Pembangunan, Paron , 7) 29 students of SMAN 1 Madiun, 8) 18 students of SMAN 3 Madiun, 9) 23 students of SMAN 1 Nglames, and 10) 11 of SMA Cokro Aminoto Madiun. Results then were calculated to obtain the average grade on the entire sample of students in each school and then were analysed thoroughly and consider each of the existing frameworks of NOSLiT. Results of this analysis can be used to determine the status of scientific literacy of students when measured using questions NOSLiT that have been developed and used in the United States.
3. FINDINGS AND DISCUSSION
This study was started with translating the original NOSLiT into Indonesian language, and validated the translation by expert validators. The implementation of test and guidelines is based on the ability of scientific literacy framework developed by Dr.Carl J. Wenning (Illinois State University, USA). Based on the tests that have been conducted in ten schools, the average yield obtained is less than 17 from a total score of 35 items depicted in table 2.
Table 2. Results of NOSLiT
Area Name of School Average Ngawi SMAN 1 Ngawi 18.43
SMAN 2 Ngawi 14.92 MAN Ngawi 16.88 SMA Muhammadiyah 1 Ngawi 15.52 SMA Karya Pembangunan Paron 16.29 Madiun SMAN 1 Madiun 18.07 SMAN 3 Madiun 19.00 SMAN 1Nglames 11.96 SMA CokroAminoto 16.18
These results indicate that the level of mastery students in some school for answering the NOSLiT test is still below the range of 50% of the total number of 35 questions that must be done. In public school, the data shows that only three schools (i.e. SMAN 1 Ngawi, SMAN 1 Madiun, and3 Madiun) that have scores more than 50% and in private schools, all of schools has score less than 50% of the total questions. According to Wenning, scores should reach at least 50% to be able to say that students have moderate literacy. Test result based on grade level presented in Figure 1.
Figure 1. Grade based NOSLiT Results
Figure 1 shows that some questions are difficult for mostly students, and only a few students answered correctly. Students in grade X purchase average of percentage 16, 86% as the highest purchasing scores. The percentage of correct answers on any acquisition framework is presented in Figure 2 through Figure7.
16.86 15.78 16.40
0.00 20.00
Grade X Grade XI Grade XII
av
e
rag
e
sco
re
| 287
Figure 2. The percentage of correct answers on the Framework 1 NOSLiT
Figure 2 shows the percentage of correct items which is included in the framework 1 (stated about scientific nomenclature). This framework contains about twenty-four vocabularies, which must be understood by students and teachers in science. Framework 1 was represented by Q1, Q2, Q3, Q4, Q5, Q6, and Q24, the results shows that in Q4, Q5, Q6 and Q24, less than 40% students of all grades could answer correctly. The scientific nomenclature being tested in question number 4 is “model”,“law” (No. 5), “hypothesis” (No. 6) and “deductions” (No. 24). A common language is essential to communicate ideas, as well as these twenty-four terms. Students could not answer the question correctly because they do not understand what the definition of the words. While these twenty-four terms in framework 1 are most closely associated with experimental and these represent the minimal vocabulary and concept, so the teacher and student should be i.e. intellectual process skills. The framework is formulated in Q7, Q8, Q9, Q10, Q11, and Q23. Based on the data, Q8, Q9, Q10, and Q11 seem difficult for students, since less than 40% of grader X, XI, and XI answered correctly. The questions consist of some concepts related developing conclusion (Q8), reasoning the relationships in the formula (Q8), reading charts (Q9) and designing the experiment (Q10) and identifying variable (Q11).
Wenning (2006) states that students are able to have a comprehensive understanding in science if they have experience with empirical methods of science. These intellectual process skills in framework 2 are the key of observational and experimental skills when science is taught. It strongly focused on important intellectual process skills by scientist. Scientific activities that are done by scientists, area part of science as a process. The main characteristic of science is the activity to understand natural phenomena. Science is as a process referring to scientific activity. Every scientific activity has a characteristic that is rational, cognitive and have a specific purpose (Toharudin, 2011).
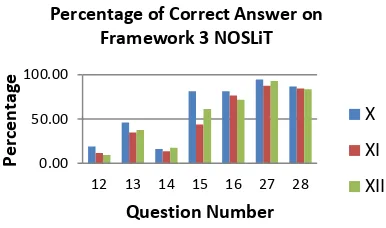
Fig. 4. The percentage of correct answers on the Framework 3 NOSLiT
Figure 4 shows the percentage of correct items,which are included in the framework 3, i.e Rules of Scientific Evidence, and it is broke down into Q12, Q13, Q14, Q15, Q16, Q27, and Q28. Among those questions, Q12 and Q14 are the most difficult questions, since less than 40% students of grade X, XI, and XI in the correct
Percentage of Correct Answer on Framework 1 NOSLiT Percentage of Correct Answer on
Framework 2 NOSLiT Percentage of Correct Answer on
Framework 3 NOSLiT
X
XI
| 288
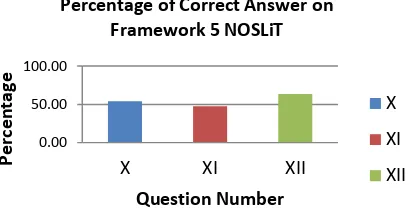
grader X. Low percentage in Q12 and Q14indicates that most studentsdid not too understand about rules of evidence in two terms. These questions refer to understand that scientific conclusion, which must be based on public evidence, not just individual statement. The rules of scientific evidence have been a topic for scientist in of the 17th century. The rules of scientific evidence have never beenarranged in an easily accessible way. These is points of departure for those who would like to talk about rules of scientific evidence with the assumptions upon which science operates. These serve as the basis for scientific work and thought, under the rules of scientific evidence to determine what is acceptable or unacceptable to some extent. It is being represented by Q17, Q18, Q19, Q20, Q21, Q25, Q26, and Q29. The result shows that the most difficult question was Q20. While Q17 which is related to assumptions upon the which science operates can only been understood by students of Grade XI. Q20 emphasize that science is not a private matter that concerns the individual scientist, but science is a social compact, and scientific knowledge items represented framework 5, or Scientific dispositions. The data showS that Q22 indicates that all students of grade X, XI, and XI more answer Q 30 and Q35. Moreover, entire students of grade XI only get a percentage below 10%. The Q33 can only be answered by Grade XII students (less than 40%). Q33 refers to statement that all questions posed by the universe can be answered via the scientific method. Only few students can answer correctly because they may consider that scientist can answer all of question if given enough time and resources. While in Q30, the statement about hypothesis eventually become theories and theories eventually become laws. McComas
0.00
Percentage of Correct Answer on Framework 4 NOSLiT Percentage of Correct Answer on
Framework 5 NOSLiT Percentage of Correct Answer on
Framework 6 NOSLiT
X
XI
| 289
(1996) stated that hypotheses are really onlyeducated guesses. The scientific method leads to absolute truth is the main of Q35. Students have not been understood this concept, so they considered When scientists collect and analyze facts, they will produce results that are known with complete certainty, is a true statement.
Results vary in student ability, and the content of science literacy acquire by students. According to Wenning (2006), NOSLiT is a standardized test that should not be used as a test assessment. That is, there is no good "score" on which one should assign a grade. NOSLiT was written for use with high school students and with a normal standardized group should have a mean score of 50%. That is, given to a large group of students, the average grade would be failing. Standardized tests are designed with for a 50% mean scores and wide discrimination. As such, NOSLiT should be used as a research instrument and not as an assessment for the purpose of assigning grades.
Data shows that the science literacy between grades is not significantly differ. Although the percentage still below 50% of the total number of correct questions. In some questions, the ability of students in answering the questions varied. A low score student may occur because the matter is a matter which was tested and developed for USA students, where learning and teaching science in the classrooms are totally different.
4. CONCLUSIONS
Based on the results of research and data analysis, it can be concluded that:
1. Score average of scientific literacy between grades is not significantly different. The average score are 16,86 for grade X, 15,78 for grade XI and 16,40 for grade XII.
2. Students are considered haven’t scientific literacy yet because average showed less than 50% of the amount of questions.
5. ACKNOWLEDGEMENTS
The author acknowledge to Carl J. Wenning (Illinois State University) as the author of Nature of Science Literacy Test (NOSLiT) who permits to use the instrument in Indonesia and gave some suggestion for this research.
6 REFERENCES
Association for Advancement of Science (AAAS). 1990. Science for All Americans (online).
http://www.project2061.org/publications/sfaa/online/int ro.htm
Holbrook, Jack and MiiaRannikmae. 2009. The Meaning of Scientific Literacy. International Journal of Environmental and Science Education.4(3), 275-288. Hurd, P. D. (1997). Scientific Literacy: New Minds for a
Changing World. Stanford Univerisity,407–416.
Liliasari. 2011.
MembangunMasyarakatMelekSainsBerkarakterBangsa MelaluiPembelajaran, makalahdisampaikanpada seminar nasional UNNES 2011,
http://liliasari.staf.upi.edu/files/2011/05/Makalah-Semnas-UNNES-2011.Liliasari.pdf,
Organisation for Economic and Co-operation Development (2015). PISA 2015-Draft Science Framework.
Schleicher, A. (2010). Assessing Literacy Across a Changing World. Science, 328 (5977), pp.433-434. Sugiyono. 2009. MetodePenelitianPendidikan. Alfabeta:
Bandung.
Toharudin, Uus. 2011.
MembangunLiterasiSainsPesertaDidik. Humaniora: Bandung.
Wenning, C.J. &Wenning, R.E. 2006.A Framework for Teaching The Nature Of Science.Journal of Physics Teacher Education Online, 3(3), 3-10.