Greg J. Duncan is Distinguished Professor at the School of Education at University of California, Irvine. Aaron J. Sojourner is an assistant professor at the Carlson School of Management at the University of Minnesota. The research reported here was supported by the Institute of Education Sciences, U.S. Department of Education, through Grant R305A090467 to the University of California, Irvine (George Farkas, Ph.D., PI) and by the National Institute for Child Health and Human Development, through grant HD065704 to the University of California, Irvine (Greg Duncan and George Farkas, PIs). The opinions expressed are those of the authors and do not represent views of these sponsors. The authors are grateful to Jeanne Brooks- Gunn, Peg Burchinal, George Farkas, Pamela Klebanov, Katherine Magnuson, Judy Temple, Christine Weiland, Hiro Yoshikawa, participants in the Human Capital Research Collaborative, and the editor and referees for their help and comments, and to Erik Ruzek and Juan Chaparro for research assistance. Access to the data is restricted. The IHDP data can be obtained through the Inter- university Consortium for Political and Social Research and the ECLS- B data through the U.S. Department of Educa-tion’s Institute for Education Sciences. The authors will provide additional guidance on request.
[Submitted December 2011; accepted September 2012]
ISSN 0022- 166X E- ISSN 1548- 8004 © 2013 by the Board of Regents of the University of Wisconsin System
T H E J O U R N A L O F H U M A N R E S O U R C E S • 48 • 4
Intervention Programs Eliminate
Income- Based Cognitive and
Achievement Gaps?
Greg J. Duncan
Aaron J. Sojourner
A B S T R A C T
How much of the income- based gaps in cognitive ability and academic achievement could be closed by a two- year, center- based early childhood education intervention? Data from the Infant Health and Development Program (IHDP), which randomly assigned treatment to low- birth- weight children from both higher- and low- income families between ages one and three, shows much larger impacts among low- than higher- income children. Projecting IHDP impacts to the U.S. population’s IQ and achievement trajectories suggests that such a program offered to low- income children would essentially eliminate the income- based gap at age three and between a third and three- quarters of the age fi ve and age eight gaps.
I. Introduction
advan-tage of the benefi ts of K- 12 educational investments (Knudsen et al. 2006; Ludwig and Sawhill 2007). But can any single program eliminate achievement gaps? The impacts of modern Head Start and Early Head Start programs directed at children growing up in low- income families are estimated to be modest at best, particularly when outcomes are assessed within a few years of program completion (Puma et al. 2010; Love et al. 2005).1 Some short- term impact estimates for state prekindergarten programs, which are income- targeted in some states and universal in others, are more promising (Wong et al. 2008; Gormley et al. 2008) and mixed evidence of longer- run impacts for these programs is starting to emerge (Hill et al. 2012; Ladd et al. 2012).
Evaluations of the Abecedarian (Campbell et al. 2002), Perry Preschool (Schwein-hart et al. 2005; Heckman et al. 2010), and Chicago Child- Parent Center (Reynolds et al. 2011) programs have often been cited as evidence of the long- run impacts and high benefi ts relative to costs of high- quality programs (Karoly 2001; Knudsen et al. 2006; Bartik 2011). Extracting broad policy lessons from these programs is diffi cult because all three programs were only offered to low- income and predominantly chil-dren of color and their mothers.
Scaled- up, government- funded programs might be offered universally rather than restricted to children from low- income families in the belief that they would benefi t all children, that higher- income children generate positive peer effects for low- income children, or in order to generate the political support necessary for public funding. A universal program would close income- based gaps only if its impacts were much larger for low- income children than for higher- income children and if suffi cient num-bers of low- income families chose to enroll their children in the program.
The goal of this paper is to estimate the degree to which an intensive type intervention, begun at birth or age one but lasting only until age three, would close income- based gaps in cognitive ability and school readiness. We consider both universal and targeted versions of such a program, with the targeted program restrict-ing eligibility to children livrestrict-ing in families with income within 180 percent of the poverty line.
To generate our estimates, we draw data from the Infant Health and Develop-ment Program (IHDP), which offered a package of services including free, full- day, Abecedarian- type early education to a randomly chosen subset of 985 children in eight sites scattered around the country (Gross et al. 1997). The IHDP provided seven to nine hours of daily childcare and used a game- based curriculum that emphasized language development. Eligibility was not restricted by family income, race, or eth-nicity and a demographically heterogeneous set of children and families enrolled in the study. A high- quality evaluation design included random assignment of program services to treatment and control groups and assessment of intelligence quotient (IQ) during and up to 15 years after the completion of the program.2 Published reports have shown very large impacts of the program on IQ during the program and generally
1. Longer- run impact estimates for Head Start children enrolled two or more decades ago are considerably bigger (Ludwig and Miller 2007; Deming 2009), although they employ different identifi cation strategies. Also, the use of center- based care for children in control groups has likely increased considerably, rendering it diffi cult to generalize from the experiences of older cohorts.
smaller impacts, confi ned exclusively to the heavier babies, after it ended (Brooks- Gunn et al. 1994; Gross et al. 1997; McCarton et al. 1997; McCormick et al. 2006).
Apart from the convenience- based selection of the eight study sites, the main obstacle to generalizing from the IHDP to the larger population of U.S. children is that IHDP services were offered only to babies with birth weights below the low- birth- weight (LBW) threshold (≤ 2,500 grams). Research has shown that some low- birth- weight babies, particularly those with birth weights below 1,500 grams, exhibit developmental delays (Gross et al. 1997; Klebanov, Brooks- Gunn, and McCormick 1994a). This raises the question of whether program impacts for low- birth- weight children generalize to the larger population. As detailed below, we address general-izability issues by showing increasing program impacts throughout the birth weight range and by weighting the IHDP sample to refl ect the demographic characteristics of U.S. children.
We fi nd that the IHDP program boosted the cognitive ability of low- income chil-dren much more than the cognitive ability of higher- income chilchil-dren. Although early education by family income interactions have been reported in several published studies, our results have much greater internal validity since they are based on a de-mographically and geographically diverse sample, coupled with a well- implemented random- assignment design and strong program treatment. Population projections show that either a universal or an income- based targeted program would essentially eliminate income- based gaps in IQ at age three – at the end of the program. Despite considerable fadeout of program effects, our estimates suggest that income- based gaps in age- fi ve IQ would be substantially reduced or even eliminated completely. Our increasingly imprecise estimates suggest that one- third to three- quarters of the gaps in age eight IQ and achievement would be eliminated.
II. Background
It is no secret that children from different socioeconomic strata start school with very different skills. A recent study by Duncan and Magnuson (2011) used data from the Early Childhood Longitudinal Study—Kindergarten Cohort to compare children in the bottom and top quintiles of socioeconomic status (SES). They found that low- SES children scored about 1.3 standard deviations lower than high- SES children in their kindergarten- entry reading and math skills and nearly two- thirds of a standard deviation lower in teacher ratings of attention skills. More-over, they were one- fourth of a standard deviation worse in terms of teacher- reported antisocial behavior. None of these gaps shrank over the course of elementary school, and in the case of antisocial behavior, the SES- based gap nearly doubled. More than half of the SES gaps were found within schools, which suggests that the very differ-ent kinds of schools attended by poor and affl uent children do not account for all of the gaps.
gap was twice as large.3 Given the importance of achievement skills in determining educational success, it should come as no surprise that growth in the income- based gap in children’s reading and math achievement has translated into a larger gap in schooling completed by children growing up in poor families compared with their more affl uent peers (Duncan and Murnane 2011).
What might be done to close these gaps? Early childhood education (ECE) pro-grams are seen by many as a way of improving the schooling readiness of children and enabling them to take full advantage of the benefi ts of K- 12 educational invest-ments (Knudsen et al. 2006). As with many other social programs, ECE services can be targeted toward low- income children or offered universally regardless of economic need (Scokpol 1991; Greenstein 1991; Barnett et al. 2004). The value of targeting ECE programs on low- income preschool children is ambiguous owing to competing hypotheses about differential program effects can be found in developmental research and theory. A compensatory hypothesis (Sameroff and Chandler 1975) predicts that children who are at risk because of economic disadvantage, low skills, diffi cult tem-peraments, etc. derive greater benefi t from skill- building high- quality early education programs relative to children who are not at risk. This hypothesis provided the ratio-nale for the initial and continued funding for programs such as Head Start and Early Head Start. However, some have argued for a Matthew effect hypothesis (for example, Stanovich 1986) in which children with greatest initial advantages will profi t the most.
We know very little about the comparative effectiveness of infant / toddler and pre-school programs for children from low- versus high- income families. The best- known programs (Abecedarian, Perry, and the Chicago Parent- Child Program) restricted eli-gibility to low- income and / or disadvantaged minority children. Recent evaluations of the national Head Start and Early Head Start programs also are constrained by income limits on eligibility for both programs, although both Loeb et al. (2007) and Magnuson et al. (2004) shows that associations between attending Head Start or center- based care and kindergarten test scores are somewhat stronger for subgroups with the lowest socioeconomic status. The Oklahoma Pre- K program offered services to children who qualifi ed for the free or reduced- price lunch program as well as children who did not. Also in line with the compensatory hypothesis, Gormley et al.’s (2008) evaluation found considerably higher impacts for the former than the latter group.
As with the Oklahoma Pre- K sample, income- based eligibility criteria were not part of the Infant Health and Development Program, which offered a package of services including free, full- day, Abecedarian- type childcare to a randomly chosen subset of the 985 mothers and children that it recruited. These children were born in hospitals in eight sites scattered around the country, leading to the enrollment of a very demo-graphically heterogeneous set of children and parents. We build on the IHDP’s diverse sample and experimental design to estimate the extent to which income- based gaps in school readiness would be closed by such a program.
III. Approach and Data
A. Approach
The Infant Health and Development Program was designed to deliver the center- based Abecedarian curriculum to an economically and ethnically diverse sample of one and two year olds in eight sites scattered around the country (McCarton et al. 1997). How-ever, all infants recruited into the IHDP study were born LBW (≤ 2,500 grams = 5.51 pounds) and premature (gestational age at birth ≤ 37 weeks). The motivation for this restriction was that, while the Abecedarian curriculum had been shown to enhance cognitive outcomes for normal- birth- weight, socially disadvantaged children, no em-pirical evidence existed about its effectiveness for LBW children. IHDP documenta-tion notes that neonatologists favored the inclusion of only the very low- birth- weight infants (≤ 1,500 g), who are known to be at greatest risk for developmental disabilities but that program developers also felt that it was important to assess impacts in a popu-lation where there was some evidence of effectiveness. To balance these two concerns, “it was decided to include infants weighing ≤ 2,500 g with gestational age ≤ 37 weeks, but to stratify the sample into two weight groups. The “lighter” group (≤ 2,000 g), would make up two- thirds of the sample, and the “heavier” group (2,001–2,500 g) would compose one- third of the sample” (Gross et al. 1997).4 Program takeup was high, the curriculum appeared to be well implemented, attrition through age eight was modest, and a rigorous randomized controlled trial (RCT)- based design provides treat-ment estimates for a series of IQ and achievetreat-ment measures both for the entire IHDP sample and for low- and higher- income subsamples.
Two factors in particular make it diffi cult to generalize from the IHDP to the U.S. population: All IHDP infants were born low- birth- weight and, although diverse, the de-mographic characteristics of IHDP families do not match closely to those of the general population. To address the low- birth- weight issue, we fi rst present evidence showing that the developmental trajectories of the IQs of low- birth- weight children in the Early Childhood Longitudinal Study—Birth Cohort (ECLS- B) roughly parallel those of normal- birth- weight children. Then, we show that the IHDP sample includes a substantial number of children near the 2,500- gram low- birth- weight threshold and, most importantly, that IHDP program impacts are, if anything, increasing throughout the entire range of birth weights. This leads us to base our estimates only on the IHDP babies with birth weights above 2,000 grams, conventionally designated as high low- birth- weight (HLBW).
To correct for demographic misalignment, we develop and apply a set of ratio esti-mating weights to the IHDP sample based on ECLS- B joint distributions of race / eth-nicity, income, maternal education and marital status. The procedures for obtaining estimates are as follows. Defi ne D as an indicator that a child’s family income is below 180 percent of the poverty threshold.5 Defi ne T as a treatment indicator. If we could assign treatment at random in the nationally representative ECLS population, we would estimate:
4. This stratifi cation into higher- and lower- birth- weight groups was the only baseline interaction specifi ed ex ante by the study designers. Based on the medical, developmental, and neurobiological evidence available, they recognized that treatment effects would likely vary between these two strata.
(1) YE = a0 - a1D + a2T + a3D*T + e
where YE is IQ or achievement measured in the ECLS- B at various ages during or after the end of the hypothetical program. The “E” subscript denotes an ECLS- B- based estimate. A minus sign precedes the expected negative coeffi cient on D (a1) so that the sign on the outcome gap between groups is positive. As shown in Table 1, a1 measures the gap between average outcome levels for children from higher- income families compared to those from low- income families in the absence of treatment. The effect of universal (offered to the entire population of one- to three- year olds) and targeted (offered only to one- to three- year- old children with family income below 180 percent of the poverty line) programs on outcomes and on the income- based gap could be esti-mated as described in Table 1. However, T=0 in the ECLS- B’s national sample, so we cannot identify the portion of the gap closed by a program (Ca). We can only estimate
a1, the observed “raw” gap absent treatment.
To estimate C, we use the weighted IHDP HLBW sample to generate estimates of
b1, b2, and b3 from:
(2) YI = b0 - b1D + b2T + b3D*T + (Site Dummies) + u
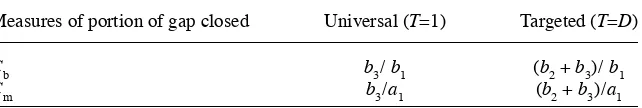
where YI is IQ or achievement measured in the IHDP at various ages during or after the end of the program and the “I” subscript denotes an IHDP- based estimate. This gives analogous estimates of the percentage of gap (Cb) that would be closed by a targeted or universal program, which can be seen by replacing all “a” terms in Table 1 with their analogous “b” terms.
Then, a1*Cbestimates the magnitude of the closure that would be achieved by ap-plying IHDP- based treatment effects to the weighted IHDP- based gap and a1*(1- Cb) estimates the magnitude of the residual gap. As a measure of the gap, one might in-stead prefer the observed ECLS- B gap rather the weighted IHDP- based gap and ask how much of this gap would a given program close. This amounts to replacing the “a”s with “b”s in the numerators of Table 1 ratios but leaving a1 in the denominators. Call these gap- closing estimates Cm (Table 2).6
6. Suppose Y1 = cY2 + d so that the ECLS IQ scores (Y1) are a linear function of IHDP IQ scores (Y2). Then
Cb is less biased than Cm unless c=1, in which case they are the same. Table 1
Construction of hypothetical gap closing estimates from the ECLS- B
No program (T=0)
Universal
(T=1) Targeted (T=D)
Predicted outcome among higher income (D=0)
a0 a0 + a2 a 0
Predicted outcome among low income (D=1)
a0 – a1 a0 – a1 + a2 + a3 a0 – a1 + a2 + a3
Predicted gap a1 a1 – a3 a1 – a2 – a3
B. Data
As described in the “Approach” section, the Infant Health and Development Program was an eight- site randomized clinical trial designed to evaluate the effi cacy of a com-prehensive early intervention program for low- birth- weight premature infants. Infants weighing 2,500 g or less at birth, regardless of parental income status, were screened for eligibility if their postconceptional age between January and October 1985 was 37 weeks or less and if they were born in one of eight participating medical institutions. Following hospital discharge, a total of 985 infants were randomly assigned either to a comprehensive early childhood intervention group or to a control group that was offered only a package of free medical services explained below.
Children in the treatment group received weekly home visits through 12 months of age, which consisted of a curriculum of child development and parenting education, mental health counseling and support, and referral to social services within the com-munity. Despite these services, there were no signifi cant treatment impacts at age 12 months on either the children or their home environments(Bradley et al. 1994). Home visits continued on a biweekly basis between ages one and three.
Between ages one and three, children in the treatment group were also entitled to attend the free, high- quality IHDP- run child development center located in each city. The curriculum was based on the one used in the Abecedarian Preschool program (Campbell et al. 2002). Free transportation was made available to encourage up. Infants in both the treatment and control groups also participated in a pediatric follow- up program of periodic medical, developmental, and familial assessments from 40 weeks of conceptional age (when they would have been born if they had been full term) to 36 months of age, corrected for prematurity.
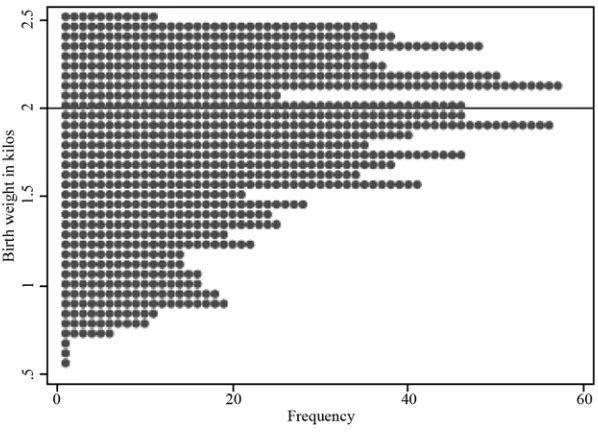
A frequency distribution of the birth weights of the 985 infants is shown in Figure 1. Most of the infants weighed between 1,500 and 2,500 grams. For reasons detailed below, our analysis will concentrate on the 362 heavier low- birth- weight children in the 2,001–2,500 gram range.
We draw our data from a variety of sources—maternal- report questionnaires, home visits, and laboratory tests. Assessment ages for the IHDP are one, two, three, fi ve and eight. The IHDP provides the following cognitive measures: the Bayley IQ mental subscale at ages one and two;the Stanford- Binet IQ mental subscale at age three; the Wechsler Preschool and Primary Scale of Intelligence (WPPSI) Full Scale IQ at age fi ve; and the Wechsler Intelligence Scale for Children (WISC) at age eight. We also study math and reading achievement at age eight as measured by Woodcock- Johnson tests. To preserve comparability with national norms, we standardize all individual outcomes
Table 2
Gap closing estimates based on the IHDP and mixed IHDP / ECLS- B
Measures of portion of gap closed Universal (T=1) Targeted (T=D)
Cb b3 / b1 (b2 + b3) / b1
into z- scores that have mean zero and standard deviation one, using the national norms provided by the tests’ original developers. All are high- quality, well- validated measures.
One of our analytic goals is to estimate differential treatment effects by income. Our indicator of low- income status is based on whether family income as reported by the mother when the child was 12 months old was below 180 percent of the poverty line (Leventhal and Brooks- Gunn 2001). Some 10.2 percent of mothers failed to report in-come in that interview. We assume these inin-come data are missing at random conditional on observables and use multiple imputation to make inference (Little and Rubin 1987).77
7. For each of the 37 children with a missing income / needs ratio, we impute a low- income indicator using a probit model conditional on a set of fully observed preassignment characteristics: maternal age, race, education, number of living children, and previous number of LBW, premature children at time of study child’s birth; study child’s weight, gestational age, neonatal health index, and parity order at birth; and study site indicators. Identifi cation as-sumes that low- income status is missing at random conditional on these covariates. Each case has ten imputed rep-licates. The low- income status of most of these cases appears quite certain on the basis of the baseline observables used for imputation. Consider the frequency of number of replicates imputed low- income among the 37 cases.
Number of replicates imputed low- income 0 1 2 3 4 5 6 7 8 9 10 Total
Frequency 0 1 0 0 2 2 3 6 3 11 9 37
Twenty- one cases (57 percent) have either all or all but one of their 10 replicates imputed to the same low- income status. In only seven cases (19 percent) is the number of replicates imputed as low- income within two of the number of replicates imputed as not low income.
Figure 1
Dotplot of birth weight distribution in IHDP sample.
To assess sensitivity of the results to this assumption, we also relax it and estimate bounds on key parameters considering all possible values for the missing indicators (Horowitz and Manski 2000; Horowitz et al. 2003). Given the random assignment na-ture of the IHDP treatment, we use baseline measures in some specifi cations to control for small demographic differences in the treatment and control groups and improve the precision of the experimental estimates of treatment effects. These baseline measures include maternal- report data on race / ethnicity (with indicators of African- American and Hispanic status) and maternal education level (four categories—less than high school, high school graduate with no college, high school graduate with some college, and college graduate). At the child level, we control for child’s sex, birth weight in grams, gestational age at birth in weeks, a neonatal health index, maternal age in years at child’s birth, and a set of site dummies. These variables have no missing observa-tions.
Response rates were high in the early waves of IHDP data collection but lower for the longer- run followups. For the sample of high- low- birth- weight children used in our analyses, response rates for IQ tests were 91.1 percent, 88.9 percent, 90.6 percent, 81.4 percent, and 85.9 percent at age one, two, three, fi ve, and eight, respectively. Outcome data are assumed missing at random conditional on covariates and, for each outcome, cases with missing outcome data are dropped.8
As described in the online appendix, the more familiar ECLS- B has followed to kindergarten entry a large, nationally representative sample of children born in 2001. We use the ECLS- B- provided weights to make the sample nationally representative adjusting both for differential sampling probabilities and for differential nonresponse. The ECLS- B provides the following cognitive measures: a reduced- item form version of the Bayley (Bayley Short Form- Research Edition) designed to produce equivalent scores to the original Bayley Scales of Infant Development mental subscale at age 24 months; the Peabody Picture Vocabulary Test and ECLS- B developed literacy and math assessments at age 48 months; and ECLS- B developed reading and math as-sessments at kindergarten entry. All of these tests have been normed to the general population. We also utilized the following demographic measures from the ECLS- B: maternal education in years, maternal race, ethnicity, and marital status, household size, and child birth weight.
C. Population weights
Although the IHDP sample is economically and ethnically diverse, it was not de-signed so that its demographic characteristics matched those of any larger population. To correct for this, we construct a set of weights based on the relative frequency of observations that fell into cells defi ned jointly by family income (below or above 180 percent of the poverty line), race / ethnicity (African- American, Hispanic, or other—mostly white / non- Hispanic), maternal schooling (no college or at least some college) and marital status (married or not) in the IHDP HLBW subsample and the ECLS- B sample.All of these demographic characteristics were measured at nine
months in the ECLS- B and at birth in the IHDP, except for family income status, which was measured at 12 months in the IHDP. The details of these procedures and comparisons of the unweighted and weighted IHDP sample are provided in the online appendix.
IV. Results
A. Trajectories of low- and normal- birth- weight babies
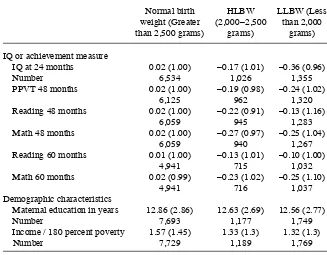
Because the ECLS- B is nationally representative, oversampled low- birth- weight births and measured cognitive ability repeatedly up to the point of kindergarten en-try, it is well suited for providing data on the developmental trajectories of low and normal- birth- weight babies. Using the full, weighted ECLS- B sample to standardize its IQ measures to have mean zero and standard deviation of one, Table 3 shows IQ scores at various ages for normal birth weight (more than 2,500 grams), high- low
Table 3
Means and standard deviations for ECLS- B measures of cognitive ability and achievement trajectories, for normal birth weight, HLBW, and LLBW children
Normal birth weight (Greater than 2,500 grams)
HLBW (2,000–2,500
grams)
LLBW (Less than 2,000
grams)
IQ or achievement measure
IQ at 24 months 0.02 (1.00) –0.17 (1.01) –0.36 (0.96)
Number 6,534 1,026 1,355
PPVT 48 months 0.02 (1.00) –0.19 (0.98) –0.24 (1.02)
6,125 962 1,320
Reading 48 months 0.02 (1.00) –0.22 (0.91) –0.13 (1.16)
6,059 945 1,283
Math 48 months 0.02 (1.00) –0.27 (0.97) –0.25 (1.04)
6,059 940 1,267
Reading 60 months 0.01 (1.00) –0.13 (1.01) –0.10 (1.00)
4,941 715 1,032
Math 60 months 0.02 (0.99) –0.23 (1.02) –0.25 (1.10)
4,941 716 1,037
Demographic characteristics
Maternal education in years 12.86 (2.86) 12.63 (2.69) 12.56 (2.77)
Number 7,693 1,177 1,749
Income / 180 percent poverty 1.57 (1.45) 1.33 (1.3) 1.32 (1.3)
Number 7,729 1,189 1,769
birth weight (2,000–2,500 grams), and low low birth weight (less than 2,000 gram) babies.
Age 24 months is the fi rst point at which IHDP’s evaluation measured impacts of its center- based ECE services. In the ECLS- B, measured IQs of HLBW babies at 24 months are about one- sixth of a standard deviation below those of normal- birth- weight babies; the gap for low- low- birth- weight (LLBW) babies is about twice as large. In the case of HLBW babies, the IQ and, at 48 and 60 months, achievement gaps are within 0.10 standard deviation of the 24- month IQ gap, suggesting roughly parallel trajectories. In the case of LLBW babies, the 24- month gap is larger than any of the later gaps, and math gaps tend to be consistently larger than reading gaps.9 This adds to our confi dence that that result from the IHDP’s HLBW babies may generalize and our wariness that results from the IHDP’s LLBW babies may not.
B. Marginal treatment effects by birth weight
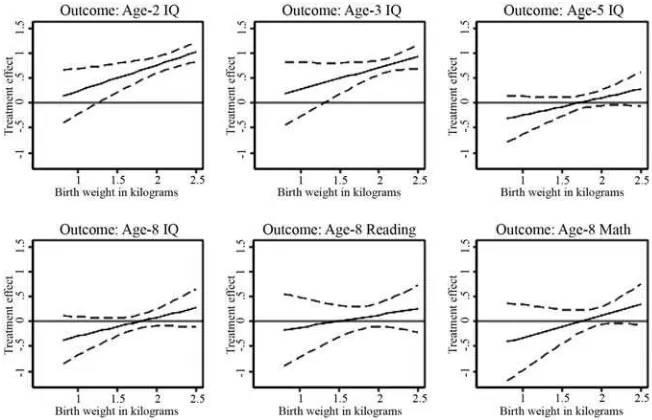
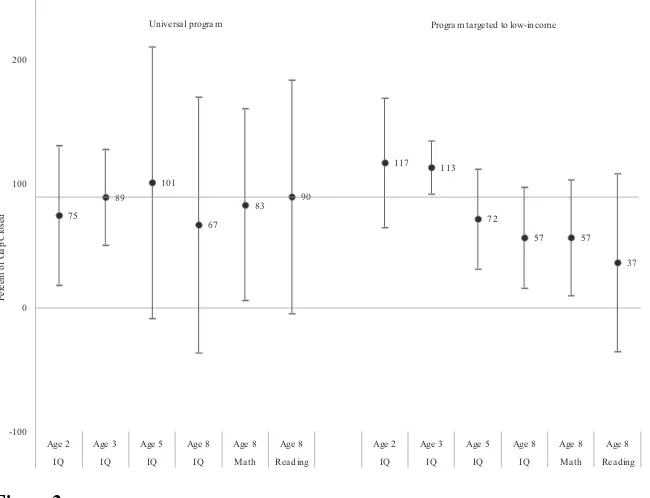
We next examined IHDP treatment effects by age and birth weight for any indication that treatment effects declined with birth weight, which would raise concerns that IHDP treatment effects might not generalize to normal- birth- weight babies. If any-thing, the opposite was true. Marginal treatment effects with 95 percent confi dence bands are shown in Figure 2 for standardized IQ measures taken at ages two, three,
fi ve, and eight, and age- eight math and reading achievement.10 We fi t linear through fourth- order polynomials and found that the results were generally quite similar. For the sake of conciseness we show only linear interactions here and fourth- order poly-nomials as Appendix Figure 1.
9. Developmental trajectories of the lighter and heavier LBW babies differed within the IHDP sample as well. Klebanov, Brooks- Gunn, and McCormick (1994b) study school achievement outcomes among different birth- weight strata using a sample that includes both normal- and low- birth- weight children. They fi nd only small differences between the normal birth weight (NBW) (> 2, 500 g) and heavier LBW (1,501 - 2,500 g) strata. Differences become pronounced in comparisons to very LBW (1,001–1, 500 g) and extremely LBW children (< 1,000 g). Since the HLBW sample used below includes only the top half of the heavier LBW range they consider (2,001–2,500 g), differences with normal- birth- weight children should be even more muted. In another paper, Klebanov, Brooks- Gunn, and McCormick (1994a) compared strata’s elementary school classroom behavior and fi nd even fewer differences between NBW and HLBW children. As part of a broader literature on the cognitive development of low- birth- weight children, McDonald (1964) tested the IQs of over 1,066 children aged six to nine who weighed less than four pounds at birth. He writes: “When compared with a national sample (of Britain and Wales) matched on social class, the mean I.Q. of 98.4 found in the sample was lower than the expected mean of about 103 in Britain at the present time. But when the 107 children with cerebral palsy, blindness, or deafness were excluded and in addition 11 (1.8 per cent.) children with I.Q.s below 50, which may be considered to be pathologically low, the mean was 102.4. There was thus no evidence that, when children with these handicaps were excluded, the mean I.Q. differed from that of the general population.” Jefferis et al. (2002) draw on data from the 1958 British birth cohort to develop evidence on whether normal- birth- weight and low- birth- weight children experience roughly parallel developmental trends in math achievement. Of particular relevance to our study, they examine this question separately for children of higher and lower social class, corresponding roughly to children of higher- and lower- income families in our study. Among children of higher social class, those born LBW experience the same changes in achievement as those born normal birth weight. Among children of lower social class, those born LBW experience similar changes in achievement as those born normal birth weight. The levels of achievement are generally lower for LBW versus normal- birth- weight children. However, trends are similar.
Substantial and statistically signifi cant treatment effects on IQ are apparent for most birth weights in the middle (age two) and the very end (age three) of the center- based IHDP treatment. In all cases, treatment effects in the 2,000–2,500 gram range (the defi nition of high LBW) are at least as large as treatment effects at lighter birth weights. At ages fi ve and eight (three and fi ve years after the end of the program, respectively), treatment / control group differences are less apparent, although in all cases the treatment group advantages are at least as large for the HLBW babies as for the lighter- birth weight babies. The consistently rising marginal treatment effects for all outcomes across the 2,000 to 2,500 grams range suggest that patterns of treatment effects for the HLBW children can provide a useful basis for generalizing to at least those normal- birth- weight babies who are at the lighter end of the normal birth weight spectrum assuming the smooth pattern continues.
C. Treatment main effects and interactions
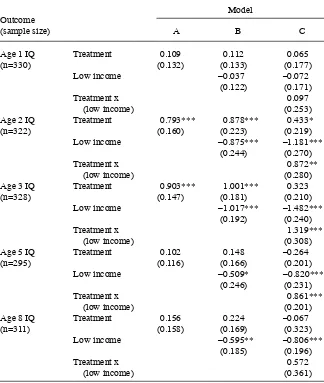
Proceeding on the assumption that the ECLS- B- weighted sample of HLBW babies in the IHDP sample can be used to estimate treatment interactions with income, we present estimates from ordinary least squares (OLS) regression models for all of the available IQ (Table 4) and achievement (Table 5) measures in the IHDP. Each table shows coeffi cients from three models: (i) T only; (ii) T and D entered additively, and (iii) T and D main effects and their interaction. In all cases we include controls for site, the child’s sex, gestational age at birth, birth weight, and neonatal health index.
Figure 2
Table 4
Treatment effects on IQ z- score by low- income status using IHDP HLBW sample with ECLS- B weights.
Outcome (sample size)
Model
A B C
Age 1 IQ Treatment 0.109 0.112 0.065
(n=330) (0.132) (0.133) (0.177)
Low income –0.037 –0.072
(0.122) (0.171)
Treatment x 0.097
(low income) (0.253)
Age 2 IQ Treatment 0.793*** 0.878*** 0.433*
(n=322) (0.160) (0.223) (0.219)
Low income –0.875*** –1.181***
(0.244) (0.270)
Treatment x 0.872**
(low income) (0.280)
Age 3 IQ Treatment 0.903*** 1.001*** 0.323
(n=328) (0.147) (0.181) (0.210)
Low income –1.017*** –1.482***
(0.192) (0.240)
Treatment x 1.319***
(low income) (0.308)
Age 5 IQ Treatment 0.102 0.148 –0.264
(n=295) (0.116) (0.166) (0.201)
Low income –0.509* –0.820***
(0.246) (0.231)
Treatment x 0.861***
(low income) (0.201)
Age 8 IQ Treatment 0.156 0.224 –0.067
(n=311) (0.158) (0.169) (0.323)
Low income –0.595** –0.806***
(0.185) (0.196)
Treatment x 0.572
(low income) (0.361)
Results for the main coeffi cients of interest are summarized in Table 4, with complete details in Appendix Tables 3–5.
Average treatment effect estimates on IQ for this sample of HLWB babies are given in Model A of Table 4. Consistent with Figures 2–4, large treatment effects emerge by age two, peak at age three and, while point estimates continue to be positive, become statistically insignifi cant by age fi ve. Treatment impacts on ages eight achievement are insignifi cant as well. Model 2 adds a “low income” dummy variable to the model. Es-timates show that the age two and three IQs of children reared in low- income families score close to one standard deviation below those of higher- income children, while age fi ve and eight IQs are half to two- thirds of a standard deviation lower for children reared in low- income families. All of these differences are statistically signifi cant. Table 5 shows that achievement differences are similar to the IQ differences, with a range between one half and one standard deviation between low and high income children across different ages and subjects.
Treatment effect differences between low and higher- income children are estimated by the coeffi cient on the Treatment by Low income interaction variable in Model C. In this specifi cation, the coeffi cient on the “Treatment” dummy represents the esti-mated program impact for children from higher- income families. Treatment impacts on IQ are estimated to be much larger for children from low- income families than for children from higher- income families – by 0.87 standard deviation (sd) at age two and 1.32 sd at age three. These differences persist two years after the end of the program,
Table 5
Treatment effects on achievement z- score by low- income status using IHDP HLBW sample with ECLS- B weights
Outcome (sample size)
Model
A B C
Age 8 reading Treatment –0.116 –0.041 –0.456
(n=308) (0.209) (0.261) (0.267)
Low income –0.643*** –0.936***
(0.156) (0.123)
Treatment x 0.804***
(low income) (0.184)
Age 8 Math Treatment 0.120 0.187 –0.137
(n=312) (0.149) (0.206) (0.197)
Low income –0.594* –0.830**
(0.257) (0.281)
Treatment x 0.636**
(low income) (0.224)
as is evident from the statistically signifi cant +0.86 sd interaction coeffi cient at age
fi ve. The point estimate for the treatment- by- income interaction (+0.57 sd for age eight IQ) is substantial in size but statistically insignifi cant. Interaction coeffi cients on read-ing and math achievement at age eight are both substantial and statistically signifi cant. The magnitude of these interaction coeffi cients suggests that an IHDP- type program may well eliminate quite a bit of the income- based IQ and achievement gaps.
The “Treatment” variable in Model C provides an estimate of the program’s treat-ment effect on higher income children. Point estimates for all age fi ve and eight IQ and achievement measures are negative although always statistically insignifi cant. So while the sign of the point estimate might suggest that the program hurt the cognitive development of higher income children relative to their high- income counterparts in the control group, these estimates are imprecise and 90 percent confi dence intervals include positive effects as well. We return to this point in our discussion section.11
C. Gap closing
We now apply ECLS- B- based population weights to the IHDP data on treatment ef-fect interactions to estimate the extent to which income- based IQ and achievement gaps would be closed by an IHDP- type early education intervention between ages one and three offered either universally or targeted only to low- income children (Table 6 and Figure 3).12 The second row of Table 6 shows that at age two, after one year of the early childhood education curriculum, the 0.82 sd higher treatment effect for low- relative to high- income children closed 75 percent of the 1.35 sd gap in the case of a universal program and 117 percent of the gap if the program was offered only to low- income children. A 95 percent confi dence interval for the share of this age- two gap closed by a universal program ranges from 34 percent to 116 percent, while the confi dence interval for the share closed by a targeted program ranges from 78 percent to 158 percent. The extent to which income- based gaps at age three would be closed by an Abecedarian- type program is somewhat greater than at age two in the case of a universal program and slightly less in the case of a targeted program.
A key question motivating our efforts is whether a very high- quality infant and tod-dler program might be able to close the school readiness gap between low and higher income children. The age- fi ve IQ results presented in Table 6 suggest that virtually all of the income- based gaps would be closed by a universal program. Although it does not include zero, the large confi dence interval for the universal program estimate suggests caution against over- interpreting this point estimate. Surprisingly, only 72 percent
11. While not of direct interest in this study, it is worth noting that the treatment effect estimates for children from low- income families obtained from this model are:
Outcome Coeffi cient SE p- value
Age 2 IQ 1.290 (0.263) 0.002
Age 3 IQ 1.630 (0.262) 0.000
Age 5 IQ 0.586 (0.192) 0.018
Age 8 IQ 0.500 (0.163) 0.018
Age 8 reading 0.350 (0.257) 0.216
Age 8 math 0.500 (0.263) 0.099
High- low income gap
IHDP treatment effect for nonlow- income
subsample
IHDP treatment* Low- income
interaction
Percent Gap closed from universal
program
Percent Gap closed from targeted program
Age and outcomes IHDP mean difference b1 b2 b3 Cb Cb
IQ at 9 or 12 months 0.24* 0.01 0.11 0.04 159 999
(0.14) (0.18) (0.18) (0.25) (100545) (182168)
IQ at age 2 1.35*** 1.09** 0.46* 0.82** 74.8** 117.2***
(0.18) (0.28) (0.23) (0.30) (22.2) (20.8)
IQ at age 3 1.76*** 1.42*** 0.34 1.28*** 89.4*** 113.4***
(0.17) (0.24) (0.21) (0.31) (15.2) (8.4)
IQ at age 5 1.08*** 0.76** –0.22 0.77** 101.2* 71.8***
(0.14) (0.21) (0.22) (0.22) (43.7) (15.8)
IQ at age 8 1.03*** 0.77*** –0.08 0.52 67.1 56.7**
(0.15) (0.17) (0.29) (0.34) (40.9) (15.9)
Reading at age 8 or Grade 3 1.08*** 0.82*** –0.44 0.74** 89.7* 36.6
(0.18) (0.13) (0.27) (0.23) (37.4) (28.6)
Math at age 8 or Grade 3 0.96*** 0.76** –0.20 0.64** 83.6** 56.8**
(0.19) (0.24) (0.19) (0.22) (30.6) (18.6)
of the income- based gap in age- fi ve IQ would be closed with a targeted program. The counterintuitive reduced effectiveness for targeted relative to universal programs comes from the negative point estimate of age- fi ve IQ impacts for children with in-comes above 180 percent of the poverty line. It is important to bear in mind that the negative treatment impacts estimated for the age fi ve IQs of higher- income children was not statistically signifi cant and that the confi dence intervals on gap reductions for targeted and universal program overlap considerably.
Although not all of the impact estimates at age eight are statistically signifi cant, the pattern suggests that a universal program would reduce income- based gaps by more than half, while a targeted program would reduce gaps by one- third to about one- half. Here again, the overlap between the confi dence intervals of target and universal pro-gram is considerable and none of the underlying negative treatment impacts estimates for the IQ and achievement of higher- income children was statistically signifi cant. While we can usually reject the null hypothesis of no gap closing, we cannot reject the hypothesis of similar gap closings for targeted and universal programs.
The results presented in Tables 6–8 rest on the assumption that the data on low- income status is missing at random, which helps to provide point identifi cation and is necessary to justify use of multiple imputation. However, if this identifying condition was not valid, it is possible that results would change substantially. Estimates can be
75
Universa l progra m Progra m ta rgeted to low-income
Figure 3
more sensitive to missing covariate data than to missing outcome data.13 To assess the sensitivity of the results to the missing- at- random assumption, we relax it and study the set of parameter values consistent with the model and the observed data, considering all possible combinations of values for the missing low- income indicators. We estimate the model for each outcome and for each possible combination of miss-ing low- income indicator values. Across all possible combinations, the minimum and maximum estimated value of each parameter is recorded, providing point estimates of the lower and upper bounds on each parameter.14 These are reported in Table 7. By and large their ranges are consistent with the picture provided by our previous analysis.
V. Discussion
Our paper has sought to estimate how much an intensive two- year based Abecedarian- type intervention begun at age one would close income- based gaps in cognitive ability and school readiness. The analysis suggests that at age three—at the end of the program— income- based gaps would be essentially eliminated with either a universal or income- based targeted program. Income- based gaps in age fi ve IQ were also substantially reduced (in the case of a targeted program) or completely eliminated (for a universal program). Our increasingly imprecise estimates suggest that one- third to three- quarters of the gaps in age eight IQ and achievement would be eliminated.
These results make two contributions. First, they inform the debate over targeted versus universal ECE programs by taking advantage of a well- implemented, intensive early education treatment administered to a demographically and geographically di-verse sample of children. Results from its random- assignment evaluation design show how much more the IQs of low- than higher- income children profi t from such treat-ments. Second, we use demographic methods to project the impacts of these results to the national population of young children living in low- and higher- income families.
Although it is certainly encouraging to see that school readiness gaps between high and low- income children might be reduced or even eliminated with an intensive early education program, several cautions are in order. First, prudent policy planning should be based on a comparison of benefi ts and costs of competing programs, as well as evidence that scale- up does not compromise program impacts. In contrast with results from the current paper and others based on model programs targeting children from low- income families, recent evaluations of the Early Head Start (Love et al. 2005) and Head Start (Puma et al. 2010) programs have not produced evidence of large impacts on low- income children in the short run, although there is evidence of substantial long- run effects from Head Start programs (Ludwig and Miller 2007; Deming 2009). Early Head Start (EHS) is the federal program closest to the IHDP in design. Both EHS and the IHDP offer families a mix of home visiting and center- based care for children up to age three. Why the difference in effects between EHS and IHDP? One
13. To get some intuition for why, note that for an estimator of β = (X’X)- 1(X’Y), missing Y data enter only
the numerator while missing X data enter both the numerator and denominator.
income status
High- low income gap: b1
IHDP treatment effect for nonlow- income
subsample: b2
IHDP treatment* Low- income interaction: b3
Percent of gap closed from universal
program: Cb
Percent of gap closed from targeted
program: Cb
Parameter Minimum Maximum Minimum Maximum Minimum Maximum Minimum Maximum Minimum Maximum
Age- 1 IQ –0.03 0.01 –0.12 0.18 –0.08 0.41 –3.7M 8.9M –3.3M 8.2M
Age- 2 IQ 1.05 1.13 0.09 0.55 0.66 1.31 60.7 122.1 108.9 131.1
Age- 3 IQ 1.29 1.45 –0.04 0.48 1.06 1.75 79.5 125.7 110.1 129.0
Age- 5 IQ 0.71 0.80 –0.48 – 0.16 0.65 1.12 88.2 146.2 65.1 85.0
Age- 8 IQ 0.70 0.82 –0.36 0.01 0.37 0.86 50.1 110.8 50.4 70.8
Age 8 reading 0.74 0.89 –0.89 –0.34 0.57 1.26 73.8 158.9 29.4 56.5
Age 8 math 0.70 0.81 – 0.59 – 0.13 0.51 1.15 70.0 153.1 50.5 75.3
possibility is that the difference in effects derives from differences in program inten-sity and quality. For instance, according to calculations based on Love et al. (2005), the average Early Head Start participant received 437 hours of center- based care. In contrast, the average member of the IHDP treatment group received 260 days of center- based care, or 2,080 hours if attending for eight hours a day. Moreover, the IHDP went to great lengths to ensure that care standards were uniformly high and the curriculum was well implemented, while the quality of Early Head Start programs is more variable (Love et al. 2005; Vogel et al. 2011).
As with any high- quality center- based program for infants and toddlers, the low (three to one) staff- to- student ratio and other services offered in their Abecedarian- type treatment made IHDP services relatively expensive.15 Evidence from state pre- K pro-grams suggests that relatively high- quality care can be taken to scale. Many state programs targeting primarily three and four year olds have been implemented at large scales in recent years. Early reports show positive short- run achievement effects of some (Wong et al. 2008), especially for low- income children (Bartik 2011), and there is some emerging evidence of positive effects on age- eight achievement (Hill et al. 2012; Ladd et al. 2012).
We do not know whether the IHDP treatment could be scaled up in a general way, although the curriculum of the IHDP itself replicated the curriculum used in Abece-darian and was successfully implemented in eight sites scattered around the country. If the program were scaled up to a national program, the current study suggests the intensive, high- quality services it would provide could make a large, persistent posi-tive impacts on low- income children’s cogniposi-tive skill and academic achievement and reduce, if not eliminate, the early skills gap between America’s children from low and higher- income families.
A second cautionary note is that success in closing income- based gaps may not generalize directly to success in closing gaps defi ned by race or ethnicity. Reardon (2011) shows that trends in the racial gap in tests scores are quite different than trends in income- based test- score gaps. When we repeated our OLS regressions of IHDP treatment impacts on IQ and achievement differences between blacks and whites and between Hispanics and non- Hispanic whites, we did not fi nd the kinds of consistent impact patterns favoring minority children as we did for low- income children.16 This is an important issue for future research.
15. Gross et al. (1997) report that running IHDP’s Miami childcare site for the fi nal year (children in their third year of life) cost $15,146 per child. Converting to 2006 dollars using CPI and multiplying by two years puts the cost of the childcare treatment at just over $60,000. This does not include the modest home- visiting portion of the treatment that was offered when children were between ages one and three. Because the costs may be lower in a program that has run for many years, they study the costs of other similar, nonexperimental childcare programs available to children with developmental disabilities. If we apply the same adjustments, the two- year estimates total about $48,000. For a similar program that served children free of disabilities and which did not provide transportation, the two- year cost would be about $29,000.
Third, the evolving patterns of impacts found for low- and higher- income chil-dren depend upon the quality of care for control- group chilchil-dren during and after the program. If current patterns of care quality for low and high- income children differ from those in the late 1980s, then the patterns of impacts and gap closings found here may not generalize to the current day. However, Leventhal et al. (2000) reports that, in the full IHDP sample at age fi ve, average preschool attendance was 24.1 and 23.0 hours / week in the control and treatment groups, respectively. Using the ECLS- B’s nationally representative sample of four- year- olds in 2005, Jacobson Chernoff et al. (2007) reports that 57.5 percent of children report attending center- based care. If these children attended an average of 40 hours per week, this would yield a population average of 23 hours / week attendance, very close to the IHDP, age- fi ve average. Fur-thermore, center- based care participation does not vary by birth weight in the B. Taken together, this suggests that patterns of center- based care use are similar in these two samples.
Fourth, while treatment effects on the IQs of higher- income children are positive and signifi cant during and at the end of the program, point estimates of IQ and achieve-ment at age fi ve and eight for these children are not statistically signifi cant at conven-tional levels. The point estimates are noisy but negative, which produces a larger point estimate of the fraction of gap closed for the universal than the targeted program. However, the two programs are estimated to have similar confi dence intervals for frac-tion of gap closed and this seems a more appropriate way to interpret the results. The estimates provide strong evidence that a targeted program would close a large share of the gap and that a universal program would produce similar results, since the program appears to have no signifi cant effect for children from higher- income families.17
Fifth, unlike Abecedarian, Perry or Child- Parent Centers, the IHDP treatment de-livered services in a center serving a heterogeneous group of children. If peers matter, then this is part of the treatment effect. A targeted program that delivers care in a setting with a more homogeneous group of children may produce different results.
More than two decades ago Lisbeth Schorr wrote of the promise of early childhood intervention programs in a book titled Within Our Reach (Schorr 1989). More recent work has echoed this theme (for example, Ludwig and Sawhill 2007; Kirp 2007). At that time, she could only speculate on whether income- based achievement gaps might be closed with intervention programs. Although based on an experiment involving low- birth- weight children, our analysis provides more concrete evidence supporting these conjectures about the potential of early childhood interventions to close achieve-ment gaps.
References
Bailey, Martha, and Susan Dynarski. 2011. “Inequality in Postsecondary Education.” In Whither Opportunity: Rising Inequality, Schools, and Children’s Life Chances, ed. Greg J. Duncan and Richard J. Murnane, 117–32. New York: Russell Sage Foundation.
Barnett, Steven, Kirsty Brown, and Rima Shore. 2004. “The Universal versus Targeted Debate: Should the United States Have Preschool For All?” Preschool Policy Matters. Issue 6. New Brunswick: National Institute for Early Education Research.
Bartik, Timothy. 2011. Investing in Kids: Early Childhood Programs and Local Economic Development. Kalamazoo: W.E. Upjohn Institute for Employment Research.
Bradley, Robert, Leanne Whiteside, Daniel Mundfrom, Patrick Casey, Bettye Caldwell, and Kathleen Barrett. 1994. “Impact of the Infant Health and Development Program on the Home Environments of Infants Born Prematurely and with Low Birthweight.” Journal of Educational Psychology 86(4):531–41.
Brooks- Gunn, Jeanne, Cecilia McCarton, Patrick Casey, Marie McCormick, et al. 1994. “Early Intervention in Low- Birth- Weight Premature Infants: Results Through Age 5 Years from the Infant Health and Development Program.” Journal of American Medical Association 272(16):1257–62.
Campbell, Frances, Craig Ramey, Elizabeth Pungello, Joseph Sparling, and Shari
Miller- Johnson. 2002. “Early Childhood Education: Young Adult Outcomes from the Abece-darian Project.” Applied Developmental Science 6(1):42–57.
Deming, David. 2009. “Early Childhood Intervention and Life- Cycle Skill Development: Evidence from Head Start.” American Economic Journal: Applied Economics 1(3):111–34. Duncan, Greg, and Katherine Magnuson. 2011. “The Nature and Impact of Early Achievement Skills, Attention Skills, and Behavior Problems.” In Whither Opportunity: Rising Inequality, Schools, and Children’s Life Chances, ed. Greg J. Duncan and Richard J. Murnane, 47–69. New York: Russell Sage Foundation.
Duncan, Greg, and Richard Murnane. 2011. “Introduction.” In Whither Opportunity: Rising In-equality, Schools, and Children’s Life Chances, ed. Greg J. Duncan and Richard J. Murnane, 3–23. New York: Russell Sage Foundation.
Gormley, William, Deborah Phillips, and Ted Gayer. 2008. “Preschool Programs Can Boost School Readiness.” Science 320(5884):1723–24.
Greenstein, Robert. 1991. “Universal and Targeted Approaches to Relieving Poverty: An Alter-native View.” In The Urban Underclass, ed. Christopher Jencks and Paul Peterson, 437–59. Washington, D. C.: Brookings Institution Press.
Gross, Ruth, Donna Spiker, and Christine Haynes, eds. 1997. Helping Low- birth- weight, Pre-mature Babies: The Infant Health and Development Program. Stanford: Stanford University Press.
Heckman, James, Seong Moon, Rodrigo Pinto, Peter Savelyev, and Adam Yavitz. 2010. “The Rate of Return to the High Scope Perry Preschool Program.” Journal of Public Economics 94(1):114–28.
Hill, Carolyn, William Gormley, and Shirley Adelstein. 2012. “Do the Short- Term Effects of a Strong Preschool Program Persist?” Working Paper #18, Center for Research on Children in the U.S. Washington, D. C.: Georgetown University.
Horowitz, Joel, and Charles Manski. 2000. “Nonparametric Analysis of Randomized Experi-ments with Missing Covariate and Outcome Data.” Journal of the American Statistical Association 95(449):77–84.
Jacobson Chernoff, Jodi, Kristin Flanagan, Cameron McPhee, and Jennifer Park. 2007. “Preschool: First Findings from the Third Follow- up of the Early Childhood Longitu-dinal Study, Birth Cohort (ECLS- B).” NCES 2008–025, National Center for Education Statistics. Washington, D. C.: Institute of Education Sciences, U.S. Department of Education.
Jefferis, Barbara, Chris Power, and Clyde Hertzman. 2002. “Birth Weight, Childhood Socioeconomic Environment, and Cognitive Development in the 1958 British Birth Cohort Study.” British Medical Journal 325(7359):1–6.
Karoly, Lynn. 2001. “Investing in the Future: Reducing Poverty Through Human Capital In-vestments.” In Understanding Poverty, ed. Sheldon Danziger and Robert Haveman, 314–46. Cambridge: Harvard University Press.
Kirp, David. 2007. The Sandbox Investment: The Universal Preschool Movement and Kids- First Politics. Cambridge: Harvard University Press.
Klebanov, Pamela, Jeanne Brooks- Gunn, and Marie McCormick. 1994a. “Classroom Behavior of Very Low- birth- weight Elementary School Children.” Pediatrics 94(5):700–8.
Klebanov, Pamela, Jeanne Brooks- Gunn, and Marie McCormick. 1994b. “School Achievement and Failure in Very Low- Birth- Weight Children.” Journal of Developmental and Behavioral Pediatrics 15(4):248–56.
Knudsen, Eric, James Heckman, Judy Cameron, and Jack Shonkoff. 2006. “Economic, Neurobiological, and Behavioral Perspectives on Building America’s Future Workforce.” Proceedings of the National Academy of Sciences 103(27):10155–62.
Ladd, Helen, Clara Muschkin, and Kenneth Dodge. 2012. “From Birth to School: Early Child-hood Initiatives and Third Grade Outcomes in North Carolina.” Working Paper. Durham: Duke University.
Leventhal, Tama, and Jeanne Brooks- Gunn. 2001. “Changing Neighborhoods and Child Well- Being: Understanding How Children May Be Affected in the Coming Century.” Advances in Life Course Research 6:263–301.
Leventhal, Tama, Jeanne Brooks- Gunn, Marie McCormick, and Cecelia McCarton. 2000. “Pat-terns of Service Use in Preschool Children: Correlates, Consequences, and the Role of Early Intervention.” Child Development 71(3):802–19.
Little, Roderick, and Donald Rubin. 1987. Statistical Analysis with Missing Data. New York: Wiley and Sons.
Loeb, Susanna, Margaret Bridges, Daphna Bassok, Bruce Fuller, and Russell Rumberger. 2007. “How Much is Too Much? The Infl uence of Preschool Centers on Children’s Social and Cognitive Development.” Economics of Education Review 26(1):52–66.
Love, John, Ellen Kisker, Christine Ross, Jill Constantine, Kimberly Boller, Rachel Chazan- Cohen, et al. 2005. “The Effectiveness of Early Head Start for 3- Year- Old Children and Their Parents: Lessons for Policy and Programs.” Developmental Psychology 41(6):885–901.
Ludwig, Jens, and Douglas Miller. 2007. “Does Head Start Improve Children’s Life Chances? Evidence From a Regression Discontinuity Design.” Quarterly Journal of Economics 122(1):159–208.
Ludwig, Jens, and Isabel Sawhill. 2007. “Success by Ten: Intervening Early, Often and Effec-tively in the Education of Children.” Discussion Paper 2007–2, Hamilton Project. Washing-ton, D. C.: The Brookings Institution.
Magnuson, Katherine, Marcia Meyers, Christopher Ruhm, and Jane Waldfogel. 2004. “Inequality in Preschool Education and School Readiness.” American Educational Research Journal 41(1):115–57.
Birth- Weight Premature Infants: the Infant Health and Development Program.” Journal of the American Medical Association 277(2):126–32.
McCormick, Marie, Jeanne Brooks- Gunn, Stephen Buka, Julie Goldman, Jennifer Yu, Mikhail Salganik, David Scott, Forrest Bennett, Libby Kay, Judy Bernbaum, et al. 2006. “Early In-tervention in Low- Birth- Weight Premature Infants: Results at 18 Years of Age for the Infant Health and Development Program,” Pediatrics 117(3):771–80.
McDonald, Alison. 1964. “Intelligence in Children of Very Low- Birth- Weight.” British Jour-nal of Preventive & Social Medicine 18(2):59–74.
Puma, Michael, Stephen Bell, Ronna Cook, Camilla Heid, Gary Shapiro, Pam Broene, Frank Jenkins, Philip Fletcher, Liz Quinn, Janet Friedman, Monica Rohacek, Gina Adams, and Elizabeth Spier. 2010. “Head Start Impact Study Technical Report.” Washington, D. C.: U.S. Department of Health and Human Services.
Reardon, Sean. 2011. “The Widening Academic- Achievement Gap between the Rich and the Poor: New Evidence and Possible Explanations.” In Whither Opportunity: Rising Inequality, Schools, and Children’s Life Chances, ed. Greg J. Duncan and Richard J. Murnane, 91–116. New York: Russell Sage Foundation.
Reynolds, Arthur, Judy Temple, Barry White, Suh- Ruu Ou, and Dylan Robertson. 2011. “Age 26 Cost–Benefi t Analysis of the Child Parent Center Early Education Program.” Child Development 82(1):379–404.
Sameroff, Arnold, and Michael Chandler. 1975. “Reproductive risk and the continuum of caretaking casualty.” In Review of Child Development Research, Volume 4, ed. Frances. D. Horowitz. Chicago: University of Chicago Press.
Schweinhart, Lawrence, Jeanne Montie, Zongping Xiang, William Barnett, Clive Belfi eld, and Milagros Nores. 2005. Lifetime Effects: The High / Scope Perry Preschool Study Through Age 40.Ypsilanti: High / Scope Press.
Schorr, Lisbeth. 1989. Within Our Reach: Breaking the Cycle of Disadvantage. New York: Anchor Press.
Skocpol, Theda. 1991. “Targeting Within Universalism.” In The Urban Underclass, ed. Chris-topher Jencks and Paul Peterson, 411–36. Washington, D. C.: Brookings Institution Press. Stanovich, Keith. 1986. “Matthew Effects in Reading: Some Consequences of Individual
Dif-ferences in the Acquisition of Literacy.” Reading Research Quarterly 21(4):360–407. Vogel, Cheri, Kimberly Boller, Yange Xue, Randall Blair, Nikki Aikes, Andrew Burwick,
Yevgeny Shrago, Barbara Carlson, Laura Kalb, Linda Mendenko, Judith Cannon, Sean Har-rington, and Jillian Stein. 2011. “Learning As We Go: A First Snapshot of Early Head Start Programs, Staff, Families, and Children.” OPRE 2011–7, Offi ce of Planning, Research, and Evaluation, Administration for Children and Families. Washington, D. C.: U.S. Department of Health and Human Services.
Wong, Vivian, Thomas Cook, Steven Barnett, and Kwanghee Jung. 2008. “An