FOURTH NATIONAL REPORT
THE CONVENTION ON BIOLOGICAL BIODIVERSITY
MINISTRY OF ENVIRONMENT
2009
GOVERNMENT OF INDONESIA
Keterangan Gambar Sampul:
Flora Fauna Identitas beberapa Provinsi se Indonesia: Elang Jawa, Pinang Merah, Harimau Sumatera, Rafflesia (Bungan Bangkai), Badak Jawa, Sedap Malam, Burung Kepodang, Salak Pondoh, Kepel, Ayam Jago, Anggrek,
Cenderawasih, Bunga Ashar, Bekantan, Duku, Pesut Mahakam, Gajah Sumatera, Bunga Kenanga, Burung Nuri, Bunga Ashar, Komodo, Matoa, Ikan Belida, Anggrek Larat
Cover Picture Description:
Flora Fauna Identity of Several Province in Indonesia: Elang Jawa, Pinang Merah, Harimau Sumatera, Rafflesia (Bungan Bangkai), Badak Jawa, Sedap Malam, Burung Kepodang, Salak Pondoh, Kepel, Ayam Jago, Anggrek, Cenderawasih, Bunga Ashar, Bekantan, Duku, Pesut Mahakam, Gajah Sumatera, Bunga Kenanga, Burung Nuri, Bunga Ashar, Komodo, Matoa, Ikan Belida, Anggrek Larat
FOURTH NATIONAL REPORT
THE CONVENTION ON BIOLOGICAL DIVERSITY
MINISTRY OF ENVIRONMENT INDONESIA
2009
NATIONAL REPORT CBD-4
Published by :
Biodiversity Conservation Unit Ministry of Environment B Building, 4th Floor
Jalan D.I.Panjaitan Kav.24, Jakarta Timur Tepl. +62-21-8517163
Fax. +62-21-85905770 http://bk.menlh.go.id Steering Committee :
Deputy Minister for Nature Conservation Enhancement and Environmental Degradation Control - MoE/NFP CBD Coordinator:
Assistant Deputy for Biodiversity Conservation - MoE Team:
Teguh Triono (Indonesian Institute of Sciences); Bandung Sahari (PEKA INDONESIA); Sudhiani.P (National Planning and Development Agency); Meuthia Naim (MoE); Vidya Sari Nalang (MoE), Rasyidah (MoE), Setyawan Warsono Adi (MoE), Ghofar Ismail (MoE), with support of Lijie Cai (CBD) as a reader of the English version.
Technical Team:
Deddy Darnaedi (Indonesian Institute of Sciences); Yayuk R. Suhardjono (Indonesian Institute of Sciences); Irawati (Indonesian Institute of Sciences); Edi E.Tedjakusuma (National Planning and Development Agency); Ahmad Muniri (Ministry of Justice and Human Rights); Ir. Ahsanal Kasasiah (Ministry of Marine and Fisheries); Widiati H. Adil (Ministry of Agriculture); Indra Exploitasia (Ministry of Forestry); Agus Haryanta (Ministry of Forestry); Andi Russandy (Ministry of Marine and Fisheries); Christian P. Purba (FWI); Yoppy Hidayanto (Burung Indonesia); Anida Haryatmo (KEHATI Foundation); Enny Sudarmonowati (FFI); Irwansyah Reza Lubis (Wetlands International-IP); M. Imran Amin (TNC); Harry Alexander (WCS); M. Farid (CI); Retno Setyaningrum (WWF).
Financial Support:
Table of Content
Page List of Content i List of Table iv List of Figure v Acronym vi Executive Summary ix Chapter IStatus and Trend of, and MajorThreats to Biodiversity 1
1.1. Introduction 1
1.2. General Overview 1
1.2.1 Indonesian Mega Biodiversity 2
1.2.2. Threats to Indonesian Biodiversity 6
1.2.2.1. Rapid Population Growth 6
1.2.2.2. Deforestation 6
1.2.2.3. Forest and Land Fires 7
1.2.2.4. Degradation and fragmentation of habitats 8
1.2.2.5. Consumption/Over Exploitation 8
1.2.2.6. Invasive Alien Species 8
1.2.2.7. Pollution 9
1.2.2.8. Climate Change 9
1.3. Status and Trends of, and Threat to Biodiversity 10
1.3.1. Status and Trends of, and Threat to Terrestrial Biodiversity 10
a. Forest 10
b. Karst Region 17
c. Biodiversity of Small Islands 18
1.3.2. Status, Trends, Threats and Conservation of Wetland Biodiversity 19
1.3.2.1. The Salt Water Biodiversity (Coastal and Marine) 20
a. Mangrove 20 b. Coral Reefs 21 c. Seagrass 23 1.3.2.2. Freshwater Biodiversity 24 a. Swamp 24 b. Lake 27 c. River 27
1.4. Implications of Biodiversity Loss 30
1.4.1. Economic Implications 30
1.4.2. Social Implications 31
Chapter II
Status of National Biodiversity Startegies and Action Plans
33
2.1. National Biodiversity Strategies and Action Plans 33
2.2. Indication of Targets and Indicators Under the Convention Adopted into IBSAP 34
2.3. Contribution of Activities under the IBSAP to the Implementation of the Convention of CBD 34
2.4. An overview of progress made in the implementation of IBSAP 36
2.4.1. Evaluation of the fulfillment of precondition for the effective implementation of IBSAP 36
2.4.2. Progress made in the implementation of IBSAP and obstacles encountered. 36
2.4.3. Obstacles Encountered in the Implementation of IBSAP 39
2.5. An indication of domestic and/or international funding dedicated to program implementation 40 2.6. Analysis of the Effectiveness of National Biodiversity Strategies and Action Plans. 41
2.7. Lesson learned and recomendations 41
2.8. The Specific information related to COP 8 Decisions 41
2.8.1. VIII/5 Article 8(j) 41
2.8.2. VIII/21 (Marine and coastal – deep seabed) 41
2.8.3. VIII/22 (Marine and coastal – IMCAM) 42
2.8.4. VIII/28 (Impact Assessment) 43
Chapter III
Sectoral and Cross-Sectoral Integration or Mainstreaming of Biodiversity Considerations
44
3.1. Players in biodiversity management in Indonesia 44
3.2. The process of integrating biodiversity considerations into sectors 45
3.2. 1. National Development System in Indonesia 45
3.2.2. Integration of biodiversity considerations into the national development plan 45 3.2.3. Mainstreaming of biodiversity considerations into sectoral strategic planning 46 3.2.4. Mainstreaming of biodiversity considerations into local government coordination 50 3.2.5. The integration of biodiversity consideration into national strategies and programs 51
3.2.5.1. Millenium Development Goals (MDGs) 51
3.2.5.2. PNPM Mandiri (National Program on Community Empowerment) 52
3.2.5.3. United Nation Framework Convention on Climate Change (UNFCCC) 52
3.2.5.4. Indonesia National Strategies and Action Plan on Wetland Management 2004 53
3.2.5.5. Environmental Impact Assessment (AMDAL) 53
3.2.5.6. Strategic Environmental Assessment (SEA) 53
3.2.5.7. Incentive Program 54
Chapter IV
Progress Towards the 2010 Target and Implementation of the Strategic Plan
56
4.1. Progress towads the 210 Target 56
4.1.1. Initial Study on achievement of each target in the 2010 Target 62
4.1.2. Obstacles in achieving the 2010 target 64
4.2. Implementation of Strategic Plan 65
4.3. Conclusion 66
REFERENCES 68
APPENDIX I
Preparation Process of the forth National Report to CBD
72
APPENDIX III.1
Progress Towards Achievement of Target Global Strategy For Plant Conservation
75
APPENDIX III.2
Progress Towards Achievement of Target Protected Area
77
APPENDIX TABLE 2.1.
Relationship among Global, National with IBSAP and Sector Strategic Plan
87
APPENDIX TABLE 2.2.
Relationship between activities under IBSAP and articles of the Convention under UNCBD
104
APPENDIX TABLE 4.1.
Objectives and Targets of Strategic Plan and Its Indicators to measures its Progress
List of Table
Page Table 1.1. Numbers of accession of genetic resource collections at Agricultural Research and
Development Institute
2
Table1.2. Numbers of species of vascular plants (Angiosperms, Gymnosperms and Pterydophytes) and their distributions
3
Table 1.3. The size of burnt area (in hectares) of reported forest fire in several provinces between 2004-2008
12
Table 1.4. Change of Status of bird species in Indonesia 13
Table 1.5. Species of Wild Plants and Animals Breed in Captivity in Indonesia (up to 2008) 15
Table 1.6. Trend of breeding activities until 2008 16
Table 1.7. Existing and planned Botanic gardens in several provinces in Indonesia until 2010 16
Table 1.8. List of Small Islands in the Sea of Indonesian Border Regions 19
Table 1.9. Area and Conditions in of Particular Mangrove Regions in Several Provinces in 2006 20
Table 1.10. Marine Conservation Area 23
Table 1.11. Coverage of Coral Reef, Mangrove and Sea grass in Indonesia, 2008 24
Table 1.12. Data of Swamp in several Islands in Indonesia in 2007 25
Table 1.13. Total Wetland Area in Indonesia 26
Table 1.14a. Classification and Number of River Region in Indonesia 27
Table 1.14b. Number of Watershed in River Region Indonesia 28
Table 1.15. Export of Forest Product Period January - March 2008 31
Table 2.1 Relationship among activities under the IBSAP and Thematic Programmes dan Cross-cutting Issues under UNCBD
35
Table 2.2 Funding Sources for the implementation of IBSAP 40
Table 3.1. Integration of biodiversity considerations into The Ministry of Forestry’s activities. 48
Table 3.2. Coordination matrix of biodiversity 54
Table 4.1. Target 2010 Biodiversity 56
List of Figure
Page Figure 1.1. Number of bird species and its distribution in large islands and their surroundings in Indonesia
(adopted from “the National Taxonomy Assessment Report for Indonesia” by Research Centre for Biology, LIPI 2008, in press)
4
Figure 1.2. One of Small Island in Indonesia 5
Figure 1.3. The population number in Indonesia 1971-2025 (adopted from Bappenas 2007) 6
Figure 1.4. Deforestation rate of forest in Indonesia (adopted from Bappenas 2007) 7
Figure 1.5. Numbers of hot spot in several areas in Indonesia during the period of 2004-2008 (adopted from Ministry of Forestry/FORDA 2007)
7
Figure 1.6. Map of forest vegetation cover in Indonesia in 2006/2007 10
Figure 1.7. The emission of CO2 (ton million) due to forest fire in Indonesia (compiled from Heil et al. 2007)
11
Figure 1.8. Relationship between Width of Conservation Area and The Number of Conservation Management Unit Formed
15
Figure. 1.9. Photograph of Karst Area in Gunung Kidul, Yogyakarta (LIPI, KLH) 17
Figure 1.10. Planting area for Mangrove Forest Rehabilitation Year 2002-2006 (adopted from SLHI 2007) 21
Figure 1.11. Mangrove in East Lombok, West Nusa Tenggara(MoE, PIKA-MoF) 21
Figure 1.12. Coral Reefs area in Indonesia Based on Remote Sensing Data (adapted from SLHI 2006) 22 Figure 1.13. Indonesia Coral Reefs Condition in the period 2004-2007 (adopted from SLHI 2007) 22
Figure 1.14a. KRS Value of several rivers in Indonesia in 2005 28
Figure 1.14b. KRS Value of several rivers in Indonesia in 2005 29
Figure 1.15. Volume of water (in million m3) some rivers in Indonesia in 2005 29
ACRONYM
APBD : Regional Budget
APBN : National Budget
ASEAN : The Association of Southeast Asian Nations BAPI : Biodiversity Action Plan for Indonesia BAPPEDA : Regional Development Planning Agency BAPPENAS : National Planning and Development Agency
BEHF : Biodiversity, Ecology, and Health Fund
BKPM : Indonesia Investment Coordinating Board
BPPT : The Agency For the Assessment and Application Technology BPS : Indonesia Central Bureau of Statistics
BSSE : Bismarck Solomon Seas Ecoregion
CEPI : Collaborative Environmental Project in Indonesia
CI : Conservation International
CIDA : Canadian International Development Agency
COP : Conference of The Parties
CORDAID : Catholic Organisation for Relief and Development AID COREMAP : Coral Reef Rehabilitation and Management Project
CTI : Coral Triangle Initiative
DANIDA : Danish International Development Agency DEPDAGRI : Ministry of Home Affairs
DEPDIKNAS : Ministry of National Education
DEPHUT : Ministry of Forestry
DEPKEH : Ministry of Justice and Human Rights
DEPKEU : Ministry of Finance
DEPTAN : Ministry of Agriculture
DFID : Department for International Development
DGIS : The Directorate General for International Cooperation (DGIS) of the Netherlands Ministry of Foreign Affairs.
DIPA : Budget Project Implementation
DISHIDROS : Indonesian Navy Hydrological Division
DKP : Ministry of Marine and Fisheries
ENSO : El Nino-Southern Oscillation
ESDM : Ministry of Energy and Mineral Resources
EU : Europion Union
FSC : Forest Stewardship Council
GAP : Good Agricultural Practices
GEF-SGP : Global Environment Facility-Small Grant Programme GERHAN : Forest and Land Rehabilitation Movement
HPH : Forest Management Right
HTI : Estate Forest
IAS : Invasive Aliens Spesies
IBA : Important Bird Area
IBSAP : Indonesian Biodiversity Strategy and Action Plan ICZN : International Code for Zoological Nomenclature IMCAM : Integrated Marine and Coastal Area Management
IPCC : International Panel on Climate Change
ITPGRFA : International Treaty on Plant Genetic Resources Food and Agricultural IUCN : International Union for the Conservation of Nature
KBA : Key Biodiversity Area
KKLD : Local Marine Protected Area
KKMP : Maros Karst Regions Pangkep
KNLH : State Ministry of the Environment
KPA : Natural Preservation Area
KPHL : Kesatuan Pemangku Hutan Lindung
KSA : Conservation Area
KSDA : Natural Resources Conservation
LEISA : Low External Input Sustainable Agricultural LIPI : Indonesian Institute of Sciences
LULUCF : Land Use, Land Use Change and Forest
MAB : Man and Biosfer
MCRMP : Marine And Coastal Resources Management Project
MDGs : Millennium Development Goals
MENRISTEK : State Ministry of Research and Technology
MSP : Medium Size Project
MTA : Mutually Terms Agreement
NFP : National Focal Point
NSAP : National Strategic Action Plan for Wet Land
NSDH : National Forest Resources Balance
Pemda : Local Goverment
PNPM : National Program on Community Empowerment
PP : Government Regulation
PU : Ministry of Public Works
PVT : Plant Variety Protection
RANPI : National Strategic Action Plan for Climate Change
REDD : Reduction Emission From Deforestation and Forest Degradation
RKP : Government Work Planning
RMI : Rimbawan Muda Indonesia (local NGOs name)
RPJMN : National Mid Term Development Planning
RLPS : Directorate General for Land Rehabilitation and Social Forestry
RTRW : Regional Spatial Planning
RTRWP : Provincial Regional Spatial Plan (Rencana Tata Ruang Wilayah Provinsi)
RUU : Drafting Act
SCBD : Secretariat Convention on Biological Diversity
SDA : Natural Resources
SDG : Genetic Resources
SEA : Strategic Environmental Assessment
SFM : Sustainable Forest Management
SGI-UC Berkeley : Small Grants Initiative University of California at Berkeley
SGP : Small Grant Project
SGP-PTF : Small Grants Programme for Operations to Protect Tropical Forests
SLHI : Environmental State of Indonesia
SLPHT : Field School of Integrated Pest Control SLPTT : Field School of Integrated Crop Management
SM : Wildlife Sanctuary
SNPEM : National Strategy on Management of Mangrove Ecosystems
SSME : Sulu-Sulawesi Marine Ecoregion.
Tahura : Great forest park
TF : Task Force
TGHK : Forest Landuse Plan (Tata Guna Hutan Kesepakatan) (determine by concencus) TFGTI : Task Force Global Taxanomi Initiative
TN : National Park
TNC : The Nature Conservancy
UN : United Nation
UNDP : United Nations Development Programme
UNEP : United Nations Environment Programme
UNESCO : United Nations Educational, Scientific, and Cultural Organization UNCBD : United Nation Convention on Biological Diversity
UNFCC : United Nation Framework Convention on Climate Change
UPT : Technical Management Unit
USAID : United States Agency for International Development
WCS : Wildlife Conservation Society
WCU : Wildlife Crime Unit
WHC : World Heritage Convention
WI : Wetland International
WWF : World Wide Fund for Nature
YIF-WB : Youth Innocation Fund-World Bank
Executive Summary
The Fourth National Report to CBD is a report on the implementation of articles and programmes of work of the Convention on Biological Biodiversity (CBD) at the national level. The report was prepared following the guidelines provided by the Secretariat of the CBD (SCBD). This report consists
of four chapters.
Chapter I is a review of status and trends of, and major threats to biodiversity. This chapter provides an analysis of the conditions of biodiversity in Indonesia at the levels of species, genetic and ecosystem diversity. In the case of species diversity, the number of floral species known in Indonesia is ranked among the big five of diversity-rich countries in the world. Of the entire concerned species, 55% of floras found in Indonesia are endemic. For the diversity of fauna, about 12% of mammals (515 species) in the world are found in Indonesia.
At the ecosystem level, conservation is carried out through the establishment of conservation areas which serve as places for protection and preservation of biodiversity, such as biosphere reserves, wildlife sanctuaries, national parks, ecotourism parks, forest parks and hunting parks. Coverage of these areas was increased to 27.968 million ha in 2007, compared to 7.628 million ha in 1981.
In the efforts of ex-situ conservation, there was an increase in the number of floras and faunas being bred in captivity from 171 species in 2006 to 416 species in 2008. Of those captive breeding activities in the year of 2008, 383 of them were for protected floras and faunas.
Some threats to biodiversity in Indonesia include: high population growth rate, deforestation, forest and land fires, habitat degradation and fragmentation, consumption/over-exploitation, pollution, and climate change.
Status of Indonesian Biodiversity Strategy and Action Plan (IBSAP) is described in Chapter II. Given that the targets, goals, and indicators included in IBSAP 2003-2020 had been prepared before the 2010 target framework was adopted at COP 7 (decision VII/30) in 2004, so the content in IBSAP did not entirely refer to the 2010 target framework. However, some indicators in the IBSAP are consistent with some global indicators such as those prepared by SCBD and the Strategic Plan of the Convention. Some IBSAP programs have been associated with the articles of the Convention on Biological Diversity (UNCBD) and contributed to the implementation of the thematic programs of work and cross-cutting issues of CBD.
Chapter III provides information on mainstreaming of biodiversity into sectoral and cross-sectoral plans, programs and policies. Indonesia has adopted the 2003-2020 Indonesian Biodiversity Strategy and Action Plan (IBSAP) which is a revised version of the 2003 Biodiversity Action Plan for Indonesia (BAPI). Mainstreaming of Biodiversity has been carried out through integration into the Indonesia
National Long-term Development Planning/RPJPN (2005-2025). The mission of RPJPN has taken into consideration the sustainable use of biodiversity.
Mainstreaming of biodiversity considerations has been started especially by those sectors that have direct relevance with management of natural resources and biodiversity, including through the 2005-2009 Sectoral Strategic Plans of the Ministry of Marine and Fisheries, the Ministry of Forestry, Agency for Agriculture Research and Development under the Ministry of Agriculture, and Research Center for Biology- Indonesian Institute of Sciences.
Biodiversity considerations have also been integrated into the administration of local governments, by establishing a conservation agency. To date, the Conservation Districts have been established including for District of Kapuas Hulu, District of Malinau, District of Kuningan, and District of Pasir. Biodiversity has also been integrated into some broader national strategies and programs, such as strategies for achieving the MDGs, PNPM Mandiri (National Program on Community Empowerment), Action Plan for implementing UNFCCC, and the 2004 Indonesian Strategy and Action Plan for Wetland Management. Biodiversity is also incorporated into environmental impact assessment, strategic environmental assessment, and relevant incentives.
Chapter IV reviews on progress towards the 2010 Target and implementation of the Strategic Plan of the Convention. Data availability is a key factor for determining indicators in achieving the 2010 target. In 2008, Indonesia just carried out data and information collection that can be used to assess the 2010 target achievement by using indicators that have been agreed. Data and information collected were those from the period 2003-2008 and it was considered as the preliminary data that need to be updated in the years to come.
For these reasons, results of the assessment of the achievement of the 2010 target described only efforts made to achieve these targets. Some targets were set at the national level for achieving the 2010 target, but no targets specifically referred to the 2010 target framework. An achievable national target is to increase marine conservation area from 4.7 million ha in 2003 to 10 million ha in 2010 and then be expanded to 20 million ha in 2020.
National targets for achieving the Strategic Plan of the Convention have not yet been determined, albeit there were fourteen national programs already implemented which can support the achievement of these targets.
The Fourth National Report also identifies some obstacles in the implementation of the Convention, including lack of stakeholders’ support to implement the Convention of Biological Diversity; lack of communication and coordination among stakeholders (particularly at local levels), lack of mechanisms to ensure that sectoral programs and action plans can contribute to the implementation of the Convention; lack of stakeholders’ awareness in the implementation of Convention on Biological Diversity; and
inadequate efforts to monitor and to integrate data and information that can be used for policy making in the implementation of the Convention.
Knowing of those constraints is a necessary step to improve capacities, among others by : establishing a mechanism to ensure that sectoral programs and action plans are in line with the implementation of the Convention; raising awareness and improving knowledge of stakeholders about the Convention and its programmes of work; mainstreaming the Convention and its programmes of work from national level to local levels (Provincial and Regencies/Cities); strengthening regional cooperation mechanisms as well as training and exchange of experience among the Parties of the Convention.
Chapter I
Status and Trends of, and Major Threats to Biodiversity
1.1. Introduction
In this Chapter I of the 4th National Report on the Convention of Biological Diversity, we provide a review on the status, trend, and threat of biodiversity in Indonesia. This chapter was prepared not only to give a brief overview of the state-of-the-art conditions of biodiversity, but also to provide important information concerning the status and trends of biodiversity in Indonesia.
The source of data used to review the status, trend, and threat of biodiversity was obtained from the stakeholders involved in the implementation of the Convention on Biological Diversity in Indonesia. Data collection from the stakeholders followed the Indonesian Biodiversity Strategy and Action Plan – IBSAP 2003-2020. The indicator of its condition presented in Chapter IV of this 4th National Report. In order to obtain the latest data of the status and trend of, and threats to biodiversity in Indonesia, the data provided in Chapter I were tabulated from available data and information between 2003-2008. The availability of main data and supportive data, especially serial data and quantitative data of biodiversity components as well as its fluctuation became the limiting factor for preparing this Chapter .
In order to easily comprehend the current condition, and to give detailed and logical view of the trend and the threats of biodiversity in Indonesia with the limited data, Chapter I is structured as follow:
• The first part of Chapter I (Sub-chapter 1.2) describes a general overview of the Indonesian mega biodiversity, which comprises diversity at genetic, species and ecosystem levels. This Chapter also contains information about the types of threats to biodiversity in Indonesia.
• The second part of Chapter I (Sub-chapter 1.3) describes the status, threat biodiversity based on the main types of ecosystems in Indonesia. Sub-chapter 1.3 is divided into two large groups, i.e. status, threat and conservation on terrestrial biodiversity (comprising forest, small islands and karts); and status, threat and conservation of aquatic biodiversity , which includes salty water (coast, ocean and mangrove) and freshwater (swamp, river and lake).
• The third part of Chapter I (Sub-chapter 1.4) describes the implications of biodiversity loss at ecosystem, species and genetic levels in terms of socio-economic potential impacts as well as brief view on its changes.
1.2. General Overview
Biological diversity refers to the entire form of life diversity on earth, which consists of three levels, i.e. ecosystem, species and genetic diversity (IBSAP 2003; National Planning and Development Agency - Bappenas 2007; Campbell & Reece 2007), including interactions amongst them, and interactions with their environments (IBSAP 2003). The distribution of biodiversity on the earth is not even. Tropical regions possess higher diversity than any other regions on earth (Campbell and Reece 2007).
The Indonesian Archipelago, which is located between two continents (Asia and Australia) and two oceans (Pacific and Indian), possesses a very rich and unique biodiversity with its complex interactions as a result of the upheaval of Asian and Australian plates (Metcalfe et al. 2001). Based on the distribution of the world biodiversity, Indonesia is often called mega biodiversity region, i.e. one with the highest biodiversity in the world. Therefore, efforts to conserve biodiversity in Indonesia are very important since many places are centres of origin, centres of diversity and centres of endemism (IBSAP 2003).
1.2.1. Indonesian Mega Biodiversity
Biodiversity comprises all forms of life on the earth, from very simple organisms such as bacteria and fungi to human beings; from a tree in backyard to a thousand of trees that form a complex web of life in the forest (IBSAP 2003; Bappenas 2007; State of Environmental Report of Indonesia - SoER Indonesia 2007; Campbell & Reece 2007).
With 1,860,359.67 km2 of terrestrial area (Ministry of Home Affairs,2005 in Ministry of Marine Affair and Fisheries - MMAF 2006) and of 5.8 million water area km2 (Indonesian Navy Hydrological Division - Dishidros TNI AL 1987 in DKP 2006) and of 81,000 km coastal line (Dishidros TNI AL 1987 in MMAF 2006), Indonesia is placed in the second rank after Brazil in terms of high biodiversity level (Ministry of Forestry - MoF 1994; Mittermeieret al. 1997 in SoER Indonesia 2007).
In terms of genetic diversity, Indonesia is one of the countries that are rich in genetic resources, including its endemism level. Those genetic resources have a vital role in national development, through producing new varieties with high quality, as well as supporting system of life, such as food resources, building materials, and industrial materials. The use of Indonesian genetic resources for human prosperity goes along with sustainable use of biodiversity and its uniqueness (SoER Indonesia 2007).
Table 1.1. Number of Accessions of Genetic Resource Collections at Agricultural Research and Development Institute No Commodity Number of Collections Studied 1 Crops 5529 3337 2 Fruits 592 95 3 Vegetables 4438 1846 4 Estate Plants 2168 338 5 Cultivated Plants 10404 1273 6 Chicken 309 - 7 Fish 1660 - 8 Microbes 2670 - T O T A L 27770 6889
Source: National Commission on Germplasm in SoER Indonesia 2007
In terms of species diversity, Indonesia is among the top five in the world. Of these species, 55% are endemic plants (Newman 1999 in SoER Indonesia 2007). Based on the results of a taxonomic assessment in 2007, which was carried out by Research Centre for Biology, the Indonesian Institute of
Sciences (LIPI), 31,746 species of vascular plants have been recorded and described. These figures were tabulated from data of herbarium specimens from various renowned flora databases worldwide such as GBIF, Species 2000 and ITIS, herbaria such as Royal Botanic Gardens Kew, National Herbarium of the Netherlands and Herbarium Bogoriense, Indonesia as well as data from non-governmental organizations such as Conservation International (CI) etc. The combined data were sorted out to prevent duplications of species name and then were validated based on monographs and taxonomic publications in accordance with the rules of the International Code for Botanical Nomenclature (ICBN). Data of specific diversity of vascular plants (Angiosperms, Gymnosperms and Pterydophytes) and their distributions in Indonesia are shown in Table 2.2.
Table 1.2. Numbers of species of vascular plants (Angiosperms, Gymnosperms and Pterydophytes) and their distributions
Islands Number of Species
Sumatera 8538 Kalimantan 5524 Java 4364 Sulawesi 5076 Moluccas 4128 Papua 3311
Lesser Sunda Islands 805
Total species 31746
Source: adapted from “National Taxonomy Assessment Report for Indonesia” by Research Centre for Biology, LIPI 2008, in press)
For fauna diversity, about 12% of mammals (515 species) of the world occur in Indonesia. This placed Indonesia in the second rank after Brazil. About 16% of world reptiles (781 species) and 35 species of primate placed Indonesia in the fourth rank in the world. Furthermore, 17% of the total species of birds (1592 species) and 270 species of amphibians placed Indonesia in the fifth and sixth rank, respectively in the world (Mittermier et al. 1997 in SoER Indonesia 2007).
The latest data of the taxonomic assessment of Indonesia 2007 showed that bird diversity of Indonesia is 1595 species (see Figure 1.1). From this assessment, the highest bird diversity occurred in Papua with more than 650 species. The bird species richness in Sumatera was placed in the second rank after Papua, with about 600 species. The increase of the species number was also found in amphibians that reached 363 species (243 species are endemic) (Research Centre for Biology, LIPI 2008 in press). As for the flora diversity data, these numbers were also tabulated from museum specimen’s data from various renowned fauna databases such as GBIF, Species 2000, Fishbase, P2 Biology (Research Centre for Biology, LIPI), non-government organizations such as Birdlife International, World Wildlife Fund, Conservation International, etc. Total data have been tabulated and the species names have been validated based on monographs and taxonomic revisions in accordance with the rules of the International Code for Zoological Nomenclature (ICZN). Similar to the number of floral species, this number of fauna species will change following the ongoing surveys and inventories, which are conducted by various organizations and institutions in Indonesia.
Birds of Indonesia 0 100 200 300 400 500 600 700 800
Sumatra Kalimantan Java Sulawesi Moluccas Lesser Sunda Island (Non Timor)
Papua
Island
Figure 1.1. Number of bird species and its distribution in large islands and their surroundings in Indonesia
Source: (adapted from “the National Taxonomy Assessment Report for Indonesia” by Research Centre for Biology, LIPI 2008, in press)
Indonesia is not only rich in genetic and species diversity, but it is also rich in ecosystem diversity, which includes natural diversity of the terrestrial landscape as well as water, in which organisms (plants, animals and micro organisms) interact with their physical environment (IBSAP 2003; Campbell & Reece 2007). The definition of ecosystem diversity is highlighted in SoER Indonesia (2007), which stated that ecosystem diversity refers to habitat type diversity, which depicts the diversity of life forms, performed roles and ecological processes, and the genetic diversity.
As a country of archipelago between the distribution lines of Asia and Australia continents, and distribution area of transitional Wallacea, the terrestrial ecosystems of Indonesia have distinctive biodiversity of Asian, Australian region as well as transitional region (SoER Indonesia 2007). The geological history of the formation of each island in Indonesia caused variations that affect the formation of ecosystems and species of plants and animals that live in them, including the formation of endemic species in Indonesia.
In the IBSAP (2003), it was mentioned that based on the geological history, the diversity of terrestrial ecosystems in Indonesia encompasses snow and tundra in the mountain peaks of Papua, tropical rainforest in Sumatera and Kalimantan, and savanna and shrubs in Nusa Tenggara. These categories are based on the vegetation type, which is influenced by the rainfall and temperature (Whittaker 1970). The tropical climate that is relatively stable throughout the year creates the forests in Indonesia as the main terrestrial ecosystem, which has the richest biodiversity. This forest area mentioned here is a certain region of permanent forest of which has been designated and/or declared by the government through a ministerial decree from the Forestry Minister as Provincial Forest and Water Area based on the result of compatibility between Provincial Regional Spatial Plan (RTRWP) and Forest Landuse Plan (TGHK) (determine by concencus). The size of forests in Indonesia designated as Provincial Forest and Water Area and TGHK until 2005 is 120.35 million hectares which comprises: a) 20.50 million hectares of Conservation Forest, b) 33.52 million hectares of Preserved Forest, c) 23.06 million hectares of Limited Production Forest, d) 35.19 million hectares of Fixed Production Forest and e) 8.08 million hectares of Conversable Production Forest.
These large sizes of the forests provide habitats for plants, animals and micro organisms, which are the bases of most of terrestrial species. Riswan and Yamada (2006) classify forest ecosystems in Indonesia into two main groups, one group being tropical rain forest (which include dry land forest like lowland rain forest, mountain rain forest and conifer forest and wetland forest) and the other group being monsoonal tropical forest (savanna and grassland).
Besides forest ecosystem, karts area is also one of the terrestrial ecosystems found in Java, Kalimantan and Sulawesi Islands. In the Management Action Plan for Karts Ecosystem Gunung Sewu (2008), it is mentioned that karts ecosystem encompasses all abiotic, biotic, and cultural components that present in kart landscape. Karts landscape comprises limestone, dolomite, marble, salt stone and gypsum area, which were formed through the process of karstification. The process of karstification was characterized by underground drainage web and cave system as well as the formation of exo-karst on the soil surface (e.g. conical-shaped or tower-shaped hills, blind valley and holes where the surface stream goes into the underground river web).
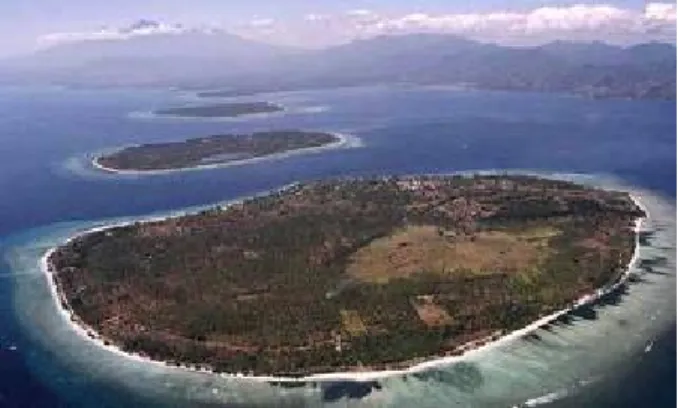
Other terrestrial ecosystems that become a characteristic of the Indonesian Archipelago are small islands, which are insulated, connected land (separated from the main land or main-island (Bengen 2001; MMAF 2001). In the Government Regulation No. 27, 2007, a small island is defined as an island with the size of equal or less than 2,000 km2 together with its ecosystem. The prominent physical and biological characteristics include limitedness of fresh water supply because the water catchment area is relatively small, vulnerable and fragile from external influence, which happen either naturally or as the result of human activities. In several cases, it has high endemism of flora and fauna.
Figure 1.2. One of Small Islands in Indonesia.
Source: www.lomboktravel.com
In terms of water ecosystem diversity in Indonesia, several types of ecosystem have been identified based on salinity level. According to Smith and Smith (2003), the clustering of water ecosystems is based on physical characteristics such as substrate, temperature, water depth, and dominant vegetation. There are three important ecosystems of coastal area and ocean, which are categorized as saline water, i.e. mangrove ecosystem (Kartawinata 2005), coral reef ecosystem such as beautiful coral reef view in Bunaken and Raja Ampat, and sea grass ecosystem such as in Sunda Strait (IBSAP 2003; Bappenas
2004). Whereas lakes, rivers, and swamps are part of fresh water ecosystem (IBSAP 2003; Marshall 2007, in Marshall and Beehler 2007). Based on the climate condition and composition of vegetation, swamp vegetation in Indonesia is classified into three types, i.e. fresh water swamp vegetation, peat swamp vegetation, and monsoonal swamp vegetation (Kartawinata 2005).
1.2.2. Threats to Indonesian Biodiversity
The loss of biodiversity is a natural process, but the extinction rate is often accelerated by human over exploitation. The main threats that cause the loss of biodiversity in Indonesia are mostly caused by rapid population growth, deforestation and forest fires, habitat fragmentation, over exploitation (including illegal poaching and illegal trade of fauna and flora), introduction of alien species, pollution and climate change (IBSAP 2003; SoER Indonesia 2007; Bappenas 2007; National Action Plan for Climate Change Indonesia - RANPI, 2007).
1.2.2.1. Rapid Population Growth
In 2005, the population of Indonesia is 218.9 million (Figure 1.3), which placed Indonesia in the fourth most populous country in the world (Bappenas 2007). In the report of Analysis of Natural Resources and Environment (2007) by Bappenas, it was mentioned that in 2025, the population of Indonesia is projected to be increased to 273.2 million (see Figure 1.3).
Figure 1.3. The population growth in Indonesia 1971-2025 (adapted from Bappenas 2007).
Source: Population Census in 1971, 1980, 1990, 2000 and SUPAS 1995, 2005 – BPS, BPS – Statistics indonesia, Bappenas, UNFPA Indonesia (2005) in Bappenas (2007).
The large number of population will increase use of biodiversity, and more forest and farm areas (including paddy field) will be converted into residential areas.
1.2.2.2. Deforestation
Deforestation is defined as a change in forest cover of a certain region from forest area into non-forest or into the area that is used for non-forest sectors (plantation, agriculture, residential/transmigration area) due to the forest mismanagement and forest fires. The latest data about deforestation rate from the Ministry of Forestry reported by Bappenas (2007) and SoER Indonesia (2007) stated that deforestation rate in Indonesia in 2000-2005 is 1.08 million hectares (Figure 1.4.).
Figure 1.4. Deforestation rate of forest in Indonesia (adapted from Bappenas 2007).
Source: Bappenas 2007
1.2.2.3. Forest and Land Fires
The forest fires in Indonesia were caused by several linked factors related to human and nature, for example logging, land clearance, infrastructure development and nomad-farm practice, which gave a wide access to the forests. This, in fact, will increase human activities inside the forest (Schweithelm & Glover 2002 in Bappenas 2007). Natural phenomenon such as El Nino that caused extreme aridity also increased the intensity and extent of forest fires in Indonesia (Bappenas 2007).
According to the number of hot spots identified by satellite imagery during the period of 2004-2008, several areas, such as Riau, South Sumatera, East Kalimantan, West Kalimantan and Central Kalimantan, have a higher potential hazard and risk of fires compared to other areas in Indonesia (see Figure 1.5.).
-5,000.00 10,000.00 15,000.00 20,000.00 25,000.00 30,000.00 35,000.00 40,000.00 45,000.00 N a n g ro A c e h D a ru s a la m S u m a te ra U ta ra S u m a te ra B a ra t R ia u K e p R ia u J a m b i S u m a te ra S e la ta n B a n g k a B e lit u n g B e n g k u lu L a m p u n g B a n te n D K I J a k a rt a J a w a B a ra t D I Y o g y a k a rt a J a w a T e n g a h J a w a T im u r B a li N u s a T e n g g a ra B a ra t N u s a T e n g g a ra T im u r K a lim a n ta n B a ra t K a lim a n ta n T e n g a h K a lim a n ta n S e la ta n K a lim a n ta n T im u r G o ro n ta lo S u la w e s i U ta ra S u la w e s i T e n g a h S u la w e s i B a ra t S u la w e s i S e la ta n S u la w e s i T e n g g a ra M a lu k u M a lu k u U ta ra P a p u a 2004 2005 2006 2007 2008
Figure 1.5. Numbers of hot spot in several areas in Indonesia during the period of 2004-2008 (adapted from MoF 2007).
Source: MoF 2007
Forest fires caused flames and heat effects which caused direct damage and the death of flora and fauna in the forest; and indirect damage such as loss of habitats and food of wildlife which at the end lead to the death of wildlife, the loss of human income and food sources from the forest, defector loss of
hydrological functions and nutrition cycles, smoke that disturb human activities, and change of species composition and change of ecological processes which at the end lead to the permanent loss and change of species composition and plant structures (Bappenas 2007).
1.2.2.4. Degradation and fragmentation of habitats
Lowland forest areas are the places where the highest biodiversity occur. These areas are also places to obtain and meet the human needs, such as developing cultivation areas for agriculture including plantations as well as the development of residential areas (Bappenas 2007; SoER Indonesia 2007). Therefore, functional changes of lowland areas happen very fast. The change of status and/or functions of land become one of the major causes of forest degradation in Indonesia as forest ability to regenerate is slower than the rate of forest damage caused due to over exploitation, which surpass its support capacity (Bappenas 2007; SoER Indonesia 2007). Forest fires also accelerate the forest damage.
Besides forest degradation, this conversion also leads to the decreasing of natural habitats for various rare plants and wild animals, or causing the fragmentation of the areas into much smaller areas, so the habitat isolation is finally formed. Campbell & Reece (2007) mentioned that habitat fragmentation will reduce the size of population and divide the widely distributed population into sub-population that are distributed in limited areas, so that they will be vulnerable to human pressure, genetic breeding, and lead to the loss of species especially of the small population due to the presence of barriers for distribution, colonization, and species exploration. Moreover, habitat fragmentation will push conflicts between human beings and wild life (SoER Indonesia 2007).
1.2.2.5. Consumption/Over Exploitation
Human activities and consumption will affect the condition of biodiversity especially on species that have important roles in the economy since they have strategic values for food resources, medicines, clothing and housing. Human activities, such as converting forest to agriculture, gathering food, industrial activities, over logging and poaching that surpass the limit of species supporting capacity, and illegal trade on various plants and wild animal species, and over use of wild plants for medicinal purposes without rehabilitation, will reduce the level of biodiversity in a particular area.
In addition, mono-cultural cultivation practices, i.e. to plant only a single or two species or varieties (e.g. teak plantation or rice field that were cultivated by only one variety of rice), will threaten the existence of biodiversity itself. Besides mono-culture cultivation practices, the excessive catch of any potential fish and sea biota will threaten the conservation of the species as well as the marine ecosystem in small as well as global scale (SoER Indonesia 2007).
1.2.2.6. Invasive Alien Species
One of the real global threats to biodiversity is invasive species. The introduction, distribution and uses of alien species, intentional or unintentional, have caused ecological losses and considerable economical losses (Frazier 2007 in Marshall & Beehler 2007). The environment damage caused by invasive alien
species is very difficult to recover because this is related to organisms that perform adaptation, growth and reproduction. The invasive alien species can cause the losses of endemic species. Its negative impact is usually difficult to control (SoER Indonesia 2007).
Based on the result of the SEAMEO BIOTROP and the State Ministry of the Environment (KLH) inventories (http://www.biotrop.org/database.php?act=dbias), there are about 339 plant invasive alien species found in Indonesia. These invasive alien species do not include commodities that are regulated under Government Regulation – PP No. 16/1992, on animals, fish and plants quarantines, PP No.82/2000 on animal quarantines and PP No.14/2002 on plant quarantines (SoER Indonesia 2007).
1.2.2.7. Pollution
Pollution is one of the main threats to biodiversity, especially to water biodiversity (river, lake, coastal and ocean) that cause the death of flora and fauna and also destruction to ecosystems. The main source of pollution is caused by human activities (industry, agriculture, home activities and transportation). Therefore, pollution is related to the population growth.
The population growth in coastal regions and the increase of tourism activities will also increase the amount of waste and its bacterial contents that can cause destruction of the coastal areas. In addition, the use of fertilizers in rice fields which occur along the river flow (DAS/ Daerah Aliran Sungai) and industrial activities on the land which deposit their waste into the river body and then washed away to the sea through coastal areas, will also increase the ecological pressure of the coastal region.
The pollution from industrial waste and ships along the coastal areas generally contain heavy metal. These heavy metal content is predicted to increase because of erosion and soil wash, the infiltration of industrial waste and the burning of fossil fuel into coastal areas and the atmosphere, as well as the direct release of metal sedimentation from active mud (Dahuri 2003).
1.2.2.8. Climate Change
Another factor that can cause biodiversity loss is climate change. In the National Strategic Action Plan for Climate Change - NAPCC (2007), it was mentioned that the real impact of the climate change on the species as a component of biodiversity is the change in its distribution range, the increase of species rarity and the alteration of reproduction period.
The Report of the Intergovernmental Panel on Climate Change (IPCC) issued in April 2007 about the impact, susceptibility, and adaptation to the climate change, reveals that about 20-30% of plants and animals are predicted to have a higher risk of loss if the rise of the global temperature is above 1.5-2.5oC. If there is no prevention effort done to mitigate this impact, two thirds of the whole species on the earth will disappear in 2100 (NAPCC 2007; SoER Indonesia 2007).
the increase of sea level of 1-2 meter in the last 100 years, and it is predicted that in 2030, the sea level will increase of about 8-29 cm from now. The negative impact from the increase of the sea level for the coastal areas in Indonesia is e.g. the damage of coastal ecosystem including mangrove ecosystem (NAPCC 2007).
1.3. Status and Trends of, and Threats to Biodiversity
1.3.1. Status and Trends of, Threats to Terrestrial Biodiversity
In the report on status, threat, and conservation of main terrestrial ecosystem, three categories of main Indonesian biomes have been identified, i.e. 1) forests, 2) karst area and 3) small islands. This sub-chapter elucidates the recent biodiversity status, threat, and conservation effort for these three main terrestrial biomes of Indonesia.
(a) Forest
Indonesia has a great number of forest areas with fantastic biodiversity. However, since the implementation of investment regulation at the end of 1960s, the forest in Indonesia has been drastically changed. Deforestation rate that include degradation, deforestation and fragmentation is estimated to reach 1.6 million hectare per year (MoF 2007). Lowland forest, which is the most diverse area for biodiversity, is the most threatened forest due to conversion of land use, moving farm, irreversible forest management, development of infrastructure, mining, fires and various illegal activities that threaten the whole forest.
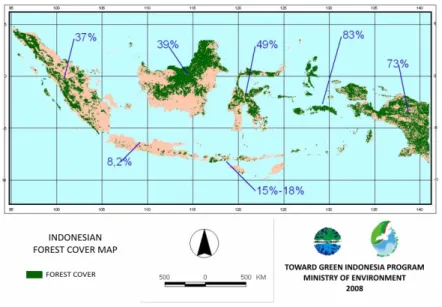
Figure 1.6. Map of forest vegetation cover in Indonesia in 2006/2007.
Source: State Ministry for Environment - KLH, 2008
Data produced by the Ministry of Forestry (MoF) at the end of 2008 showed that the size of forest in Indonesia has reached 120.35 million hectare (Secretary General of MoF, Center for Information 2008). Map of forest vegetation cover is shown in figure 1.6.
Various human activities are still often found in the conservation areas. This activities increase rate of damage to the conservation area, such as nature reserve, animal sanctuary, national park, nature
tourist-park and great forest tourist-park, besides the damage to production forest area.
The damage rates to the production forest also tend to increase. The plantations in production forest areas such as HTI (Estate Forest) are categorically small compared to the size of forest areas that had been given by the government to develop this estate forest. The realization of plantation in 1996 is only 50%, but this decreased to 43% in 1997, and in 1998 this was further lowered down to 32%. The cumulative size of plant forest area that has been planted until 2006 is 2.88 million hectare from the targeted size of 10.2 million hectare.
The land clearance through the conversion of natural forest to oil palm plantation gives a contribution to the damage of forest area. In 2003, the size for oil palm plantation was 5.25 million hectares, until 2005 the size of this plantation reached 5.59 million hectares. It is predicted that the expansion of oil palm plantation will still increase to 13.8 million hectares in 2020. The conservation of natural forest into oil palm plantation is a serious threat to the conservation of biodiversity, because the conversion is often conducted in tropical lowland rainforest which is categorized as the type of ecosystem with the highest biodiversity (SoER Indonesia 2007).
Forest in relation to climate change can play a role as carbon sink, carbon storage, as well as carbon source. Deforestation and degradation can increase the carbon source, while a-forestation, reforestation and other planting activities can increase the carbon sink and storage. The emission of the Green House gas, which happened in Land Use, Land Use Change and Forest (LULUCF) sectors in Indonesia come from deforestation (forest conversion for other uses such as agriculture, plantation, residential, mining, regional infrastructure) and degradation (the decrease of forest quality due to illegal logging, fire, over cutting, land clearance by slash and burn and forest clearance (NAPCC 2007).
Figure 1.7. The emission of CO2 (ton million) due to forest fire in Indonesia (compiled from Heil et al. 2007).
Source: NAPCC 2007
Furthermore in NAPCC (2007), it was stated that the El Nino, which caused the natural condition of dryness, is a factor that triggers forest and land fires in Indonesia. Besides El Nino factor, human factor has also a role in triggering forest fires. Figure 1.5 on page 7 showed the number of hotspots and El Nino during 2002-2007. In general, a relationship described from the figure that linked between El Nino-Southern Oscillation (ENSO) and the number of hotspots in Indonesia. Therefore, a mechanism to forecast the probability of extreme weather through accurate and informative early warning system for the
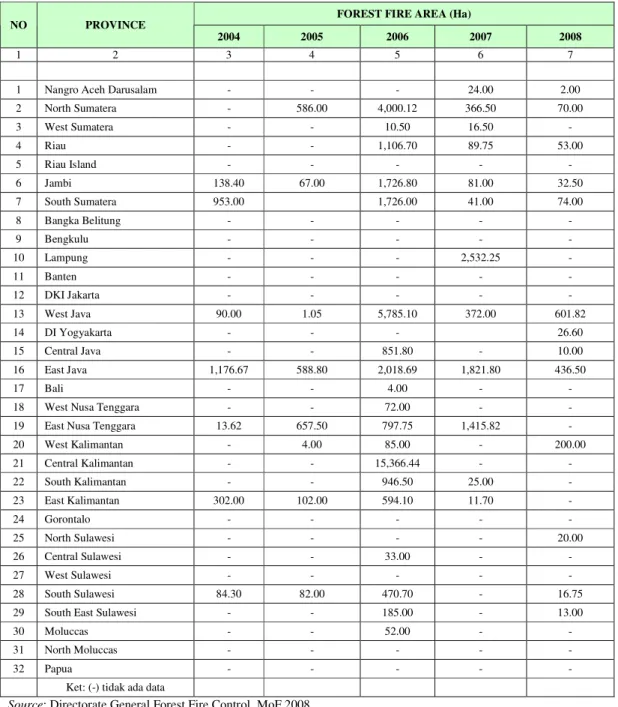
whole level of community is needed and must be established. The number of forest fires and burnt areas in several regions in Indonesia are shown in Table 1.3.
Table 1.3. The size of burnt areas (in hectares) of reported forest fires in several provinces between 2004-2008
FOREST FIRE AREA (Ha)
NO PROVINCE
2004 2005 2006 2007 2008
1 2 3 4 5 6 7
1 Nangro Aceh Darusalam - - - 24.00 2.00
2 North Sumatera - 586.00 4,000.12 366.50 70.00 3 West Sumatera - - 10.50 16.50 - 4 Riau - - 1,106.70 89.75 53.00 5 Riau Island - - - - - 6 Jambi 138.40 67.00 1,726.80 81.00 32.50 7 South Sumatera 953.00 1,726.00 41.00 74.00 8 Bangka Belitung - - - - - 9 Bengkulu - - - - - 10 Lampung - - - 2,532.25 - 11 Banten - - - - - 12 DKI Jakarta - - - - - 13 West Java 90.00 1.05 5,785.10 372.00 601.82 14 DI Yogyakarta - - - 26.60 15 Central Java - - 851.80 - 10.00 16 East Java 1,176.67 588.80 2,018.69 1,821.80 436.50 17 Bali - - 4.00 - -
18 West Nusa Tenggara - - 72.00 - -
19 East Nusa Tenggara 13.62 657.50 797.75 1,415.82 -
20 West Kalimantan - 4.00 85.00 - 200.00 21 Central Kalimantan - - 15,366.44 - - 22 South Kalimantan - - 946.50 25.00 - 23 East Kalimantan 302.00 102.00 594.10 11.70 - 24 Gorontalo - - - - - 25 North Sulawesi - - - - 20.00 26 Central Sulawesi - - 33.00 - - 27 West Sulawesi - - - - - 28 South Sulawesi 84.30 82.00 470.70 - 16.75
29 South East Sulawesi - - 185.00 - 13.00
30 Moluccas - - 52.00 - -
31 North Moluccas - - - - -
32 Papua - - - - -
Ket: (-) tidak ada data
Source: Directorate General Forest Fire Control, MoF 2008
At the species level, the impacts of human activities such as poaching, illegal trade of fauna, habitat destruction, over exploitation, illegal logging and forest clearance as well as the introduction of alien species, placed Indonesia as a country with long list of species that are threatened with extinction. The list includes 140 species of birds, 63 species of mammals (IUCN 2008), and 21 species of reptiles. About 382 species have been listed in the conserved species in Indonesia, and it is predicted that this number
will increase as a consequence of an increasing number of threats to the conservation of various species in Indonesia (SoER Indonesia 2007).
The level of threatened species was studied by the International Union for Conservation of Nature and Natural Resources. In the case of bird taxa, the data used are based on the study of BirdLife International. The result of the study on a particular species was prioritized based on the level of threat from low to high categories: vulnerable-VU, endangered-EN, and critically endangered (CR).
Table 1.4. Change of Status of bird species in Indonesia
Year IUCN Threaten Criteria
2004 2007 2008
(Vulnerable – VU) 73 71 69
(Endangered – EN) 31 32 33
(Critically Endangered – CR) 17 16 16
Total 121 119 118
Source: Burung Indonesia, 2009 processed from BirdLife International data 2008
The data on Table 1.4 shows the changes on the level of threat of bird taxa in Indonesia. In total, there is a decline in the total number of species in the list of threatened species, i.e. from 121 bird species in 2004 to 118 bird species in 2008. However, this decline did not always mean the decrease of the number of the threatened species, but would happen due to the change on the taxonomical and nomenclatural status of the species. The changes on the number of the threatened species caused by: (a) taxon/taxa merger; (b) decreasing status; (c) increasing status; and (d) taxon/taxa split. On the other hand, the threatened status of species due to the increasing of threat status (not due to the change of its nomenclature) was increased to Aepypodiusbruijnii (from Vulnerable-VU in 2007 to Endangered (EN) in 2008) and Kareo Talaud (Amaurornismagnirostris) start to be in the list as Vulnerable-VU in 2007.
In 2004, there were 121 threatened species, but in 2007 there was a decline where in total became 119 species (Table 1.4). The differences were caused by; (a) Lumping of taxa, which made the loss of bird species listed in 2007, i.e. Remetuk Biak (Gerygone hypoxantha) EN. It was previously assigned as a species, but in 2007, this taxon was merged to sub species of Gerygone magnirostris with Least concern (LC) status; (b) The reduction of status which also excludes taxa listed in 2007, i.e. Tiong-lampu ungu (Eurystomus azureus) VU, Sikatan damar (Ficedula henrici) VU, Gelatik Timor (Padda fuscata) VU, Undan paruh-totol (Pelecanus philippensis) VU and Merpati-hitam Timor (Turacoena modesta) VU. According to the result of BirdLife International work in 2007, the status of those species became NT and was excluded from the list of threatened bird species in Indonesia, (c) The increase of the status made a “new” species listed in the threatened species in 2007, i.e. Kareo Talaud (Amaurornis magnirostris) (listed with VU status); and (d) The split of the taxa to several species also affects and adds “new” list of the threatened species in 2007 list, such as Poksai Sumatera (Garrulax bicolor) VU. The result of the BirdLife International in 2007 evaluation that followed Collar (2006), split Garrulax leucolophus to G. leucolophus with LC status and G. bicolor with VU status, Elang Flores (Spizaetus floris) with EN status. The result of the BirdLife International team evaluation in 2005 followed Gjershaug et al. (2004) split
Spizaetus cirrhatus to S. cirrhatus with LC status and S. floris with EN status and Pterodroma sandwichensis with LC status and S. floris with EN status and Pterodroma sandwichensis was recorded as new vagrant species to Indonesia with VU status.
The threat to species was also caused by poaching, trading and illegal distribution (SoER Indonesia 2007). As recorded in SoER Indonesia (2007), the result of the investigation conducted by Wildlife Crime Unit/WCU (one unit with Wildlife Conservation Society/WCS, international NGO, counterpart of Directorate General of Forest Protection and Nature Conservation - PHKA) Lampung on poaching, trading and illegal distribution of Sumatran Tiger in Lampung, Bengkulu and southern part of Sumatera (Sumbagsel) had recorded 47 died Tiger since 2003-2006.
Moreover, it was also reported in the SoER Indonesia (2007) that during the period of 2006-2007, 11 Sumatran tigers were killed and their skin/parts had been found traded in Sumbagsel (in detail: 2 tigers in Lampung, 1 in Bengkulu and 8 in South Sumatera). This finding was obtained from direct communication with hunters, collectors, consumers and from the finding reports of the caught tiger hunters. Despite all threats mentioned above, the effort of rehabilitation has been introduced to enhance the target of managing sustainable forest as well as to help mitigating the global climate and to improve the environmental support. In 2006, the size of marginal land in Indonesia (excluding DKI province) was 19,506,487 hectares,while the size outside forest area was 10,690,311 hectares (MoF 2007). Until 2007, 2,077,326 hectares had been planted through Forest and Land Rehabilitation Movement (GERHAN). Indonesia Planting Movement followed by global planting movement and plant care action of 79 million trees (the realization was 73,649,837 trees) and “Woman Action on Planting” with the target of 10 million trees had also taken place. “Planting Movements” has reached 103 million trees and received the award from United Nation Environmental Program (UNEP) in 2008. These efforts continued with “Indonesia Planting 100 Million Trees” that was initiated on 28 November 2008.
At the ecosystem level, conservation efforts are made through the assignment of conservation areas as a place to protect and to conserve biodiversity, i.e. nature reserve, wildlife sanctuary, national park, tourist nature-park, great forest park (Tahura) and hunting park. These efforts were intended to conserve the diversity of ecosystem types in Indonesia under a conservation network. These conservation areas reach 27.968 million hectares that are distributed under 532 conservation units (SoER Indonesia 2007). Figure 1.8 shows the increase in the coverage of conservation areas from 1981 to 2007.
With regard to the effort of managing the conservation areas effectively until 2008, of the whole conservation areas (terrestrial) presented in Figure 1.8, the management plan of 105 conservation units have been approved, 87 unit plans are being approved, and 338 units have not developed their management plans yet.
Figure 1.8 Relationship between Coverage of Conservation Area and The Number of Conservation Management Units Established.
Source: Environmental State of Indonesia - SoER Indonesia 2007
At species and genetic level, conservation effort had been carried out through in-situ conservation. The in-situ conservation has played very important roles in managing and protecting wild plants and animals in their natural habitats. Up to 2007, Indonesia (through the Ministry of Forestry) has been placed under protection through Government Regulation (PP) No. 7/1999 fauna namely mammals (70 species), bird (93 taxa), reptiles (31 species), fish (9 species), insects (20 species), Anthozoa (1 species) and Bivalvia (14 species) and conserved flora namely Araceae (14 species), Arecaceae (1 genus, 11 species), Raflessiaceae (1 genus), Orchidaceae (27 species), Nephentaceae (1 genus), Dipterocarpaceae (12 species) . Furthermore, Indonesia has ratified CITES and registered 1053 species of flora and 1384 species of fauna into Appendix I and II of CITES as another effort to control the trade of wild flora and fauna which are nearly extinct.
Table 1.5. Species of Wild Plants and Animals Breed in Captivity in Indonesia (up to 2008)
No Wild Plant and Animal Status Number of Breeder Number of breeder with permit in process in Ditjen PHKA Breeding Commodity
1 Reptil Protected 26 - Phyton morulus bivittatus, Chlamydosaurus kinggi, Phyton curtus, Phyton reticulatus
2 Chrocodile Protected 22 1 Crocodylus porosus, Crocodylus novaguineae
3 Arwana Protected 124 1 Scleropagus formosus, Scleropagus jardini
4 Butterfly Protected 6 2 Troides spp.
5 Rusa Protected 77 2 Cervus spp.
6 Orchid Protected 12 1 Orchideae (hybrid)
7 Bird Protected 16 5 Cacatua spp., Sturnus melanopterus, Leucopsar rochschildi
8 Coral Ornament
Unprotected 33 - Acropora spp., Hydnophora rigida, Pociiopora spp., Merulina scabricula, etc. 9 Molusc Protected 3 - Tridacna spp., Trochus niloticus
10 Mammals Protected 97 - Macaca
Total 416 12
Source: Directorate Forest Protection and Nature Conservation, MoF, 2008
At the same level, the effort of conservation has also been carried out through ex-situ conservation, a management of biodiversity outside natural habitats to support the in-situ conservation. For the species,
which are threatened to extinct, ex-situ conservation is designed for population recovery through the reintroduction of animals resulted from breeding program into their natural habitats. Meanwhile, for the species that are not threatened to extinct, ex-situ conservation intends to reduce the pressure on the population in the wild due to permanent impact of trading.
In accordance with the Government Regulation (PP) No 7/1999 on Conservation of Plant and Animal Species and Government Regulation (PP) No. 8/1999 on the Use of Wild Plant and Animal Species, efforts of ex-situ conservation include breeding activities, cultivation of medicinal plants and development of conservation institutions such as botanic garden, arboretum, etc. Under these new botanic gardens, the rare and threatened to extinct species of plants, especially those local plants in where the botanic garden occurred could be saved.
Table 1.6. Trend of breeding activities until 2008
Breeding Year Protected Flora and
Fauna
Unprotected Flora and
Fauna Total
2006 127 44 171
2007 269 38 307
2008 383 33 416
Source: Directorate Forest Protection and Nature Conservation, MoF, 2008
On plant ex-situ conservation, there are four designated Botanic Gardens (Bogor, Cibodas, Purwodadi and Bali) that are institutionally under the Center for Plant Conservation, Indonesian Institute of Sciences (LIPI) (Sukendar 2007 in Sujiprihati et al. 2006). Several local governments allocated some land for ex-situ conservation in form of botanical garden (Table 1.7).
Table 1.7. Existing and planned Botanic gardens in several provinces in Indonesia until 2010
No. Name of Botanic Garden District/City Province 1. Bukit Sari Botanic Garden Batanghari & Tebo District Jambi
2. Baturraden Botanic Garden Banyumas District Central Java 3. Kuningan Botanic Garden Kuningan District Jawa Barat 4. Balikpapan Botanic Garden Balikpapan City East Kalimantan 5. Katingan Botanic Garden Katingan District Central Kalimantan 6. Sambas Botanic Garden Sambas District West Kalimantan 7. Sungai Lait Botanic Garden Sanggau District West Kalimantan 8. Samosir Botanic Garden Samosir District North Sumatera 9. Liwa Botanic Garden West Lampung District Lampung 10. Batam Botanic Garden Batam City Riau Island 11. Enrekang Botanic Garden Enrekang District South Sulawesi 12. Puca Botanic Garden Maros District South Sulawesi 13. Lombok Botanic Garden East Lombok District West Nusa Tenggara 2009
14. Solok Botanic Garden Solok District West Sumatera 15. Minahasa Botanic Garden Minahasa District North Sulawesi 16. Kendari Botanic Garden Kendari City South East Sulawesi 2010
17. Mamuju Botanic Garden Mamuju Utara District West Sulawesi
18. Aceh Botanic Garden Banda Aceh City Nangroe Aceh Darussalam
The State Ministry of Environment (KLH) initiated another effort of ex-situ conservation through the development of Biodiversity Park. This Park is developed for protecting genetic resources and will become a place where the collections of local biodiversity are deposited. In 2008, 15 hectares Biodiversity Park for local plants has been built in Central Java in the city of Semarang. In 2009, Biodiversity Park will also be developed in the province of West Sumatra, Lampung, and D.I. Yogyakarta.
(b) Karst Region
Figure 1.9. Photograph of Karst Area in Gunung Kidul, Yogyakarta
Source : MoE, 2008
According to reports of the State Ministry of Environment (KLH) and the Collaborative Environmental Project in Indonesia (CEPI) 2002 in SoER Indonesia (2004), Indonesia has Karst area of about 15.4 million hectares that spread in several regions such as Central Java, East Java, South Sulawesi and Papua. One of the unique Karst regions in Indonesia is Maros Karst area of 30,000 hectares that is located in the Regency of Maros and Regency of Pangkep, South Sulawesi. This karst area is known as the Classic Tropical Zone in which 284 species of plants and more than 103 species of butterfly in Bantimurung (of 103, seven species are endemic) are found in this region. Several species of mammals such as Tarsius, Cuscus and 2 species of bat which play role as the main pollinating agent for approximately 100 plant species have also been reported to occur in this area.
The results of the joint research between scientists from the Research Center for Biology, LIPI and scientists from France between 2001-2003 have added several new species of fauna from Maros. Those new species namely the Cave beetle (Eustra saripaensis Deuve, 2002) and Cave Collembola, Pseudosinella maros (Deharveng and Suhardjono, 2004) were found in one of the caves in the area of Samanggi. Aquatic Isopod, the new species Cirolana marosina (Botosaneanu, 2003) has also been found in a small cave in the same area.