The simulation of canopy transpiration under doubled CO
2
: The
evidence and impact of feedbacks on transpiration in two 1-D
soil-vegetation-atmosphere-transfer models
Jon C. Gottschalck
a,∗, Robert R. Gillies
b, Toby N. Carlson
caDivision of Meteorology and Physical Oceanography, University of Miami, Miami, FL 33149, USA bDepartment of Plants, Soils, and Biometeorology and Department of Geography and Earth Resources,
Utah State University, Logan, UT, USA
cDepartment of Meteorology, The Pennsylvania State University, University Park, PA 16802, USA
Received 24 May 1999; received in revised form 27 June 2000; accepted 29 June 2000
Abstract
Increasing levels of atmospheric CO2concentration [CO2] has caused a debate in the scientific community over how
veg-etation responds to this increase — specifically in the stomatal resistance increase (SRincrease) and the transpiration decrease
(TRdecrease). This paper presents results in changes of stomatal resistance and transpiration from two canopy model simulations
under varying environmental conditions for corn and soybeans for presentday and doubled atmospheric [CO2] conditions.
The two canopy models used in the simulations were the off-line version of the land surface exchange parameterization of the GENESIS general circulation model (LSX) and the Penn State University Biosphere-Atmosphere Modeling Scheme (PSUB-AMS). Simulations were performed with each model’s original stomatal resistance parameterization (SRP) and then with a field-derived SRP developed from corn and soybeans field measurements taken during 1993–1995.
For corn using the original SRP, the percentage ratio (TRdecrease/SRincrease×100) calculated ranged from 20 to 37% for
both models and values ofΩ(a non-dimensional ‘decoupling coefficient’ that relates how closely the TRdecreaseis correlated
with SRincrease) ranged from 0.63 to 0.80. The results for corn, using the field derived SRP, showed that the percentage ratio
andΩranged from 18 to 25% and 0.75 to 0.82, respectively. For soybeans, the values of the percentage ratio andΩfor the original SRP ranged from 20 to 39% and 0.61 to 0.80, respectively, while for the field derived SRP they were 12–20% and 0.80–0.87. The model derived values for the percentage ratio were substantially less than those reported in the literature for experiments conducted at the leaf scale. It is also demonstrated, using these models, how inter-canopy (LSX and PSUBAMS) and mixing layer (PSUBAMS) feedbacks modify transpiration beyond those initiated by changes in stomatal resistance alone. © 2001 Elsevier Science B.V. All rights reserved.
Keywords:Atmospheric CO2concentration; Stomatal resistance; Transpiration
∗Corresponding author. Tel.:+1-305-361-4745;
fax:+1-305-361-4696.
E-mail address:[email protected] (J.C. Gottschalck).
1. Introduction
As a consequence of human development, mainly the burning of fossil fuels for energy, the atmospheric
carbon dioxide concentration ([CO2]) has increased
to 358mmol mol−1 during the past 35 years from
315mmol mol−1 (Keeling et al., 1995). International
reports have suggested that [CO2] will double by the
middle of the next century (Watson et al., 1990). An important aspect of the rise in [CO2] is its effect on
plant function and physiology. In an elevated [CO2]
environment, more [CO2] enters the leaf through the
stomata, increasing the leaf interior [CO2] which
manifests itself as an increase in the stomatal resis-tance and a decrease in transpiration (Mott, 1990).
Transpiration changes initiated by increased [CO2]
have impacts on both agriculture and meteorology. Agricultural scientists are interested in any alteration in the water usage by field crops that might affect yield and result in future economic repercussions (see reviews by Morison, 1985; Eamus, 1991). Meteorol-ogists, however, are more concerned with how plant responses to increased atmospheric [CO2] might alter
the surface energy balance and affect climate at the lo-cal, regional, and global scales (Jacobs and DeBruin, 1992; Avissar, 1993; Pollard and Thompson, 1995; Henderson-Sellers et al., 1995; Jacobs and DeBruin, 1997).
Transpiration at the scale of the single leaf in
ele-vated levels of atmospheric [CO2] has been actively
researched for the past 35 years. In these studies, a decrease in transpiration (TRdecrease) was reported and
when applicable, the change was expressed as a per-centage ratio1 (TRdecrease/SRincrease) between the
de-crease in transpiration and the inde-crease in stomatal resistance (SRincrease). The magnitude of the
transpi-ration decrease and the percentage ratio varied con-siderably. It depended on many factors such as plant characteristics and environmental conditions, such as photosynthetic photon flux density, humidity, and air temperature of the test. These leaf scale studies as-sessed the decrease in transpiration and the percent-age ratio in three ways (magnitudes shown as (de-crease in transpiration; percentage ratio)1): direct mea-surement (Rogers et al., 1984 (57%; 71%); Rozema
et al., 1990 (15–48%; 2N/A); Kirkham et al., 1991
(25–35%; 43%)), indirect calculation from a combi-nation of measurements which were study dependent (Pallas, 1965 (21–68% N/A); Egli et al., 1970 (25%
1In some studies, the ratio could not be reported as stomatal
resistance, was not directly measured — alternate means to arrive at a value for the change in the transpiration were used.
2N/A: not available, refer footnote 1.
N/A); Akita and Moss, 1972 (23%; N/A); Morison and Gifford, 1984 (21%; 36%); Idso et al., 1984 (27%; N/A); Valle et al., 1985 (5%; N/A); Idso et al., 1987 (9%; N/A); Nijas et al., 1988 (51%; N/A)), and by ap-plication of numerical models to simulate the energy balance for a single leaf (Owensby et al., 1993 (21%; 40%); Zhan and Wilks, 1994 (23%; N/A)). A review of 46 observations of doubled [CO2] effects on
tran-spiration was reported by Kimball and Idso (1983) who found on average that transpiration decreased by 34%. Furthermore, a review article by Cure and Acock (1986) compiled all published data for known doubled
[CO2] experiments for major crops and reported that
transpiration was reduced on average by 23% for all crops and the percentage ratio on average was 76%.
When scaling from the single leaf to a full canopy, other factors affect the extent to which doubled [CO2]
changes transpiration. For instance, inside canopies plants tend to modify the microclimate, which may inhibit water loss from the plants. Moreover, air temperature and humidity above the canopy are fre-quently changing in the face of atmospheric forcing from above, altering the atmospheric demand for heat and water from the canopy. In addition, a change in canopy transpiration may result via a change in wind speed above the canopy or in the height and density of the vegetation, all of which alter aerodynamic re-sistances. Changes in these quantities that alter the transfer of water vapor in and through the canopy will impact what the vegetation ‘feels’ through the guard cells of the leaf (Aphalo and Jarvis, 1993). These inter-canopy and boundary layer effects interact to adjust the transpiration (Baldocchi, 1994; Field et al., 1995; Jacobs and DeBruin, 1997; Raupach, 1998; Steduto and Hsiao, 1998a–c).
A few canopy field studies have been performed on
the impacts on transpiration in elevated [CO2]. The
free-air carbon dioxide enrichment (FACE) program (Hendrey and Kimball, 1994) conducted increased (ambient+200mmol mol−1) [CO2] studies on canopy
sized plots of cotton and wheat. Hileman et al. (1994) observed that in an enriched [CO2] environment,
sea-sonal transpiration was unchanged despite an increase of 13–44% in stomatal resistance; this was due to an increase in plant foliage. Besides this field study, there are some canopy modeling studies that have researched the impacts on transpiration in a simulated
Henderson-Sellers et al., 1995; Pollard and Thomp-son, 1995; Carlson and Bunce, 1996; Bunce et al., 1997; Brown and Rosenberg, 1997; Grossman-Clarke et al., 1999). Friend and Cox (1995), using a single column model, found a decrease in evapotranspiration
of 22% for doubled CO2 experiments over an
Ama-zon tree canopy. Henderson-Sellers et al. (1995) and Pollard and Thompson (1995) used off-line versions of land surface parameterizations in the GENESIS (LSX) and CCM1-Oz (BATS) general circulation
models, respectively, to diagnose doubled [CO2]
ef-fects on transpiration. These two models in their off-line form prescribe atmospheric conditions so that no dynamic interaction occurs between the sur-face fluxes and the mixing layer. For both studies, the stomatal resistance was doubled to parameterize
doubled [CO2] for wet grassland canopies and
re-ported a decrease in transpiration of 28 and 18% for Pollard and Thompson (1995) and Henderson-Sellers et al. (1995), respectively. Carlson and Bunce (1996) performed a sensitivity test in a corn and soybean
study by representing the effects of doubled [CO2]
on stomatal resistance by increasing the stomatal re-sistance from 0 to 150% and observed a subsequent decrease in transpiration ranging from 0 to 25%. Grossman-Clarke et al. (1999) simulated a 5% de-crease in total seasonal canopy transpiration under elevated [CO2] (370–550mmol mol−1) using a wheat
crop model and, Brown and Rosenberg (1997) found decreases in evapotranspiration of 3–10% and 4% for corn and soybeans respectively for a 40% stomatal resistance increase.
The results from these canopy studies are interesting and important because the results (expressed either as TRdecrease or TRdecrease/SRincrease) are much less than
those observed for research conducted at the scale of the single leaf. The discrepancy between the results in the literature for studies conducted at the scale of a sgle leaf compared with those from canopy models in-dicate that other factors besides the stomatal resistance are interacting to alter the transpiration at the canopy scale. Feedbacks in ambient humidity, wind speed, ra-diation, and vegetation structure significantly impact the flux of water vapor from the canopy (Jarvis and McNaughton, 1986; McNaughton and Jarvis, 1991; Aphalo and Jarvis, 1993; Baldocchi, 1994; Jacobs and DeBruin, 1997; Raupach, 1998; Steduto and Hsiao, 1998a–c).
This paper presents the results of a modeling ap-proach used to investigate how plant inter-canopy and boundary layer feedbacks alter the decrease in transpi-ration when perturbed in doubled [CO2] under
differ-ing environmental conditions. The results are reported both in terms of the percentage ratio3, the decoupling
coefficient,Ω(Jarvis and McNaughton, 1986) as well
as the stomatal resistance to total aerodynamic resis-tance ratio (rs:ra).
2. Methodology
2.1. Model descriptions
Two numerical models were used in this study: The off-line version of the land surface exchange pa-rameterization of the GENESIS GCM (LSX) and the Penn State University Biosphere-Atmosphere Model-ing Scheme (PSUBAMS). The LSX model is a 1-D soil-vegetation-atmosphere-transfer model (SVAT) in which atmospheric boundary conditions are prescribed so that no dynamic interaction occurs between the surface and mixing layers (Pollard and Thompson, 1995). PSUBAMS, on the other hand, is a 1-D atmo-spheric boundary layer SVAT (Carlson and Boland, 1978; Carlson, 1986; Taconet et al., 1986; Lynn and Carlson, 1990) model (ABL-SVAT) that allows dy-namic interaction between the surface fluxes and at-mosphere. With this capability, the impact of the mix-ing layer on any transpiration change may be studied (Carlson and Bunce, 1996; Bunce et al., 1997).
To conduct doubled [CO2] comparisons between
LSX and PSUBAMS, similar initial conditions were specified in each model to represent a comparable
environment prior to the doubled [CO2]
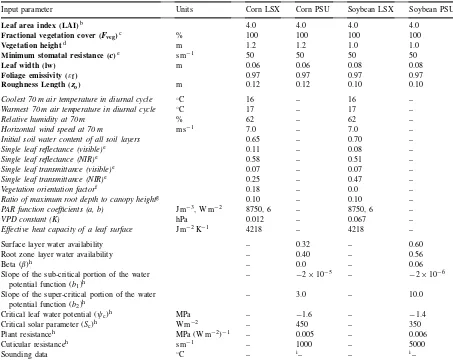
investiga-tion. The initial conditions necessary as input for each model and the specific values chosen for the stan-dard scenario are provided in Table 1. Transpiration, a prognostic field that involves a complex series of interactions among model variables, from both LSX
and PSUBAMS were within 40–50 W m−2during the
simulation period (8:00 a.m.–4:00 p.m.).
3 Comparatively, this is preferable to quoting theabsolute
Table 1
The initial conditions used in the corn and soybean model comparisons for LSX and PSUBAMSa
Input parameter Units Corn LSX Corn PSU Soybean LSX Soybean PSU
Leaf area index (LAI)b 4.0 4.0 4.0 4.0
Fractional vegetation cover (Fveg)c % 100 100 100 100
Vegetation heightd m 1.2 1.2 1.0 1.0
Minimum stomatal resistance (c)e s m−1 50 50 50 50
Leaf width (lw) m 0.06 0.06 0.08 0.08
Foliage emissivity (εf) 0.97 0.97 0.97 0.97
Roughness Length (zo) m 0.12 0.12 0.10 0.10
Coolest 70 m air temperature in diurnal cycle ◦C 16 – 16 –
Warmest 70 m air temperature in diurnal cycle ◦C 17 – 17 –
Relative humidity at 70 m % 62 – 62 –
Horizontal wind speed at 70 m m s−1 7.0 – 7.0 –
Initial soil water content of all soil layers 0.65 – 0.70 –
Single leaf reflectance (visible)e 0.11 – 0.08 –
Single leaf reflectance (NIR)e 0.58 – 0.51 –
Single leaf transmittance (visible)e 0.07 – 0.07 –
Single leaf transmittance (NIR)e 0.25 – 0.47 –
Vegetation orientation factorf 0.18 – 0.0 –
Ratio of maximum root depth to canopy heightg 0.10 – 0.10 –
PAR function coefficients (a, b) J m−3, W m−2 8750, 6 – 8750, 6 –
VPD constant (K) hPa 0.012 – 0.067 –
Effective heat capacity of a leaf surface J m−2K−1 4218 – 4218 –
Surface layer water availability – 0.32 – 0.60
Root zone layer water availability – 0.40 – 0.56
Beta (β)h – 0.0 – 0.06
Slope of the sub-critical portion of the water potential function (b1)h
– −2×10⁻⁵ – −2×10⁻⁶
Slope of the super-critical portion of the water potential function (b2)h
– 3.0 – 10.0
Critical leaf water potential (ψc)h MPa – −1.6 – −1.4
Critical solar parameter (Sc)h W m−2 – 450 – 350
Plant resistanceh MPa (W m−2)−1 – 0.005 – 0.006
Cuticular resistanceh s m−1 – 1000 – 5000
Sounding data ◦C – i– – i–
aThe input parameters in bold are used in both models while those italicized and in normal print only correspond to LSX or PSUBAMS,
respectively.
bLAI=4 is chosen to simulate a moderately dense canopy corresponding to conditions in early July (corn, Sellers and Dorman (1987);
soybean, Baldocchi (1992). Moreover, LSX is designed to execute using two-sided LAI despite a one-sided initialization. It was decided for consistency that both LSX and PSUBAMS run with a one-sided LAI.
cValues ofF
vegare 100% since modeling patches of bare soil with vegetation is not a focus in this study. dDetermined from Sellers and Dorman (1987) (corn) and Baldocchi (1992) (soybeans).
eObtained from Sellers (1985) (corn) and Baldocchi (1992) (soybeans).
fThe vegetation orientation factor for both corn and soybeans was obtained from Ross (1981). gThe ratio of the root depth to canopy height for both crops was left the same as that already in LSX.
hThe corn and soybean physiological parameters were obtained from Lynn and Carlson (1990) and refer to the stomatal resistance
parameterization.
In order to observe the response of doubled [CO2]
for different plants, simulations were performed for both corn and soybeans. These two crops were cho-sen for three reasons. First, these two species are cash crops and are important for agriculture. Second, they represent different plant classes and vary in their metabolism (corn — C4; soybean — C3). Lastly, data
collected from doubled [CO2] experiments (Wilson
and Bunce, 1997; Wilson et al., 1999) were readily available and easily incorporated into the model sim-ulations.
2.2. Stomatal resistance parameterizations
Model runs were undertaken for four cases (defined by the stomatal resistance parameterization (SRP)) as listed below:
1. LSX with its original SRP — indicated by LSXcurrent.
2. PSUBAMS with its original SRP (PSUcurrent).
3. LSX with a ‘field-derived’ SRP replacing its orig-inal SRP (LSXfield).
4. PSUBAMS with the same ‘field-derived’ SRP as in (3) replacing its original SRP (PSUfield).
All four cases parameterized the effect of doubled [CO2] on stomatal resistance by incorporating a [CO2]
function (f(CO2)) into the SRP to represent an increase
in stomatal resistance from present day to doubled [CO2]. The value for the increase in stomatal
resis-tance for the first two cases (LSXcurrentand PSUcurrent)
was assigned on the basis of the information contained in Cure and Acock (1986), which reported on average an increase in stomatal resistance of approximately 30% for corn and soybeans for doubled [CO2] studies,
therefore,f(CO2) was set to 1.3.
The remaining two cases (LSXfield and PSUfield)
made use of field measurements (Wilson and Bunce, 1997; Wilson et al., 1999). The corn and soybean plants were grown and measured in open-top cham-bers (outdoors) over three seasons (1993–1995) where
three [CO2] were used (ambient, 1.5×ambient, and
2× ambient). Responses to vapor pressure deficit,
photosynthetic photon flux density, and air tempera-ture were made by placing the leaf in the leaf chamber and incrementing humidity, photosynthetic photon flux density, and air temperature. These experiments were where specific field data were collected (a) to determine the change in the minimum stomatal
resis-tance from present day to doubled [CO2] and, (b) to
derive more representative environmental functions for the SRP, i.e. for air temperature (T), vapor pres-sure deficit (VPD), solar irradiance (S) and soil water content (SWC). In these cases,f(CO2) was set to 2.4
and 1.32 for corn and soybeans, respectively; these were based on measurements of minimum stomatal
resistance under both CO2 concentrations.
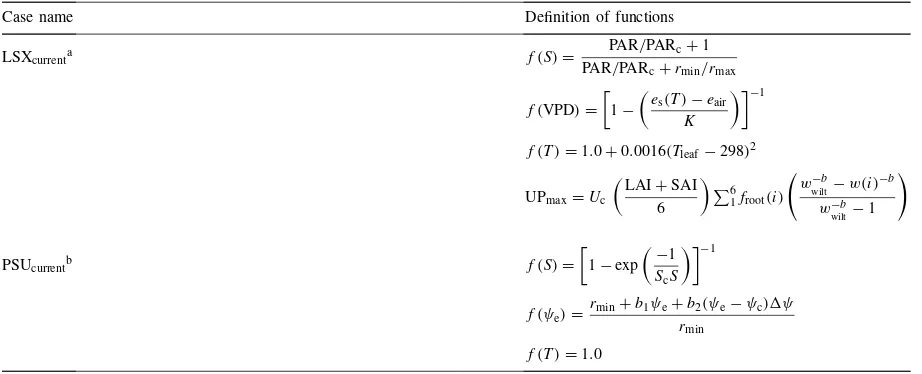
Formula-tions and function definiFormula-tions for these four cases are outlined in Tables 2–4 — Table 2 illustrates the gen-eral form used to conduct each case while Tables 3 and 4 provide more detail for the functions included in the stomatal resistance formulation.
Another important aspect of the study was to ob-serve how different environmental conditions might impact upon the transpiration change for doubled [CO2]. Therefore, this paper also presents, for both
present day and doubled [CO2], tabulated results for
a series of simulations (termed scenarios) for vary-ing environmental conditions (listed in Table 5) for each of the four cases. Table 5 indicates which initial conditions were changed in each of the scenarios as compared to the standard scenario (Table 1) which are shown in Section 3.
2.3. Quantification of results
As mentioned earlier, results from this study are reported by a percentage ratio (TRdecrease/SRincrease×
100), for comparison with the literature, and by
a non-dimensional parameter, Ω, as developed by
Jarvis and McNaughton (1986) and McNaughton and Jarvis (1991). The percentage ratio is composed of
both the decrease in transpiration (TRdecrease) and
the increase in stomatal resistance (SRincrease). The
TRdecrease and SRincrease are defined in Eqs. (1) and
(2) where SRpresentday, SRdoubled, TRpresentday, and
TRdoubled are the stomatal resistance and
transpira-tion for present day and doubled CO2, respectively.
Table 2
A description of the four cases used for doubled CO2 investigationa
Case name Stomatal resistance parameterization
Formulation Rmin f(CO2) for doubled
[CO2] simulationsb
Functions dependent
PSUcurrent: uses current
SRP from PSUBAMS
rs=rminf(S)f(T)f(ψe)f(CO2) 50.0 50.0 1.30 1.30 No
LSXfield: uses field
derived SRP
rs=rminf(S)f(T)f(VPD)f(SWC)f(CO2) 79.0 24.7 2.40 1.32 Yes
PSUfield: uses field
derived SRP
rs=rminf(S)f(T)f(VPD)f(SWC)f(CO2) 79.0 24.7 2.40 1.32 Yes aThe definitions for the individual functions in the stomatal resistance formulation are given in Tables 3 and 4. bf(CO
2) is equal to 1.0 for all present day simulations.
Table 3
Definition of functions included in the stomatal resistance parameterization for LSXcurrent and PSUcurrenta
Case name Definition of functions
LSXcurrenta f (S)=
aPAR: photosynthetic active radiation (W m−2); PAR
c: constant photosynthetic flux (a/c+b) (W m−2);a,b,care species dependent
variables (refer Table 1); rmin: minimum stomatal resistance (s m−1), rmax =a/b+c (s m−1);es(T): equilibrium vapor pressure at the
temperature of the leaf (hPa); eair: vapor pressure in the interleaf air spaces, K: VPD (vapor pressure deficit) constant (Pa−1); Tleaf:
leaf temperature (K); UPmax: maximum water uptake rate (kg m−2s−1) (f(SWC) (refer Table 2) affects the stomatal resistance in the
following manner.f(SWC) is equal to 1 at all times except when the transpiration rate exceeds UPmax. In the event of this condition, the
stomatal resistance is increased until the transpiration rate is equal to UPmax and a balance exists.)Uc=0.0002 kg m−2s−1; LAI: leaf
area index; SAI: stem area index;P6
1froot(i)=sum of the fraction of roots in all six soil layers;w(i)=soil water content in soil layer
i;wwilt=constant wilting point;b: empirical soil exponent. bS: total solar irradiance (W m−2),S
c: critical solar parameter (m2W−1); rmin: minimum stomatal resistance (s m−1);ψe: epidermal
water potential (MPa);f(ψe): epidermal water potential function (discontinuous linear function);b1: slope of the sub-critical portion of
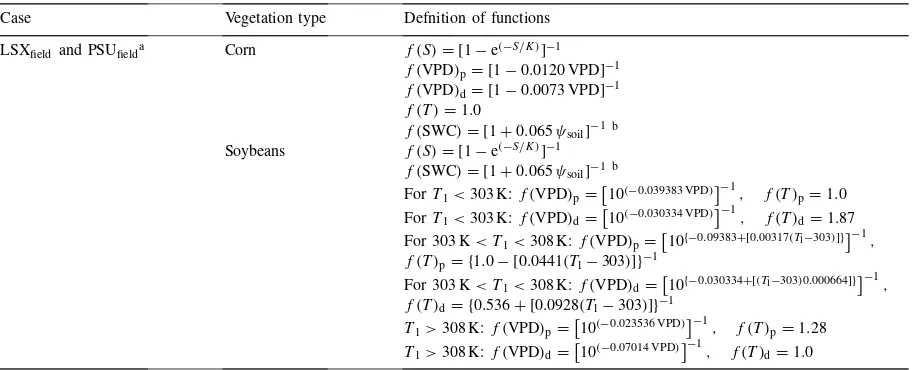
Table 4
Definition of functions included in the stomatal resistance parameterization for LSXfield and PSUfield
Case Vegetation type Defnition of functions LSXfieldand PSUfielda Corn f (S)=[1−e(−S/K)]−1 aS: photosynthetic active radiation for LSX
field (W m−2); S: total solar irradiance for PSUfield (W m−2);K: constant dependent upon
species and CO2concentration (W m−2); p: denotes used for present day [CO2]; d: denotes used for doubled [CO2]; VPD: vapor pressure
deficit (hPa);ψsoil: soil water potential (MPa);Tl: leaf temperature (K). bUsed for PSU
fieldonly, LSXfield usedf(SWC) as described in Table 3.
At the scale of a single stoma on a leaf, the decrease in transpiration and the increase in stomatal resistance are proportional, (3)
dsr
sr
= dTR
TR (3)
Since it is assumed that the leaf temperature and the bulk air are unaffected by fluxes from a single stoma. The termssrand TR are the stomatal resistance
and transpiration at a specified time during the day under present day [CO2] while dsrand dTR represent
the change in the stomatal resistance and transpiration
between the present day and doubled [CO2] model
runs at the same time in the day. This illustrates that the change in transpiration is under 100% stomatal control. As the scale increases to include the leaf and then the surface layer in the atmosphere, however, the feedback on the vapor pressure deficit (VPD) increases and, stomatal control of transpiration decreases. This effect is shown by the analytical solution containing the parameter (1−Ω)
It is important to note that the change in
transpi-ration with change in [CO2] depends not only on the
direct increase in stomatal resistance, but also on the sensitivity of transpiration to changes in environmen-tal conditions (e.g. those of the VPD, or those defined by the aerodynamic resistance, etc.) (Aphalo and Jarvis, 1993; Steduto and Hsiao, 1998a–c). The term (1−Ω), therefore, not only quantifies the percent de-crease in transpiration for a percent inde-crease in stom-atal resistance due to a change in [CO2] but also the
magnitude of any feedback initiated by external influ-ences. Consequently, (1−Ω) and so the stomatal con-trol of transpiration, is dependent upon the ratio of the stomatal resistance to the total aerodynamic resistance (this being defined as the sum of the leaf boundary layer resistance and the aerodynamic resistance from the roughness length to the top of the surface layer). The usefulness of this ratio in this study is discussed later.
The decoupling coefficientΩ, ranges from 0 to 1
and is a measure of how strongly decreases in transpi-ration are coupled to increases in stomatal resistance. At the lower limit (Ω =0), the transpiration is under 100% stomatal control (SRincrease = TRdecrease) and
the canopy is completelycoupled to the atmosphere.
As the value ofΩ increases towards unity, a percent
Table 5
A summary of the LSX and PSUBAMS input parameters for specific scenariosa
Scenario description LSX PSUBAMS
Parameter Value Units Parameter Value Units
Standard SWC6b 0.95 Mo/Mrd 0.70/0.70
Medium soil water content SWC6 0.65 Mo/Mr 0.50/0.56
Low soil water content SWC6 0.45 Mo/Mr 0.30/0.40
High wind U70 11 m s−1 USdˆ 18 m s−1
SWC6 0.80 Mo/Mr 0.62/0.72
Low wind U70 2.2 m s−1 US 2.5 m s−1
SWC6 0.80 Mo/Mr 0.67/0.73
High surface layer humidity RH70 95 % (T−Td)dˆ 1 ◦C
SWC6 0.90 Ωd 0.05 m
Mo/Mr 0.70/0.70
Low surface layer humidity RH70 45 % T−Td 20 ◦C
SWC6 0.90 Ω 0.025 m
Mo/Mr 0.70/0.70
Reduced solar irradiance SOLn 240 W SOLnd 236 W m−2
SWC6 0.95 m−2 Mo/Mr 0.71/0.75
Coupled canopy U70 12 m s−1 US 20 m s−1
LAI 2 LAI 2
Leaf width 0.03 (0.05)c m Leaf width 0.03 (0.05)c m
SWC6 0.85 Mo/Mr 0.68/0.70
Decoupled canopy U70 3 m s−1 US 2.5 m s−1
LAI 7 LAI 7
Leaf width 0.08 (0.10)c m Leaf width 0.08 (0.10)c m
SWC6 0.85 SWC6 0.71/0.75
Biomass increase LAI in 2X 4.4 (5.2)c LAI in 2X CO
2 4.4 (5.2)c
CO2 SWC6 0.95 Mo/Mr 0.70/0.71
High surface layer temperature T70range 23–25 (25–28)c ◦C TSdˆ 24 ◦C
SWC6 0.95 Mo/Mr 0.70/0.71
aThe table lists the input parameter(s) that were changed from those listed in Table 1 to conduct each scenario. For each scenario,
eight model runs were performed — both present day and doubled [CO2] settings for the four cases listed in Table 2.
bThe subscript 6 illustrates that all six soil layers were initialized with the same value and (ˆ) indicates that the change depicted was
performed for all levels in the sounding.
cThe values in parentheses correspond to soybean initial conditions when different from that of corn. d(1)M
oandMrrefer respectively to the surface and root zone layer water availabilities and are arranged in this order under the values
column, (2)US,TS, andT−Td refer to the wind speed, temperature, and dewpoint depression in the input sounding, (3)Ωrefers to the
integrated precipitable water, (4) SOLn refers to the noontime magnitude of the incoming solar irradiance after reduction to 25%.
extreme (Ω =1), transpiration is under 0% stomatal
control and, a percent change in stomatal resistance produces no change in transpiration so that the canopy
is completelydecoupled from the atmosphere.
Typi-cal values ofΩ for temperate forests are around 0.2
while those for crops and grassland generally range from 0.5 to 0.9 (Jarvis, 1985a,b; Meinzer and Grantz, 1989; Lee and Black, 1993). For a corn canopy un-der light winds and wet soil conditions, Steduto and
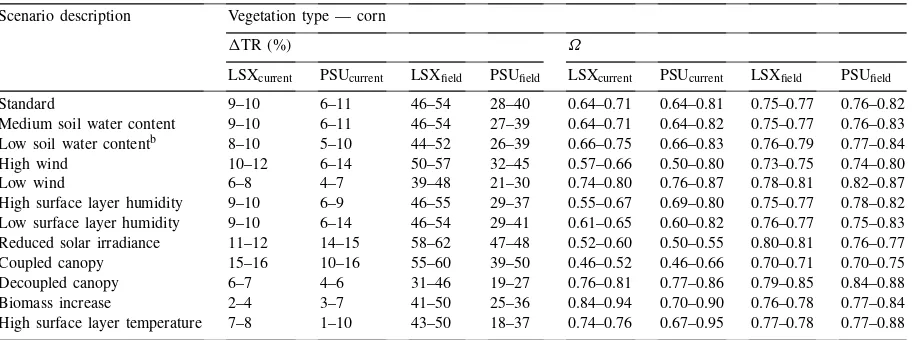
Table 6
The decrease in transpiration andΩfor the 12 corn scenariosa
Scenario description Vegetation type — corn
1TR (%) Ω
LSXcurrent PSUcurrent LSXfield PSUfield LSXcurrent PSUcurrent LSXfield PSUfield
Standard 9–10 6–11 46–54 28–40 0.64–0.71 0.64–0.81 0.75–0.77 0.76–0.82
Medium soil water content 9–10 6–11 46–54 27–39 0.64–0.71 0.64–0.82 0.75–0.77 0.76–0.83 Low soil water contentb 8–10 5–10 44–52 26–39 0.66–0.75 0.66–0.83 0.76–0.79 0.77–0.84
High wind 10–12 6–14 50–57 32–45 0.57–0.66 0.50–0.80 0.73–0.75 0.74–0.80
Low wind 6–8 4–7 39–48 21–30 0.74–0.80 0.76–0.87 0.78–0.81 0.82–0.87
High surface layer humidity 9–10 6–9 46–55 29–37 0.55–0.67 0.69–0.80 0.75–0.77 0.78–0.82 Low surface layer humidity 9–10 6–14 46–54 29–41 0.61–0.65 0.60–0.82 0.76–0.77 0.75–0.83 Reduced solar irradiance 11–12 14–15 58–62 47–48 0.52–0.60 0.50–0.55 0.80–0.81 0.76–0.77 Coupled canopy 15–16 10–16 55–60 39–50 0.46–0.52 0.46–0.66 0.70–0.71 0.70–0.75 Decoupled canopy 6–7 4–6 31–46 19–27 0.76–0.81 0.77–0.86 0.79–0.85 0.84–0.88 Biomass increase 2–4 3–7 41–50 25–36 0.84–0.94 0.70–0.90 0.76–0.78 0.77–0.84 High surface layer temperature 7–8 1–10 43–50 18–37 0.74–0.76 0.67–0.95 0.77–0.78 0.77–0.88
aThe table presents ranges of the respective values — any important differences and diurnal trends are discussed in the text. The
diurnal trend of the decrease in transpiration andΩ for LSX follow generally the same pattern during the day in all the scenarios. The decrease in transpiration had its maximum value early in the morning and in the late afternoon with a minimum value during the middle of the day. The decoupling coefficient,Ω, obtained its maximum value during the middle of the day with minimums in the early morning and later afternoon. In PSUBAMS, the decrease in transpiration andΩ also follow a similar diurnal trend in all scenarios. The decrease in transpiration had its maximum value early in the morning and decreased to its minimum value late in the afternoon. The decoupling coefficient,Ω, had its lowest value early in the morning and increased to its maximum value late in the afternoon. Percent increases in stomatal resistance are not shown as the increase (∼30%) did not vary between scenarios.
bIndicates scenario was conducted under non-water stress conditions.
to 0.8 for the majority of a day with a rapid drop-off later in the afternoon towards zero.
A particularly useful yardstick in understanding
changes inΩunder varying environmental conditions
is the magnitude of the ratio between the stomatal resistance to that of the total aerodynamic resistance (rs/ra). This ratio is important for two reasons. First,
the greater rs/ra, the larger a given percent increase
in stomatal resistance imposed to simulate doubled
[CO2] will impact upon the transpiration. This is
so since an equivalent imposed percent increase in stomatal resistance increases the absolute value of stomatal resistance (rs) if it is initially large, more than if it is initially small and therefore produces more of a change in the total resistance from the leaf through the surface layer (Jarvis and McNaughton, 1986; McNaughton and Jarvis, 1991; Steduto and Hsiao, 1998a–c). This idea is important when viewing the differences between corn and soybeans using the field derived parameterizations where values for the minimum stomatal resistance are very different. Sec-ond, rs/ra varies substantially in the other scenarios
where the environmental conditions alterraso that the sensitivity of transpiration to an increase in stomatal resistance varies. Therefore, the impact of this ratio is evident in Tables 6 and 7 when viewing the differences
inΩ between scenarios. For example, the sensitivity
of transpiration is found to be different between high and low wind conditions as a result of rs/ra being
greater in windy conditions (lower ra) than in calm
conditions.
3. Results
3.1. Corn
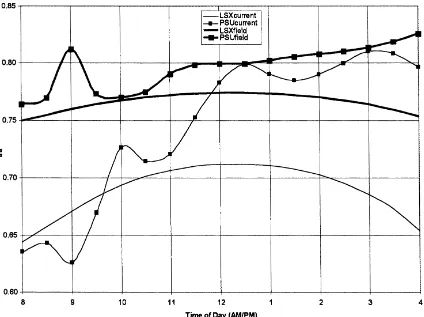
Fig. 1 illustratesΩfor all four cases. The LSXcurrent
and PSUcurrent values demonstrate more sensitivity in
the transpiration to a doubling of [CO2] than LSXfield
and PSUfield. LSXcurrent shows that Ω varies from
a morning value of 0.64 to a maximum of 0.72 at 12:30 p.m. On the other hand, PSUcurrent illustrates a
after-Fig. 1. The diurnal variation inΩfor all four cases for corn.
noon which corresponds to a gradual lessening of the transpiration decrease during the same time. The field derived cases produce a similar pattern with higher ranges of values of 0.75–0.77 (LSXfield) and 0.77–0.82
(PSUfield). These values forΩ are within the range of
values cited by Steduto and Hsiao (1998c) for their corn canopy measurements. What is most interesting between their study and the modeled results presented
here is the trend of Ω as the afternoon progresses.
The modeled values of Ω either remain generally
constant (LSXcurrent and LSXfield) or gradually
in-crease during the afternoon (PSUcurrent and PSUfield)
while the measurements of Steduto and Hsiao (1998c)
show a distinct decrease in Ω during the afternoon
indicating a large degree of coupling later in the afternoon.
These time series of Ω are equivalent to a
per-centage ratio in the range of 28–36% and 20–37%
for LSXcurrent and PSUcurrent and, 23–25% and
18–23% for LSXfield and PSUfield. LSXcurrent and
PSUcurrent was where the decrease in transpiration
was the least, with magnitudes ranging from 9 to 10% (LSX) and 6 to 11% (PSUBAMS). Although not shown, LSX transpiration remained essentially constant during the day while PSUBAMS showed a gradual lessening in the transpiration decrease with a minimum occurring in the late afternoon around
4:00 p.m. LSXfield and PSUfield, however, had a
greater decrease in transpiration ranging from 46 to 55% (LSX) and 28 to 40% (PSUBAMS) with larger differences between both models. The decrease in
transpiration for LSXfield and PSUfield was greater
than LSXcurrent and PSUcurrent because the
stom-atal resistance increase from present day to doubled
[CO2], expressed as a percentage) was much greater
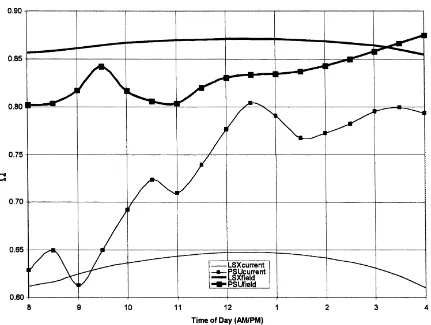
Fig. 2. The diurnal variation inΩ for all four cases for soybeans.
It is important to note that the trends inΩ, as previ-ously described, that occur over the course of the day were equivalent in all the corn scenarios as outlined
in Table 6. Only the change in the magnitude of Ω
changed and is of consequence. The results shown in these tables are consistent with the findings from Ste-duto and Hsiao (1998a–c) for varying environmental conditions as viewed from the departure from a stan-dard set of conditions. For example, under simulated cloudy conditions (reduced solar irradiance), modeled
values ofΩwere lower than the standard scenario and
ranged from 0.50 to 0.60. Low wind conditions simu-lated values ofΩspanning 0.74–0.87 (greater than the standard scenario) while a ‘coupled’ canopy scenario (sparse canopy with small leaves under high winds —
Table 5) indicated values ofΩ ranging from 0.46 to
0.66 (less than the standard scenario).
3.2. Soybeans
Fig. 2 illustrates the sensitivity of transpiration (Ω)
for all four cases. The plot clearly shows that Ω is
greater in magnitude for the field derived SRP cases (LSXfieldand PSUfield) than that for the cases using the
current SRP’s (LSXcurrent and PSUcurrent). LSXcurrent
and PSUcurrentsimulated ranges ofΩfrom 0.61 to 0.65
and 0.63 to 0.80, respectively, while for LSXfield and
PSUfieldthe range was 0.86–0.87 and 0.80–0.87. These
time series ofΩillustrate that the percentage ratio was
in the range of 35–39% and 20–39% for LSXcurrentand
PSUcurrentand, 13–14% and 12–20% for LSXfieldand
PSUfield.
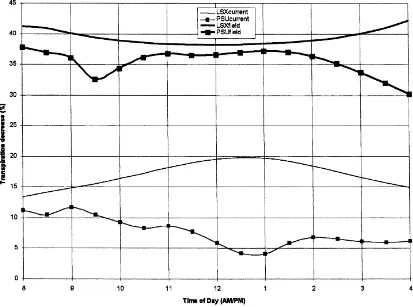
The magnitude of the decrease in transpiration (shown in Fig. 3) for LSXcurrentand PSUcurrentranged
Fig. 3. The decrease in transpiration for all four cases for soybeans.
is illustrated as it manifests some interesting diurnal differences that were not evident in the equivalent corn transpiration plot. These trends are an increase in the transpiration decrease during the day in LSX and a reduced decrease in transpiration during the middle of the day in PSUBAMS. For soybeans, the decrease in transpiration in LSX increases during the day whereas the decrease remained more-or-less constant for corn. For PSUBAMS, the systematic decrease after 11:00 a.m. observed for corn is not ap-parent for soybeans which reverses this trend around 1:00 p.m. These trends in transpiration decrease are due to marked differences in the stomatal resistance
increase from present day to doubled [CO2] during
the day. Such variations were not observed in the corn simulation. The reason for such differences in stomatal resistance are described in the discussion section.
The decrease in transpiration for LSXfield and
PSUfieldrange from 38 to 41% and 30 to 38%,
respec-tively, and are greater than LSXcurrent and PSUcurrent
due to a larger stomatal resistance increase. This stom-atal resistance increase is much greater than the 32% increase in resistance observed solely from measure-ments of minimum stomatal resistance. It is caused
by the increase in f(VPD) and f(T) from present
day to doubled [CO2], especially by f(T) (refer
Table 4). Under the initial conditions chosen for these scenarios, the foliage temperatures were below 303 K (30◦C) so that a large increase inf(T) and, therefore, in stomatal resistance occurred in the majority of these scenarios when incorporating the field derived pa-rameterization into LSX and PSUBAMS. Wilson and Bunce (1997) also showed large increases in stomatal
resistance via an increase in f(T) for cool summer
4. Discussion
4.1. Corn
The results illustrate that for all four cases, as
in-dicated by the magnitude of Ω (Fig. 1), the percent
decrease in transpiration is significantly less than the percent increase in stomatal resistance, i.e. the per-centage ratios modeled are less than those reported in the literature (36–76%) for studies conducted at the scale of a single leaf. These resultant changes are consistent to what was discussed by Field et al. (1995) and illustrated by Carlson and Bunce (1996) and Bunce et al. (1997) which reported transpiration decreases of 1–5% for similar canopy model studies and stomatal resistance increases. The results from LSXfield and PSUfield are best compared with other
quoted 1-D canopy model studies: Pollard and Thomp-son (1995) and HenderThomp-son-Sellers et al. (1995), who reported decreases in transpiration of 28 and 18%, re-spectively, for a 100% increase in stomatal resistance. LSXfield and PSUfield parameterized doubled [CO2]
through increases in stomatal resistance of 150–200% and demonstrated a decrease in transpiration in the range of 28–54%. Although the range is greater than Pollard and Thompson (1995) and Henderson-Sellers et al. (1995), the results here are consistent with their findings since the increase in stomatal resistance illus-trated here is 50–100% larger.
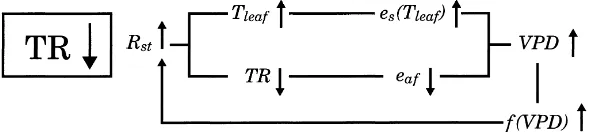
The reduced percentage ratios are a result of neg-ative inter-canopy (LSX and PSUBAMS) and mix-ing layer (PSUBAMS) feedbacks that act to reduce the transpiration decrease initiated by doubled [CO2].
These feedbacks are manifested through an increase
in the VPD from present day to doubled [CO2]. In
Fig. 4a, a schematic demonstrates the mechanisms whereby the VPD feedback acts to decrease the rate of transpiration decline with increasing stomatal resis-tance. This negative feedback is represented in both models. PSUBAMS demonstrates an additional neg-ative feedback that is manifested by the inclusion of a mixing layer. Interaction with the mixing layer acts to produce less of a decrease in transpiration by fur-ther increasing the VPD change from present day to
doubled [CO2]. This produces a more pronounced
restoring gradient for transpiration. Other studies have shown that the change in transpiration was less sen-sitive to an increase in stomatal resistance when a
convective boundary layer was included (Jacobs and DeBruin, 1997; Raupach, 1998).
The processes depicted in Fig. 4a are clearly evi-dent in model output data for some intermediate vari-ables. Fig. 5a–d illustrates the leaf temperature and inter-canopy vapor pressure changes for two scenar-ios in which the transpiration change was observed to be different — the standard scenario and the low wind speed scenario. These data are for the LSXcurrent and
PSUcurrent cases. It can be seen in Fig. 5a–d that in
both scenarios, the leaf temperature increases and the inter-canopy vapor pressure decreases, these in turn produce a restoring gradient for transpiration (VPD) (Fig. 5e). The standard scenario is more sensitive to an increase in stomatal resistance compared to the low wind speed scenario becausers/ra is greater — a
re-sult of a larger aerodynamic resistance (Fig. 5f). The impact of such mixing layer feedbacks is great-est during the afternoon when the surface fluxes have penetrated into the mixing layer. This effect is clearly evident in Fig. 1 for both SRP’s but more easily seen by comparing the models with their original SRPs: Fig. 1 shows that the decrease in transpiration is less (higher values ofΩ) for PSUcurrentthan LSXcurrentfor
the majority of the day starting at around 11:00 a.m. and intensifying over the course of the day.
As is evident in Table 6, the other scenarios show some significant changes in the decrease in transpi-ration where the perturbing of selected initial condi-tions (refer Table 5) alter rs/ra and the VPD to the
extent that the magnitudes of the negative feedbacks are also affected. Both models using both SRP’s indi-cate that the magnitude of the negative feedbacks are less under strong winds, reduced solar irradiance, and strongly coupled canopies (sparse canopies with small leaves under windy conditions). On the other hand, light winds, high solar irradiance, warm temperatures, and strongly decoupled canopies (dense canopies with large leaves under calm conditions) show that the feed-backs are greater in magnitude. The variation of at-mospheric humidity produced no significant change in the transpiration decrease. The scenarios that indicate an increase in the transpiration decline also showed a larger value of rs/ra under present day [CO2] and
vice versa for the scenarios that show a decrease in transpiration decrease. The combination of the two effects — the VPD increase and the magnitude of
transpira-Fig. 4. Schematics of bioatmospheric feedback mechanisms.
tion decrease given a constant increase in stomatal resistance.
The transpiration changes illustrated here are im-portant to water use efficiency (WUE). Doubled
atmo-spheric [CO2] is expected to increase WUE by both
increasing the CO2 assimilation rate and so growth
rate as well as decreasing transpiration. The change in CO2assimilation is not addressed in this study but the
overwhelming majority of the data support the view that doubled [CO2] will increase the CO2assimilation
rate. The results from these canopy simulations in this study suggest the idea that the increase in WUE will not be as great as that reported in the literature for stud-ies conducted at the scale of a single leaf (assuming
CO2assimilation is unchanged between scales). This
is so since the decrease in transpiration for a given stomatal resistance increase (the percentage ratio) is less for these canopy model simulations than that re-ported in the literature for studies conducted at the leaf scale. It is important to note, however, that these
simu-lations were conducted under non-water stress condi-tions which, of course, can significantly alter the water balance in the vegetation and so the WUE.
4.2. Soybeans
The soybean results illustrate a greater diurnal vari-ation for the decrease in transpirvari-ation, but still indicate the existence of negative feedbacks as the percent decrease in transpiration is substantially less than the percent increase in stomatal resistance (high values
of Ω — Fig. 2), i.e. the percentage ratios modeled
are less than those reported in the literature (36–76%) for studies conducted at the scale of a single leaf. As illustrated by Fig. 3, the decrease in transpiration for LSXcurrentincreases during the day as a result of an
in-crease in the stomatal resistance inin-crease. This behav-ior results from a positive VPD feedback as illustrated conceptually in Fig. 4b. The increase in stomatal
during the day is because thef(VPD)2× 4 is greater
thanf(VPD)P 5 as a result of the increase in VPD
from the initial increase in leaf temperature and de-crease in inter-canopy humidity previously described. Feedbacks that would initiate a further increase in the stomatal resistance and, therefore, a decrease in tran-spiration have been described by Jacobs and DeBruin, (1997) and, Raupach, (1998). Consequently, when
simulating a doubled [CO2] environment for soybeans
— in addition to the increase in stomatal resistance
parameterized by f(CO2) — an additional increase
in stomatal resistance occurs as a result off(VPD)2× being greater thanf(VPD)Pover the course of the day.
The positive VPD feedback (Fig. 4) is observed in model intermediate variables similar to the nega-tive VPD feedback. Fig. 6a–d illustrates the leaf tem-perature and inter-canopy vapor pressure changes for both the standard and low wind scenarios. These data
are for the LSXfield and PSUfield cases. Fig. 6a–d
show increases in leaf temperature and decreases in inter-canopy vapor pressure for both scenarios and models. Because the dependence of soybeans to VPD measured in the field is strong (Wilson and Bunce, 1997), the increase in VPD produces a substantial
increase in rs from present day to doubled [CO2]
(Fig. 6f) through f(VPD) (Fig. 6e). The greater
in-crease in VPD and so f(VPD) from present day to
doubled [CO2] for PSUfield is likely the result of the
inclusion of the mixing layer model. This enhanced positive feedback was also cited in Jacobs and De-Bruin (1997). Unlike the low wind scenario for corn, the greater restoring gradient for transpiration simu-lated here has an additional effect on the transpira-tion. Although the restoring gradient for transpiration (negative feedback) occurs, similar to corn, it is com-pensated for and cancelled by the stronger positive
VPD feedback throughf(VPD) (Fig. 4b), since
un-der low wind conditions the leaf temperature increases
more and so VPD, f(VPD), and rs do as well. The
reason the impact on the decrease in transpiration is so pronounced is due to the soybean’s high
sensitiv-ity to VPD — large value for K (VPD constant in
f(VPD); Table 1). Althoughf(VPD)2×is greater than f(VPD)P for corn as well, corn is insensitive to VPD
4 f(VPD) in doubled [CO 2] . 5 f(VPD) in present day [CO
2].
(a lower value ofKinf(VPD)) so that the stomatal
resistance increase is mainly a result off(CO2) only.
LSXfield and PSUfield show less sensitivity in the
transpiration to doubled [CO2] (higher values ofΩ)
compared to LSXcurrentand PSUcurrent. This is a result
of a lowerrs/raratio: the minimum stomatal resistance
for LSXcurrent and PSUcurrent is 50 s m−1 while for
LSXfield and PSUfield it is 24.7 s m−1. Consequently,
the numerator in rs/ra for LSXfield and PSUfield is
lower than for LSXcurrent and PSUcurrent. Moreover,
for the field derived cases, it is important to note that sincers/rais less for soybeans than corn in all scenar-ios, the sensitivity of transpiration for soybeans was less than corn except where otherwise noted.
Unlike corn, the scenarios under different atmo-spheric and surface conditions do not produce clear changes in transpiration decrease for doubled [CO2].
The magnitude of the decrease in transpiration andΩ
in both models varies depending on the initial environ-mental conditions; consequently, generalizations con-cerning the magnitude of the transpiration are more difficult to make for soybeans. Table 7 illustrates the varying nature of the response for the percent transpi-ration decrease andΩfor the remaining scenarios. The differences are imposed by and, depend upon the mag-nitude of the positive feedback induced by the VPD.
5. Conclusion
The results presented here demonstrate that diag-nosing the degree of the decrease in transpiration in a
doubled [CO2] environment is difficult and complex.
as shown by soybeans strong sensitivity to VPD and air temperature, plant physiological feedbacks may also have an impact on the transpiration change in a
dou-bled [CO2] environment. The positive VPD feedback
amplified the stomatal resistance increase and so the decrease in transpiration from present day to doubled
[CO2]. Consequently, diagnosis of the future change
in transpiration in a doubled [CO2] environment
can-not be made solely by observing data gathered at the scale of a single leaf and any decrease in transpiration may very well be small.
The influence of negative feedbacks that impact the decrease in transpiration was observed in both mod-els using both SRPs (current and field derived) for all scenarios investigated. This is because the per-cent decrease in transpiration is always substantially less than the percent increase in stomatal resistance for all simulations as illustrated byΩ. Although the field derived cases showed large decreases in transpira-tion, the magnitudes were only a fraction of the stom-atal resistance increases, indicating that a large degree of ‘decoupling’ occurred between an increase in leaf stomatal resistance and a decrease in canopy transpira-tion. Moreover, as the initial environmental conditions were altered as part of the different scenarios tested, the magnitude of the decrease in transpiration varied. Under all conditions, however, the decreases in tran-spiration were always significantly less than the stom-atal resistance increases. Consequently, if only mod-est increases in stomatal resistance (20–50%) occur in
a doubled [CO2] environment, most likely only
mi-nor decreases in transpiration will occur (if any) and the surface energy balance may not be substantially affected.
Acknowledgements
The authors are indebted to the reviewers for their in depth suggestions on improving the preliminary manuscript. The authors would also like to thank K.B. Wilson for allowing the use of his field mea-surements and providing very helpful insight and advice during the course of this research. Financial support for this research was provided by the United States Department of Agriculture (USDA) under grant 58-1270-3-025. The participation by Robert R. Gillies was supported in part by the Utah Agricultural
Experiment Station, Utah State University, Logan, UT 83322-4810.
References
Akita, S., Moss, D.N., 1972. Differential stomatal response between C3and C4 species to atmospheric CO2concentration
and light. Crop Sci. 12, 789–793.
Aphalo, P.J., Jarvis, P.G., 1993. The boundary layer and the apparent responses of stomatal conductance to wind speed and to the mole fractions of CO2 and water vapor in the air. Plant,
Cell, Environ. 16, 771–783.
Avissar, R., 1993. Observations of leaf stomatal conductance at the canopy scale: an atmospheric modeling perspective. Boundary Layer Meteorol. 64, 127–148.
Baldocchi, D.D., 1992. A langrangian random walk model for simulating water vapor, CO2, and sensible heat flux densities
and scaler profiles over and within a soybean canopy. Boundary Layer Meteorol. 61, 113–144.
Baldocchi, D.D., 1994. A comparative study of mass and energy exchange rates over a closed C3(wheat) and an open C4(corn)
crop: II. CO2 exchange and water use efficiency. Agric. For.
Meteorol. 67, 291–321.
Brown, R.A., Rosenberg, N.J., 1997. Sensitivity of crop yield and water use to change in a range of climatic factors and CO2
concentrations: a simulation study applying EPIC to the central USA. Agric. For. Meteorol. 83, 171–203.
Bunce, J.A., Wilson, K.B., Carlson, T.N., 1997. The effect of doubling CO2 on water use by alfalfa and orchard
grass: simulating evapotranspiration using canopy conductance measurements. Global Change Biol. 3, 81–87.
Carlson, T.N., 1986. Regional scale estimates of soil moisture availability and thermal inertia using remote thermal measurements. Rem. Sens. Rev. 1, 197–247.
Carlson, T.N., Boland, F.E., 1978. Analysis of urban–rural canopy using a surface heat flux/temperature model. J. Appl. Meteorol. 17, 998–1013.
Carlson, T.N., Bunce, J.A., 1996. Will a doubling of atmospheric carbon dioxide concentration lead to an increase or a decrease in water consumption by crops? Ecol. Model. 88, 241–246. Cure, J.D., Acock, B., 1986. Crop responses to carbon dioxide
doubling: a literature survey. Agric. For. Meteorol. 38, 127–145. Eamus, D., 1991. The interaction of rising CO2and temperatures
with water use efficiency. Plant, Cell, Environ. 14, 843–852. Egli, D.B., Pendleton, J.W., Peters, D.B., 1970. Photosynthetic
rate of three soybean communities as related to carbon dioxide levels and solar radiation. Agron. J. 62, 411–414.
Field, C.B., Jackson, R.B., Mooney, H.A., 1995. Stomatal responses to increased CO2: implications from the plant to the
global scale. Plant, Cell, Environ. 18, 1214–1225.
Friend, A.D., Cox, P.B., 1995. Modeling the effects of atmospheric CO2on vegetation-atmosphere interactions. Agric.
For. Meteorol. 73, 285–295.
on canopy transpiration in senescent spring wheat. Agric. For. Meteorol. 93, 95–109.
Henderson-Sellers, A., McGuffie, K., Gross, C., 1995. Sensitivity of global climate model simulations to increased stomatal resistance and CO2 increases. J. Clim. 8, 1738–1757.
Hendrey, G.R., Kimball, B.A., 1994. The FACE program . Agric. For. Meteorol. 70, 3–14.
Hileman, D.R., Huluka, G., Kenjige, P.K., Sinha, N., Bhattacharya, N.C., Biswis, P.K., Lewin, K.F., Nagy, J., Hendrey, G.R., 1994. Canopy photosynthesis and transpiration of field grown cotton exposed to free air CO2 enrichment (FACE) and differential
irrigation. Agric. For. Meteorol. 70, 189–207.
Idso, S.B., Kimball, B.A., Clawson, K.L., 1984. Quantifying effects of atmospheric CO2 enrichment on stomatal conductance and
evapotranspiration of water hyacinth via infrared thermometry. Agric. For. Meteorol. 33, 15–22.
Idso, S.B., Kimball, B.A., Mauney, J.R., 1987. Atmospheric carbon dioxide enrichment effects on cotton midday foliage temperature. Implications for plant water use and crop yield. Agron. J. 79, 667–672.
Jacobs, C.M.O., DeBruin, H.A.R., 1992. The sensitivity of regional transpiration to land surface characteristics: significance of feedback. J. Clim. 5, 683–698.
Jacobs, C., DeBruin, H., 1997. Predicting regional transpiration at elevated atmospheric CO2: influence of the PBL-vegetation
interaction. J. Appl. Meteorol. 36, 1663–1675.
Jarvis, P.G., 1985a. Coupling of transpiration to the atmosphere in horticultural crops: the omega factor. Acta Hort. 171, 187–205. Jarvis, P.G., 1985b. Transpiration and assimilation of tree and agricultural crops: the omega factor. In: Cannel, M.G.R., Jackson, J.E. (Eds.), Attributes of Trees as Crop Plants. Institute of Terrestrial Ecology, England, UK, pp. 460–480.
Jarvis, P.G., McNaughton, K.G., 1986. Stomatal control of transpiration: scaling up from leaf to region. Adv. Ecol. Res. 15, 1–38.
Keeling, C.D., Whorf, T.P., Wahlen, M., van der Pilcht, J., 1995. Interannual extremes in the rate of rise of atmospheric CO2
since 1980. Nature 375, 666–670.
Kimball, B.A., Idso, S.B., 1983. Increasing atmospheric CO2:
effects on crop yield, water use and climate. Agric. Water Manage. 7, 55–72.
Kirkham, M.B., He, H., Bolger, T.P., Lawlor, D.J., Kanemasu, E.T., 1991. Leaf photosynthesis and water use of big bluestem under elevated carbon dioxide. Crop Sci. 31, 1589–1594. Lee, X., Black, T.A., 1993. Atmospheric turbulence within and
above a Douglas fir stand: Part II. Eddy fluxes of sensible heat and water vapor. Boundary Layer Meteorol. 64, 369–389. Lynn, B.H., Carlson, T.N., 1990. A stomatal resistance model
illustrating plant vs. external control of transpiration. Agric. For. Meteorol. 52, 5–43.
McNaughton, K.G., Jarvis, P.G., 1991. Effects of spatial scale on stomatal control of transpiration. Agric. For. Meteorol. 54, 279–301.
Meinzer, F.C., Grantz, D.A., 1989. Stomatal control of transpiration from a developing sugarcane canopy. Plant, Cell, Environ. 12, 636–642.
Morison, J.I.L., 1985. Sensitivity of stomata and water use efficiency to high CO2. Plant, Cell, Environ. 8, 467–474.
Morison, J.I.L., Gifford, R.M., 1984. Plant growth and water use with limited water supply in high CO2 concentrations. I. Leaf
area, water use, and transpiration. Aust. J. Plant Physiol. 11, 361–374.
Mott, K.A., 1990. Sensing of atmospheric CO2 by plants. Plant,
Cell, Environ. 13, 731–737.
Nijas, I., Imprens, I., Behaege, T., 1988. Effects of rising atmospheric carbon dioxide concentration on gas exchange and growth of perennial ryegrass. Photosynthetica 22, 44–50. Owensby, C.E., Coyne, P.I., Ham, J.M., Auen, L.M., Knapp,
A.K., 1993. Biomass production in a tallgrass prairie ecosystem exposed to ambient and elevated CO2. Ecol. Appl. 3, 644–653.
Pallas Jr., J.E., 1965. Transpiration and stomatal opening with changes in carbon dioxide content of the air. Science 147, 171– 173.
Pollard, D., Thompson, S.L., 1995. Use of a land-surface-transfer scheme (LSX) in a global climate model: the response to doubling stomatal resistance. Global and Planetary Change 10, 130–161.
Raupach, M.R., 1998. Influences of local feedbacks on the land-air excahnge of energy and carbon. Global Change Biol. 4, 477– 494.
Rogers, H.H., Sionit, N., Cure, J.D., Smith, J.M., Bingham, G.E., 1984. Influence of elevated carbon dioxide on water relations of soybeans. Plant Physiol. 74, 233–238.
Ross, J.J., 1981. The radiation regime and architecture of plant stands. Tasks for Vegetation Science, Series No. 3. Kluwer Academic Publishers, Dordrecht, 480 pp.
Rozema, J., G.M. Lenssen, R.A. Broekman, W.R. Arp, 1990. Effects of atmospheric carbon dioxide enrichment on salt-marsh plants. In: J. Beukema, et al. (Eds.), Expected Effects of Climatic Change on Marine Coastal Ecosystems, pp. 49–54. Sellers, P.J., 1985. Canopy reflectance, photosynthesis, and
transpiration. Int. J. Rem. Sens. 6, 1335–1372.
Sellers, P.J., Dorman, J.L., 1987. Testing the simple biosphere model (SiB) using point micrometeorological and biophysical data. J. Clim. Appl. Meteorol. 26, 622–651.
Steduto, P., Hsiao, T.C., 1998a. Maize canopies under two soil water regimes. I. Diurnal patterns of energy balance, carbon dioxide flux, and canopy conductance. Agric. For. Meteorol. 89, 169–184.
Steduto, P., Hsiao, T.C., 1998b. Maize canopies under two soil water regimes. II. Seasonal trends of evapotranspiration, carbon dioxide assimilation and canopy conductance, and as related to leaf area index. Agric. For. Meteorol. 89, 185–200.
Steduto, P., Hsiao, T.C., 1998c. Maize canopies under two soil water regimes. III. Variation in coupling with the atmosphere and the role of leaf area index. Agric. For. Meteorol. 89, 201– 213.
Taconet, O., Bernard, R., Vidal-Madjar, D., 1986. Evapotrans-piration over an agricultural region using a surface flux/temperature model based on NOAA-AVHRR data. J. Clim. Appl. Meteorol. 25, 284–307.
Valle, R., Mishoe, J.W., Jones, J.W., Allen Jr., L.H., 1985. Transpiration rate and water use efficiency of soybean leaves adapted to different CO2 environments. Crop Sci. 25,
Watson, R.T.,H. Rodhe, H. Oescheger, U. Siegenthaler, 1990. Greenhouse gases and aerosols. In: J.T. Houghton, G.J. Jenkins, J.J. Ephramus (Eds.), Climate Change: The IPCC Scientific Assessment. Cambridge University Press, Cambridge, pp. 1–40. Wilson, K.B., Bunce, J.A., 1997. Effects of carbon dioxide concentration on the interactive effects of temperature and water vapour on stomatal conductance in soybean. Plant, Cell, Environ. 20, 230–238.
Wilson, K.B., Carlson, T.N., Bunce, J.A., 1999. Feedback significantly influences the simulated effect of CO2on seasonal
evapotranspiration from two agricultural species. Global Change Biol. 9, 903–917.
Zhan, X., D.S. Wilks, 1994. CO2 sensitivity of plant leaf

![Fig. 5. Corn diuranal variation of the (a) standard scenario leaf temperature; (b) standard scenario inter-canopy vapor pressure; (c) lowwind speed scenario leaf temperature; (d) low wind scenario inter-canopy vapor pressure; (e) the increase in vapor pressure from presentday to doubled [CO2] for the standard and low wind speed scenarios, and (f) rs/ra for the standard and low wind speed scenarios.](https://thumb-ap.123doks.com/thumbv2/123dok/3167458.1387274/16.612.85.523.67.566/variation-temperature-temperature-pressure-increase-presentday-scenarios-scenarios.webp)
