Satellite-based estimates of longwave radiation
for agricultural applications
George R. Diak
a,∗, William L. Bland
b, John R. Mecikalski
a, Martha C. Anderson
b aCooperative Institute for Meteorological Satellite Studies (CIMSS/SSEC), Space Science & Engineering Center, University ofWisconsin-Madison, 1225 West Dayton St., Madison, WI 53706, USA
bDepartment of Soil Science, University of Wisconsin-Madison, 1525 Observatory Drive, Madison, WI 53706, USA Received 24 August 1999; received in revised form 6 March 2000; accepted 17 March 2000
Abstract
Geostationary satellites provide information that enables frequent, routine and cost-effective estimates of both downwelling longwave radiation and incident solar radiation for use by agricultural and other applications, at a resolution that cannot be practically matched by ground-based measurements. We develop a new parameterization for downwelling longwave radiation at the earth’s surface that incorporates a simple and accurate method for estimating clear-air downwelling longwave radiation at the surface, a real-time cloud product created from Geostationary Operational Environmental Satellite (GOES) data, plus a modicum of hourly surface synoptic data. This parameterization is tested against pyrgeometer data gathered in Wisconsin in 1998 and produces a RMS accuracy of 20 Wm−2for half-hourly average downwelling longwave radiation and less than 5 Wm−2for 24 h averages. © 2000 Elsevier Science B.V. All rights reserved.
Keywords: Geostationary satellites; Longwave radiation; Pyrgeometers
1. Introduction
The surface longwave radiation budget notably in-fluences two problems in agricultural meteorology: minimum temperature forecasting, and dew depo-sition and drying on crop leaves. Predicting when nighttime temperatures will fall below the damage thresholds of agricultural crops has long challenged biometeorologists, and increasingly sophisticated tools have been developed in response (Heinemann and Martsolf, 1988; Cellier, 1993; Anderson et al., 1998; Diak et al., 1998). The duration of dew, or more generally the presence of liquid water on plant leaves, has implications for outbreaks of foliar disease
∗Corresponding author. Tel.:+1-608-263-5862.
E-mail address: [email protected] (G.R. Diak)
(Jones, 1986). Knowledge of periods of leaf wetness allows farmers to apply preventative fungicides only when warranted, reducing costs and impacts on the environment (Stevenson, 1993).
Lack of operational measurements of incoming longwave radiation has shaped the course of research and development. Pyranometers and satellites pro-vide adequate measurements of shortwave radiation, which dominates the daytime radiation budget, but the longwave-dominated nighttime budget is not so read-ily measured. Longwave radiometers (pyrgeometers) are not routinely deployed in agricultural weather networks because of cost. For minimum temperature forecasting, many nights of interest are calm and cloud-free, so empiricisms for clear-air downwelling longwave radiation are useful. The unexpected ap-pearance of clouds, however, greatly modifies the
surface energy balance, perhaps sufficiently enough to eliminate the need for costly frost protection mea-sures. In the case of leaf wetness, current models infer nighttime radiation and dew-forming conditions from other, simpler measurements, including dew sensors, which detect the presence of liquid water on a leaf-sized artificial plate (Gillespie et al., 1993).
Our objective is to demonstrate that geostationary satellite data can be used to provide frequent, rou-tine and cost-effective estimates of downwelling long-wave radiation at a resolution that is impractical to match by ground-based measurements. The longwave method developed is extremely simple, taking advan-tage of an existing real-time cloud product derived from geostationary satellite data, and employing only two pieces of additional information: values of the shelter-level (2 m) air temperature and vapor pressure (or dewpoint temperature used to calculate vapor pres-sure), obtained from any source.
In the following section, we describe tools needed to implement and evaluate the method, and in Section 3 we describe the method in detail. In the following sections, we evaluate the proposed function and ana-lyze potential implications of the fact that the satellite can see only the cloud tops, but longwave radiation at the surface is affected by the cloud base temperature. Finally, we compare the method with field measure-ments.
2. Methods
Below we describe the satellite-based observations that make the method possible, a synthetic longwave radiation database that we generated to evaluate the general form of our proposed algorithm, and a valida-tion dataset of pyrgeometer measurements.
2.1. GOES-derived cloud product
The evaluation of clouds from Geostationary Oper-ational Environmental Satellite (GOES) data is based on the so-called ‘CO2slicing’ technique (Menzel et al., 1983; Schreiner et al., 1993), which estimates cloud top pressure and temperature, and the ‘effective’ cloud fraction, C, which is the dimensionless product of the
cloud areal fraction times the cloud infrared emis-sivity. This algorithm uses radiation measurements in
three spectral channels in the CO2 absorption band between 13 and 15mm, and a channel in the
in-frared window at 11.2mm; these four channels have
a 7–10 km resolution (depending on satellite viewing angle). The three channels in the CO2 absorption band differentiate the cloud-top pressure and temper-ature, while the longwave infrared window channel is used to quantify the effective cloud amount. During the daytime, the visible imaging channel also is used to identify cloud presence.
Wylie and Menzel (1989) compared the CO2slicing method to three independent sources of cloud infor-mation: rawinsondes, lidar scans of clouds and satel-lite stereo parallax measurements. Cloud heights from CO2 slicing were within 40 hPa (RMS) of the raw-insonde measurements and agreed with the lidar and satellite parallax measurements to accuracies of 80 and 50 hPa, respectively. Schreiner et al. (1993) estimated an accuracy of 0.2 in the estimation of C. They present evidence that satellite- and surface-based observa-tions of clouds may be combined in a complementary manner. The CO2 slicing method performs best at identifying and quantifying the characteristics of high-and mid-level clouds high-and has occasional difficulty identifying low clouds over snow due to the variable emissivity of snow surfaces. Strong boundary layer temperature inversions also cause low-level clouds to occasionally be misrepresented in the algorithm. We will discuss the effects of these errors on the down-welling longwave algorithm in more detail in later sections.
The CO2 slicing algorithm quantifies an effective single layer of cloud. If the top-level clouds are spa-tially continuous and even of modest cloud water con-tent, the evaluation will emphasize the characteristics of this top-most cloud deck. This is because it takes very little vertically-integrated cloud water or cloud ice content to make both water and ice clouds radiatively ‘black’ at infrared wavelengths. If there are physical gaps in the top-level clouds and there are clouds at other levels below, the cloud evaluation will be an amalgamation of the characteristics of several cloud layers.
Meteorolog-ical Satellite Studies (CIMSS) and also at NOAA in Washington, DC (Hayden and Wade, 1996). A selection of composite cloud product images from GOES-8 and GOES-10 data can be viewed on the CIMSS home page (http://cimss.ssec.wisc.edu/) and on the NOAA home page (http://www.noaa.gov/).
The work detailed here used the standard cloud product output from the NOAA/ASPT at the time when the validation pyrgeometer data were collected (1998). This output consists of 3×3 pixel summaries (representing approximately a 30 km2 box) and in-cludes the mean and standard deviation of cloud-top pressure and average effective cloud fraction (C) for the nine pixels, the average cloud top temperature (Tc) for the cloudy pixels within the sample box, and the number of pixels within the box diagnosed as cloudy.
2.2. Synthetic longwave radiation database
A detailed radiative transfer model (Chou and Ark-ing, 1980; henceforth ‘C–A’ or ‘the C–A model’) was used to compute downwelling longwave flux at the earth’s surface for a large sample of atmospheric pro-files. The C–A model explicitly takes into account the vertical structure of atmospheric temperature and moisture, and clouds can be inserted at any model level. The required atmospheric profiles of tempera-ture and moistempera-ture were provided by forecast model output of the CIMSS Regional Assimilation System (Wu et al., 1995; Diak et al., 1998). The domain of this model, centered on the continental United States, extends in the latitudinal direction from about 20 to 65◦ N and longitudinally from approximately 60 to 120◦W, with a spatial resolution (grid size) of approx-imately 60 km.
Model forecast fields (three-dimensional fields of atmospheric temperature and humidity) for the day of 10 November 1999 were sampled at an interval of 3 by 3 model grid elements to produce 1064 atmo-spheric soundings, extending over the full latitude and longitude bounds of the forecast model domain (at 39 pressure levels from the surface to about 50 hPa). The resulting atmospheric profiles of temperature and moisture vary greatly in their basic character from sub-tropical to sub-arctic and include land and oceanic regions. Surface pressures at sample locations vary from greater than 1020 hPa to less than 750 hPa in mountainous regions of the domain.
Clear-air downwelling longwave flux values at the surface were calculated with the C–A model for each of these 1064 soundings. To incorporate cloud con-tributions into calculations of the surface longwave flux, clouds (with emissivity equal unity) were inserted in each of the 1064 atmospheric profiles at varying pressure levels and the resulting cloudy downwelling longwave flux was calculated from the C–A model. In each profile, clouds were sequentially inserted at pressure levels of 0.10, 0.35, 0.5 and 0.90 times the surface pressure, representing a large range of cloud heights and temperatures; the temperatures of these cloud levels were assumed to be the air temperature at that pressure level. Only one level of cloud at a time was inserted in any sounding (e.g. to calculate the ef-fects of single-level clouds on downwelling longwave radiation). Cloud pressures were also limited to the maximum and minimum values allowed in the satel-lite cloud product (900 and 100 hPa, respectively).
The resulting synthetic longwave flux data set con-sisted of 1064 soundings×five cloud conditions (one of the conditions being no clouds), or 5320 total sam-ples, of which 4256 had clouds. These detailed C–A model longwave flux calculations served as proxy longwave data to investigate methods for evaluating cloudy downwelling longwave flux from our surface and satellite database.
2.3. Pyrgeometer measurements
Pyrgeometers (Model PIR, Eppley Laboratory, Newport, RI) were deployed during spring and sum-mer of 1998 at two agricultural sites in Wisconsin (at approximately latitude/longitude 46.0◦N−89.60◦W and 44.35◦N−89.89◦W).
3. Longwave radiation algorithm
The proposed method uses the GOES-derived cloud product to modify an empiricism for the downwelling longwave radiation for clear conditions (Wm−2), es-timated from Prata (1996) as
LWdc=εa(p)σ Ta4 (1)
with the clear-air emissivity (dimensionless) written
εa(p)=1−(1+c1(ea/Ta))exp(− p
c2+c3(ea/Ta)). (2) In Eqs. (1) and (2), σ is the Stefan–Boltzmann con-stant (Wm−2K−4), eathe vapor pressure (hPa), Tathe air temperature (K), and c1, c2 and c3 are constants with nominal values of 46.5, 1.20 and 3.0, respec-tively. The subscript ‘p’ on the atmospheric clear-air emissivity is added to denote that it is derived via the Prata formulation.
The range of atmospheric emissivity is only from about 0.60 to 0.95, depending most importantly on lower atmospheric moisture content. The Prata formu-lation had a respectable RMS accuracy of between 10 and 14 Wm−2in tests over various terrestrial regimes (Prata, 1996) for half-hourly average fluxes. It was also the most accurate of several similar parameter-izations that we investigated using pyrgeometer data taken at two Wisconsin agricultural locations in 1998 (data not shown).
Many such simple algorithms for clear-air down-welling longwave flux have been developed in the past 40 years or so, employing various levels of em-piricism (see the discussion of the historical develop-ment of such algorithms and accuracy comparisons in Prata, 1996, and most produce relatively accurate results, considering their empirical or quasi-empirical nature. The general success of the methods for esti-mating clear-air longwave radiation relies on the fact that the majority of clear-air downwelling atmospheric
longwave radiation to the earth’s surface emanates from the lowest several hundred meters of the at-mosphere (Schmetz, 1989; Prata, 1996 and other
re-searchers). This atmospheric region can be adequately characterized for longwave radiation estimates using low-level measurements of air temperature and humid-ity. The temperature structure of levels higher in the atmosphere is generally of secondary importance for clear-air longwave fluxes at the surface.
We took as a general relationship for cloudy down-welling longwave radiation a variation from Monti-eth and Unsworth, 1990, which adds the ‘C’ term described above, i.e. the satellite-derived effective cloud fraction.
LWd=LWdc+(1−εa(p))Cσ Tc4. (3) In Eq. (3), LWd is the total downwelling flux in-cluding clouds (Wm−2), LWdcthe clear-air flux from Eq. (1), (1−εa(p)) the effective transmissivity of the atmosphere beneath the clouds, C the effective cloud fraction from the GOES cloud product, and Tc (K) the cloud temperature. For the following algorithm development and error assessment phases, the C term (areal cloud fraction times the infrared emissivity) was assumed to be equal to unity to duplicate the cloud emissivity values assigned in generating the cloudy C–A flux dataset.
4. Algorithm validation using the synthetic longwave database
The synthetic longwave database allowed us to test two issues. First of these is the overall validity of Eq. (3), including the Prata clear-air flux formulation, evaluated with a cloud-base temperature (Tcb) for Tc. The second issue examined was potential error arising from the fact that longwave radiation at the surface is affected by the temperature of the cloud base, but the satellite views the cloud top for horizontally homoge-neous clouds, and some amalgamation of cloud levels for broken cloud decks.
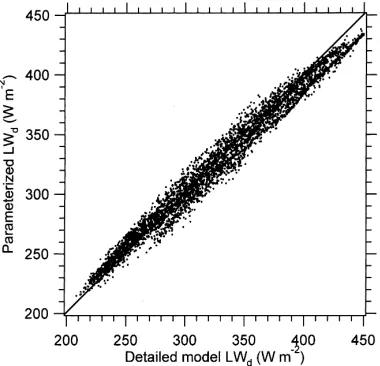
In the first test, Tcbvalues were set equal those used in the corresponding C–A calculations. The parame-terized longwave estimates based in Eq. (3) were then compared to corresponding values from the rigorous C–A cloudy calculations. As shown in Fig. 1, the accu-racy of this test is encouraging, with a RMS difference of 8 Wm−2 and a bias of +1 Wm−2. These results indicate that the basic form of the relationship is use-ful and that the Prata empiricism is reasonable when combined with an estimate of the cloudy flux contri-bution obtained from the cloud-base temperature.
Fig. 1. Parameterized vs. C–A values of downwelling longwave radiation (Wm−2). The RMS error of parameterized vs. C–A down-welling longwave fluxes is about 8 Wm−2with the bias between the two data sets (parameterized minus C–A) being about+1 Wm−2.
method. Part of the accuracy achieved in the parame-terized cloudy longwave calculations is also due to the cancellation of total error that occurs when there are errors in the evaluation of the Prata clear-air emissivity (εa(p)). Under cloudy conditions whenεa(p) is
under-estimated, so is the clear-air longwave flux term,
how-ever, the cloud contribution, proportional to (1−εa(p)) is overestimated, hence a partial cancellation in the total flux errors. Flux error compensation occurs in the opposite direction between clear and cloudy terms with the overestimation ofεa(p).
As a consistency check, this experiment was re-peated using a second independent set of atmospheric profiles extracted from forecast model output on Day 2, 20 December 1999. In this case, clouds were in-serted at levels of 0.15, 0.25, 0.40 and 0.75 times the surface pressure (differing from the levels used in the previous experiment). The RMS flux accuracy was somewhat superior to the first data set (data not shown). The RMS accuracy of the parameterized ver-sus C–A fluxes was about 4 Wm−2for a sample size of 3564. The bias value (parameterized — C–A fluxes) for the data set was about+3 Wm−2.
Regarding a second major issue, the satellite data provides estimates of cloud top temperature rather than the cloud base temperature, and cloud-base infor-mation is more significant for estimating downwelling
radiation at the surface. The extreme variability of clouds makes it difficult to rigorously evaluate the sig-nificance of this issue. Other studies (Schmetz, 1989; Ellingson, 1993 and others) have also looked at the problems associated with satellite cloud-base evalua-tions for estimating longwave radiation and have found no reliable solutions at any level of complexity.
A simple experiment was performed with the syn-thetic data to estimate the significance of this mis-match. The 20 December forecast model data set was reprocessed, this time increasing each of the cloud-base levels by 0.075 times the surface pressure (approximately 75 hPa). Depending on atmospheric pressure level, this would represent a difference in cloud base of roughly 0.5–1 km closer to the surface than in the first experiment with this 20 December dataset. We take the difference in cloudy fluxes pro-duced between the two experiments on 20 December as a very basic indication of what flux errors might be incurred due to a bias (cloud base estimated too high) in the evaluation cloud base pressure and corre-sponding temperature. Relatively modest differences were obtained (Fig. 2), and they are fairly consistent across the range of downwelling longwave radiation values (e.g. across cloud heights and atmospheric con-ditions). Augmenting cloud-base pressures by 75 hPa
produced, as expected, systematically higher values of downwelling longwave fluxes at the surface due to the general increase of atmospheric temperature with increasing pressure, but the average difference is only about 5 Wm−2. The results discussed here (Fig. 2) are parameterized flux evaluations (i.e. Eq. (3)). A similar evaluation using the C–A model output yielded nearly identical results. The RMS flux errors at the cloud-base level are undoubtedly of larger average magnitude than 5 Wm−2, but again are attenuated by the factor of (1−εa(p)) before being realized as flux errors at the surface.
High values of atmospheric transmittance (e.g. low emissivity values and high values of (1−εa(p))) occur most often when the atmosphere is cold and dry. With such high values of transmittance, a larger fraction of the flux error from misevaluation of cloud base temperature is realized at the surface, but the cold temperatures mean low cloud thermal emission, a compensating process. We note that this compensa-tion may not be the case for dry atmospheres in warm regions, such as desert environments.
5. Implementation and comparison to pyrgeometer measurements
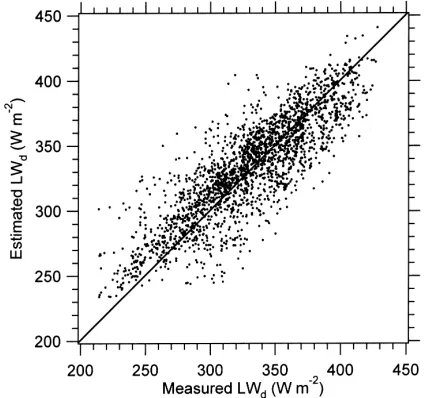
Actual implementation of the method involved using C (the ‘effective’ cloud fraction) and Tc (the cloud-top temperature) in Eq. (3), both of these quan-tities provided from the GOES cloud product. The satellite-based estimates agree with the pyrgeometer measurements to about 20 Wm−2RMS (Fig. 3), while averaging to 24 h improves the accuracy of results to less than 5 Wm−2.
Flux errors (parameterized versus measured) were compared to each of the two GOES-derived parame-ters on which the procedure depends. There was es-sentially no dependence of errors on the magnitude of C. In comparison, flux errors were inversely pro-portional to cloud-top atmospheric pressure level, i.e. errors increased with decreasing cloud altitude. It is known that the satellite cloud product loses accuracy in the detection and quantification of clouds nearer to the surface (Schreiner et al., 1993). Closer inspec-tion of visual and infrared satellite imagery, the GOES cloud product, and pyrgeometer records on several days with large disparities between measured and
es-Fig. 3. Comparison of downwelling longwave radiation (Wm−2) made from the GOES cloud product with 30 min averages from pyrgeometer measurements at two Wisconsin agricultural stations. timated fluxes confirm that significant errors in flux estimates are often due to the misrepresentation of clouds at low levels in the GOES product.
The average cloud-free net longwave balance at the surface was about minus (outbound) 80 Wm−2in our C–A model datasets. Putting the 20 Wm−2 accuracy results of our method into this perspective, there are roughly four levels (80/20) of information provided on the cloud contribution to the downwelling longwave radiation at the surface between clear and fully cloud conditions.
If desired, net longwave radiation can be calculated by combining Eq. (3) with an estimate of upwelling radiation (LWu) from the surface:
LWu=εσ Ts4+LWd(1−εs), (4) where εs is the land-surface surface emissivity and
Ts the land-surface radiometric temperature. The first term on the right hand side is emission from the sur-face, while the second term accounts for atmospheric longwave radiation reflected by the surface (all terms in this equation have units of Wm−2). Note that the emissivity effect in the two right-hand-side terms is of opposite sign for the upwelling flux, partially mitigat-ing errors in knowledge ofεs.
temperature Ts. This approximation is most robust for surfaces of relatively high vegetative cover and water availability, typical of agricultural settings. Greater er-ror is likely in semi-arid or bare-soil areas under clear conditions where Tscan be significantly above Ta dur-ing the daytime, and significantly below at night. Any information regarding land-surface temperature (ver-sus air temperature) that the user is able incorporate into Eq. (4) will improve its accuracy.
6. Discussion and conclusions
The performance of our method for estimating LWd falls within the range of that documented for other satellite-based algorithms (Schmetz, 1989), yet is sim-ple and the data needed are readily available in near real time. The output of the GOES cloud product has recently been upgraded to single-pixel (10 km) detail on the effective cloud fraction and cloud top pressure (versus the 3×3 pixel summary data tested here), allowing better spatial geolocation of the satel-lite cloud data than possible in the analysis here. The NOAA/ASPT is expending considerable effort to im-prove the satellite-based evaluation of clouds at lower atmospheric levels, which also should improve the flux estimates of our procedures.
Finally, real-time applications of satellite-derived longwave radiation estimates have been detailed in Anderson et al. (1998) and Diak et al. (1998). A frost protection decision support system for cran-berry growers in Wisconsin incorporates the satellite longwave radiation product. A decision support prod-uct to estimate the risk of foliar disease in potato (largely dependent on estimating the duration of foliar wetness) employs the longwave radiation estimates that have been described in this work, as well as satellite-derived solar radiation estimates that have been discussed in Diak et al. (1996).
Acknowledgements
This research was supported by NASA Grants NAG5-2877 and NAG5-6457.
References
Albrecht, B., Cox, S.K., 1977. Procedures for improving pyrgeometer performance. J. Appl. Meteorol. 16, 188–197.
Anderson, M.C., Bland, W.L., Diak, G.R., Norman, J.M., 1998. An automated cranberry frost forecasting system with real-time ingestion of surface and satellite observations. In: Proceedings of the 23rd Conference on Agriculture and Forestry Meteorology. AMS, Albuquerque, NM, pp. 5–6.
Cellier, P., 1993. An operational model for predicting minimum temperatures near the soil surface under clear sky conditions. J. Appl. Meteorol. 32, 871–883.
Chou, M.D., Arking, A., 1980. Computation of infrared cooling rates in water vapor bands. J. Atmos. Sci. 37, 855–867. Diak, G.R., Anderson, M.C., Bland, W.L., Mecikalski, J.R.,
Norman, J.M., Aune, R.M., 1998. Agricultural management decision aids driven by real-time satellite data. Bull. Am. Meteorol. Soc. 79, 1345–1355.
Diak, G.R., Bland, W.L., Mecikalski, J.R., 1996. A note on first estimates of surface insolation from GOES-8 visible satellite data. Agric. For. Meteorol. 82, 219–226.
Ellingson, R.G., 1993. Surface longwave fluxes from satellite observations: a critical review. Remote Sens. Environ. 51, 89–97.
Gillespie, T.J., Stristava, B., Pitblado, E.R., 1993. Using operational weather data to schedule fungicide sprays on tomatoes in southern Ontario, Canada. J. Appl. Meteorol. 32, 567–573. Hayden, C.M., Wade, G.S., 1996. Derived product imagery from
GOES-8. J. Appl. Meteorol. 2, 153–162.
Heinemann, P.H., Martsolf, J.D., 1988. Prediction of cooling of a nocturnal environment using two atmospheric models. J. Appl. Meteorol. 27, 473–481.
Jones, A.L., 1986. Role of wet periods in predicting foliar diseases. In: Leonard, K.J., Fry, W.E. (Eds.), Plant Disease Epidemiology, Vol. 1. Population Dynamics and Management. Macmillan, New York, pp. 87–100.
Montieth, J.L., Unsworth. M.H., 1990. Principles of Environmental Physics, 2nd Edition. Arnold, New York, 291 pp.
Menzel, W.P., Smith, W.L., Stewart, T.R., 1983. Improved cloud motion wind vector and altitude assignment using VAS. J. Climate Appl. Meteorol. 22, 377–384.
Prata, A.J., 1996. A new long-wave formula for estimating downward clear-sky radiation at the surface. Q.J.R. Meteorol. Soc. 122, 1127–1151.
Schmetz, J., 1989. Towards a surface radiation climatology: retrieval of downward irradiances from satellites. Atmos. Res. 23, 287–321.
Schreiner, A.J., Unger, D.A., Menzel, W.P., Ellrod, G.P., Strabala, K.I., Pellet, J.L., 1993. A comparison of ground and satellite observations of cloud cover. Bull. Am. Meteorol. Soc. 74, 1851–1861.
Stevenson, W.R., 1993. Management of early blight and late blight. In: Rowe, R.C. (Ed.), Potato Health Management. APS Press, St. Paul, MN, pp. 141–148.
Wu, X., Diak, G.R., Hayden, C.M., Young, J.A., 1995. Short-range precipitation forecast using assimilation of simulated satellite water vapor profiles and cloud liquid water amounts. Mon. Wea. Rev. 123, 347–365.